
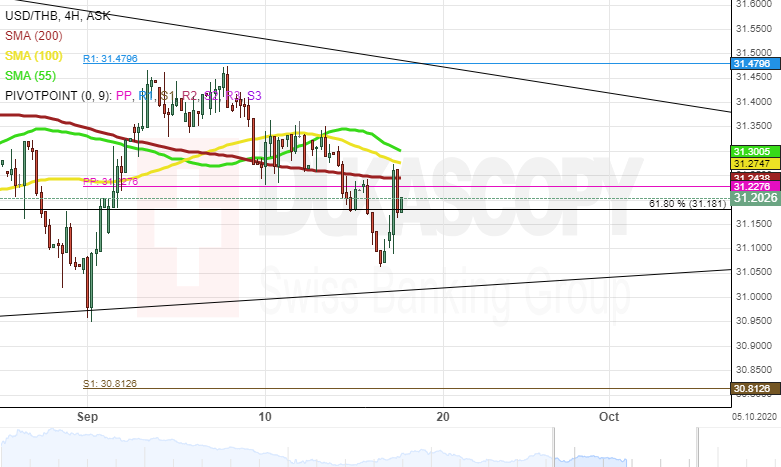
The USD/THB exchange rate has been trading within a symmetrical triangle pattern since the end of June.
From a theoretical perspective, it is likely that the currency pair could consolidate within the given pattern until the second half of October.
In the meantime, note that the exchange rate is pressured by the 55-, 100– and 200-period moving averages in the 31.24/31.33 area. Thus, a breakout south could occur in the nearest future. In this case the rate could face the support level—the monthly S1 at 30.81.


