
Key Highlights
- Crude oil price is struggling to gain bullish momentum above $40.00 and $41.00.
- A crucial bearish trend line is forming with resistance near $40.20 on the 4-hours chart of XTI/USD.
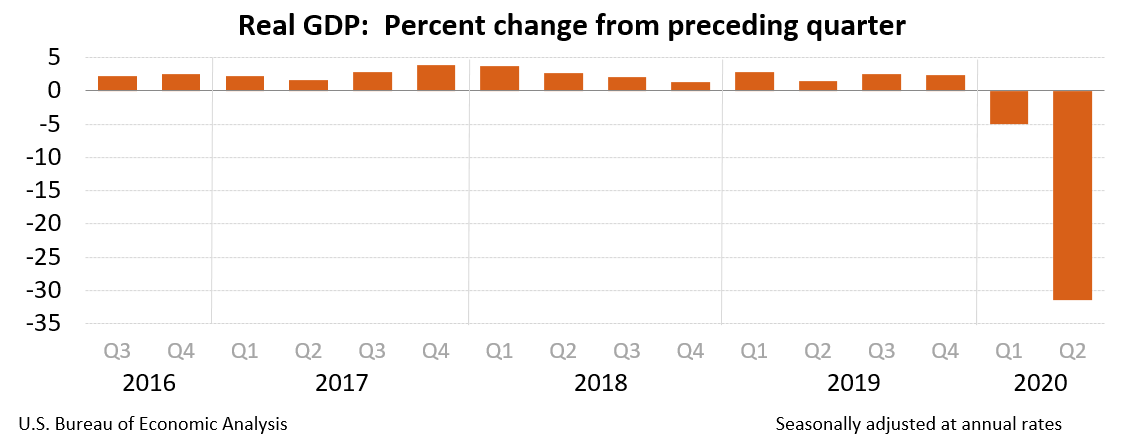
- The US GDP contracted 31.4% in Q2 2020, less than the market forecast of -31.7%.
- The US ISM Manufacturing Index could increase from 56.0 to 56.3 in Sep 2020.
Crude Oil Price Technical Analysis
In the past few days, crude oil price made a few attempts to surpass the $41.00 resistance against the US Dollar, but it failed. The price corrected lower below $38.80 and it seems like there are bearish signs emerging.
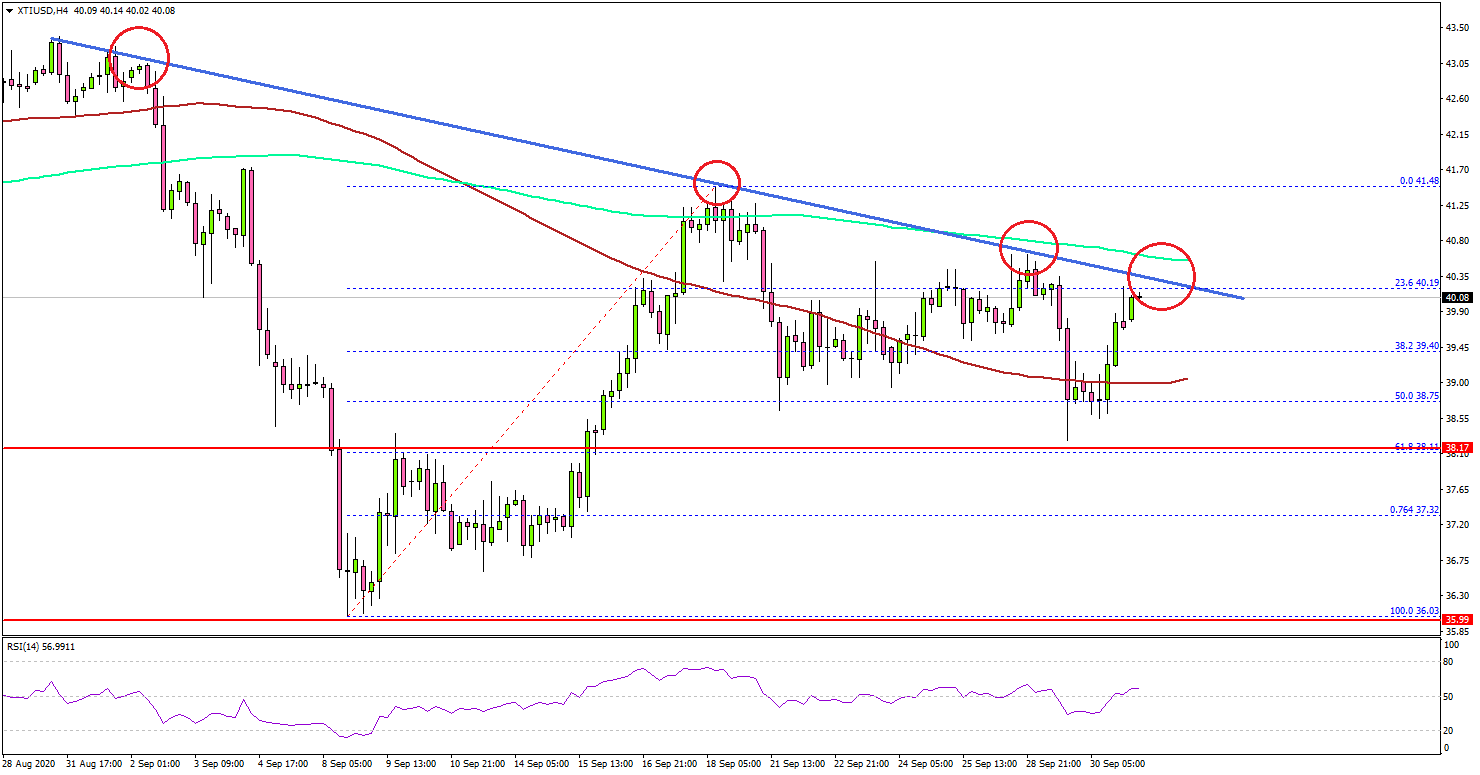
Looking at the 4-hours chart of XTI/USD, the price struggled to clear the $41.50 level and the 200 simple moving average (4-hours, green). There is also a crucial bearish trend line forming with resistance near $40.20.
The price corrected lower below the $40.50 and $38.80 support levels. There was also a break below the 50% Fib retracement level of the upward move from the $36.03 low to $41.49 high.
The price traded close to the $38.00 support level, and tested the 61.8% Fib retracement level of the upward move from the $36.03 low to $41.49 high. If there are more losses below the $38.20 and $38.00 levels, there is a risk of a larger decline towards the $36.00 support level in the near term.
Conversely, the price might attempt another upside break above the $40.20 and $40.50 levels. A successful close above the $41.00 level and the 200 simple moving average (4-hours, green) could increase the chances of a sustained upward move. The next key resistance could be near $43.50.
Fundamentally, the US Gross Domestic Product Annualized for Q2 2020 was released yesterday by the US Bureau of Economic Analysis. The market was looking for a decline of 31.7% in the GDP.
The actual result was close to the market forecast, as the US GDP contracted 31.4% in Q2 2020. Besides, the GDP Price Index declined 2.1%, less than the last -2.3%.
The report added:
The decline in second quarter GDP reflected the response to COVID-19, as “stay-at-home” orders issued in March and April were partially lifted in some areas of the country in May and June, and government pandemic assistance payments were distributed to households and businesses.
Overall, crude oil price is facing an uphill task near $40.20 and $41.00. Looking at EUR/USD, the pair struggled to surpass the 1.1750 resistance level. Similarly, GBP/USD is still well below the 1.3000 resistance.
Economic Releases to Watch Today
- Germany’s Manufacturing PMI Sep 2020 – Forecast 56.6, versus 56.6 previous.
- Euro Zone Manufacturing PMI Sep 2020 – Forecast 53.7, versus 53.7 previous.
- UK Manufacturing PMI Sep 2020 – Forecast 54.3, versus 54.3 previous.
- US Manufacturing PMI Sep 2020 – Forecast 53.8, versus 53.5 previous.
- US Initial Jobless Claims – Forecast 850K, versus 870K previous.
- US ISM Manufacturing Index Sep 2020 – Forecast 56.3, versus 56.0 previous.


