
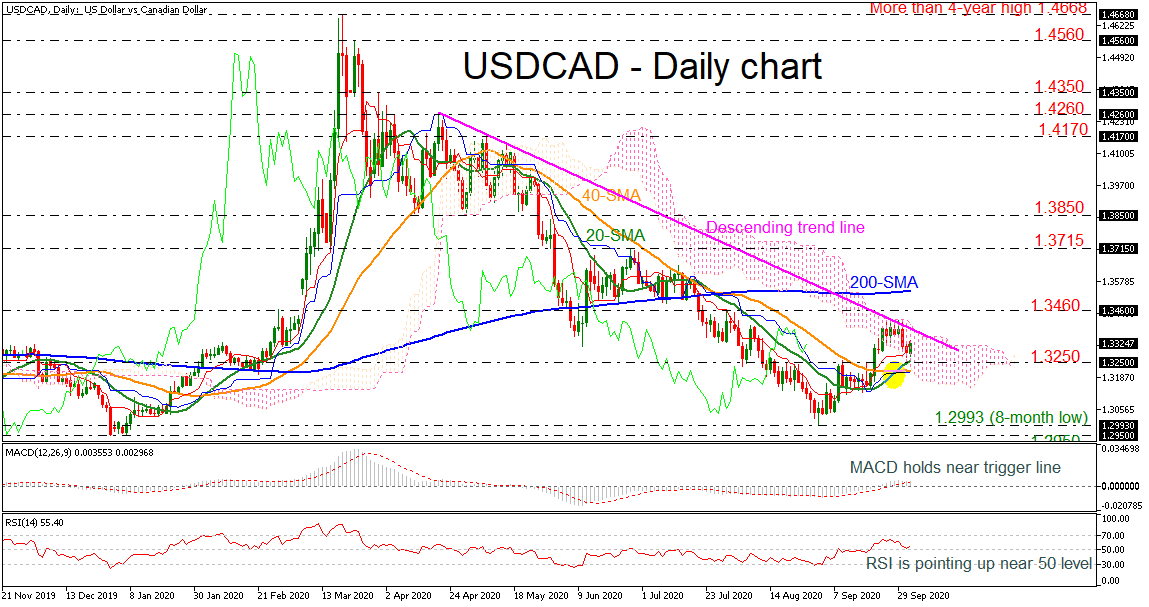
USDCAD is pointing slightly up after the strong downfall from the upper surface of the Ichimoku cloud and the falling trend line around 1.3420. The 20- and 40-day simple moving averages (SMAs) created a bullish crossover near the 1.3250 barrier suggesting an upside pullback in the short-term. The MACD oscillator is flattening in the positive territory, while the RSI is ticking up near 50.
The negative bias in the medium-term is still in place and if there is a successful attempt beneath the 20- and 40-day SMAs the price could hit the eight-month low of 1.2993. A drop below this level, the market could move towards the nearest support at 1.2950.
Alternatively, a closure above the upper surface of the cloud, the 1.3460 resistance and the downtrend line could take the market towards the 200-day SMA currently at 1.3540. Breaching this level, the 1.3715 and 1.3850 resistances could come in the spotlight.
To sum up, USDCAD has been in a descending movement over the last six months and only an increase above the descending trend line and the 200-day SMA may shift the outlook to neutral-to-bullish.


