
The EUR/USD currency pair
Technical indicators of the currency pair:
Prev Open: 1.1839
Prev Close: 1.1853
% chg. over the last day: +0.11%
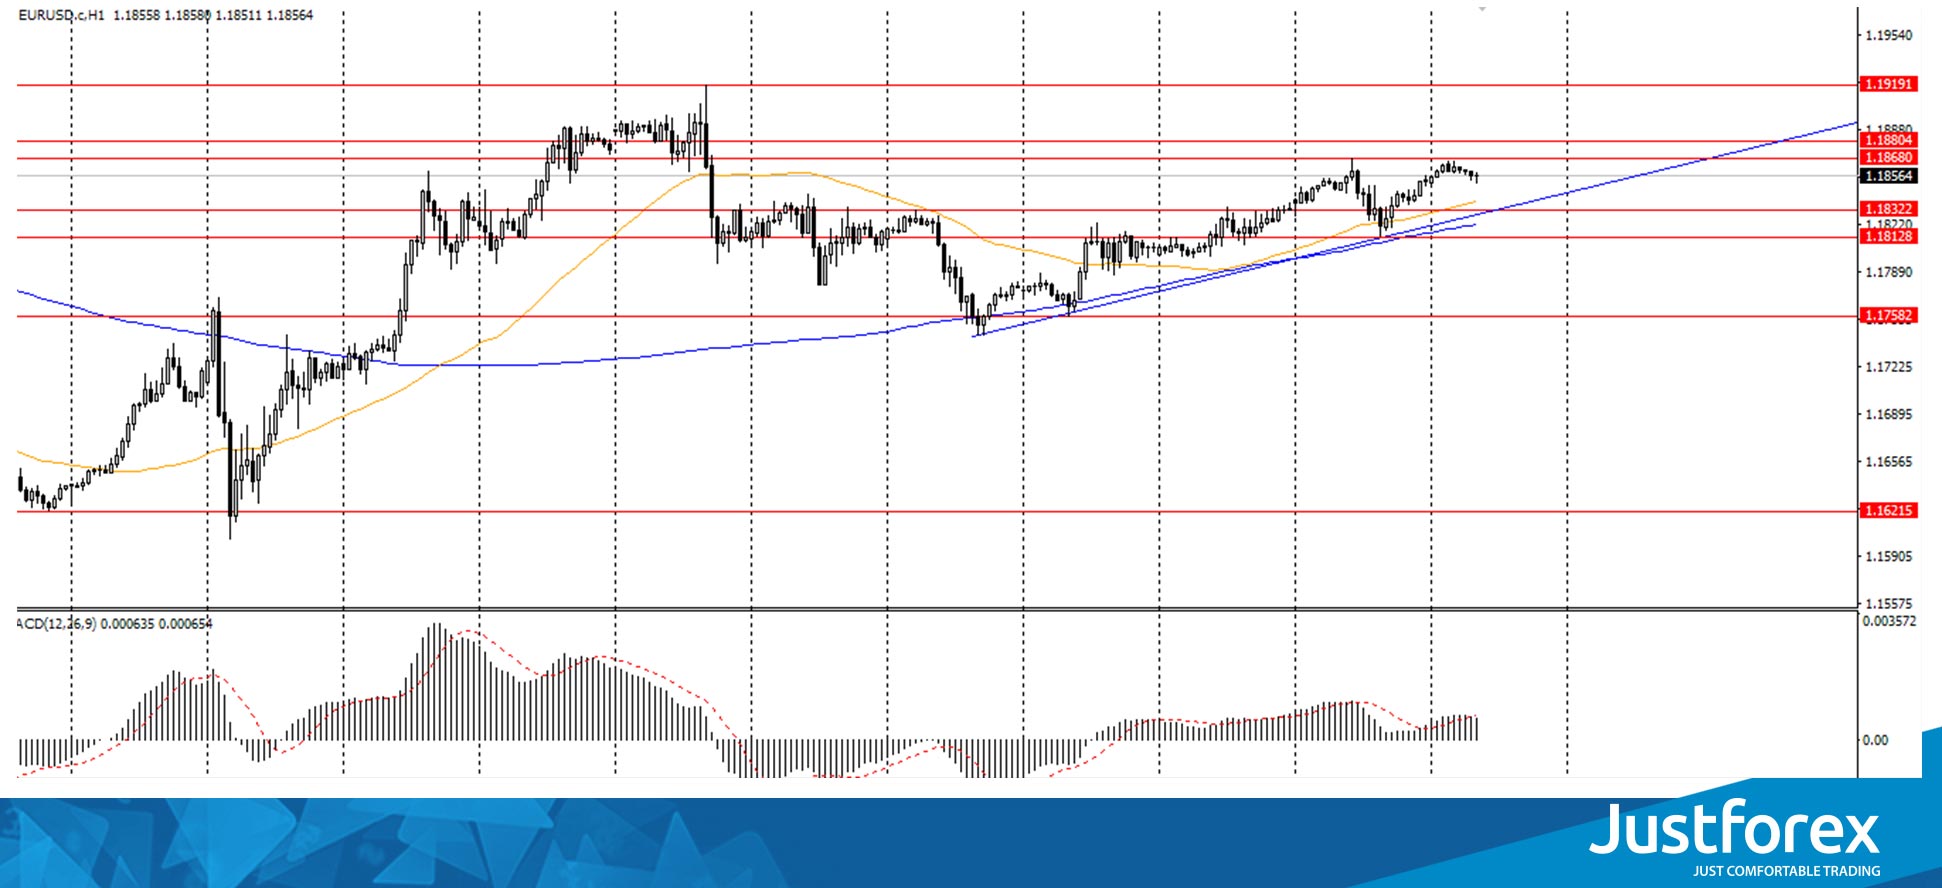
Yesterday, the EUR/USD currency pair was traded within the range of 1.1812-1.1868 and showed a positive trend of 0.11%. The currency pair is being traded in a narrow daily range near the previous day’s close this morning. The uptrend is observed, which indicates the predominance of purchases on this asset. On the hourly timeframe, the price is being traded above the moving average MA 200. On the H4 timeframe, the situation is similar. The MACD indicator is in the positive zone. Based on the above, it is worth considering buy positions while the price is above MA200 on the H1 timeframe.
Trading recommendations
Support levels: 1.1832, 1.1812, 1.1758
Resistance levels: 1.1868, 1.1880, 1.1920
The main scenario for EUR/USD trading is looking for buy entry points. It is better to wait for a pullback to the level of 1.1832 and form a long position when a signal is generated. The first target is the level of 1.1868.
Alternative scenario: if the price fixes below 1.1812 on the H1 timeframe, the currency pair is likely to decline to 1.1758
News feed for 2020.11.17:
- US retail sales at 15:30 (GMT+2);
- Speech by the ECB President Lagarde at 18:00 (GMT+2).
The GBP/USD currency pair
Technical indicators of the currency pair:
Prev Open: 1.3170
Prev Close: 1.3199
% chg. over the last day: 0.22%
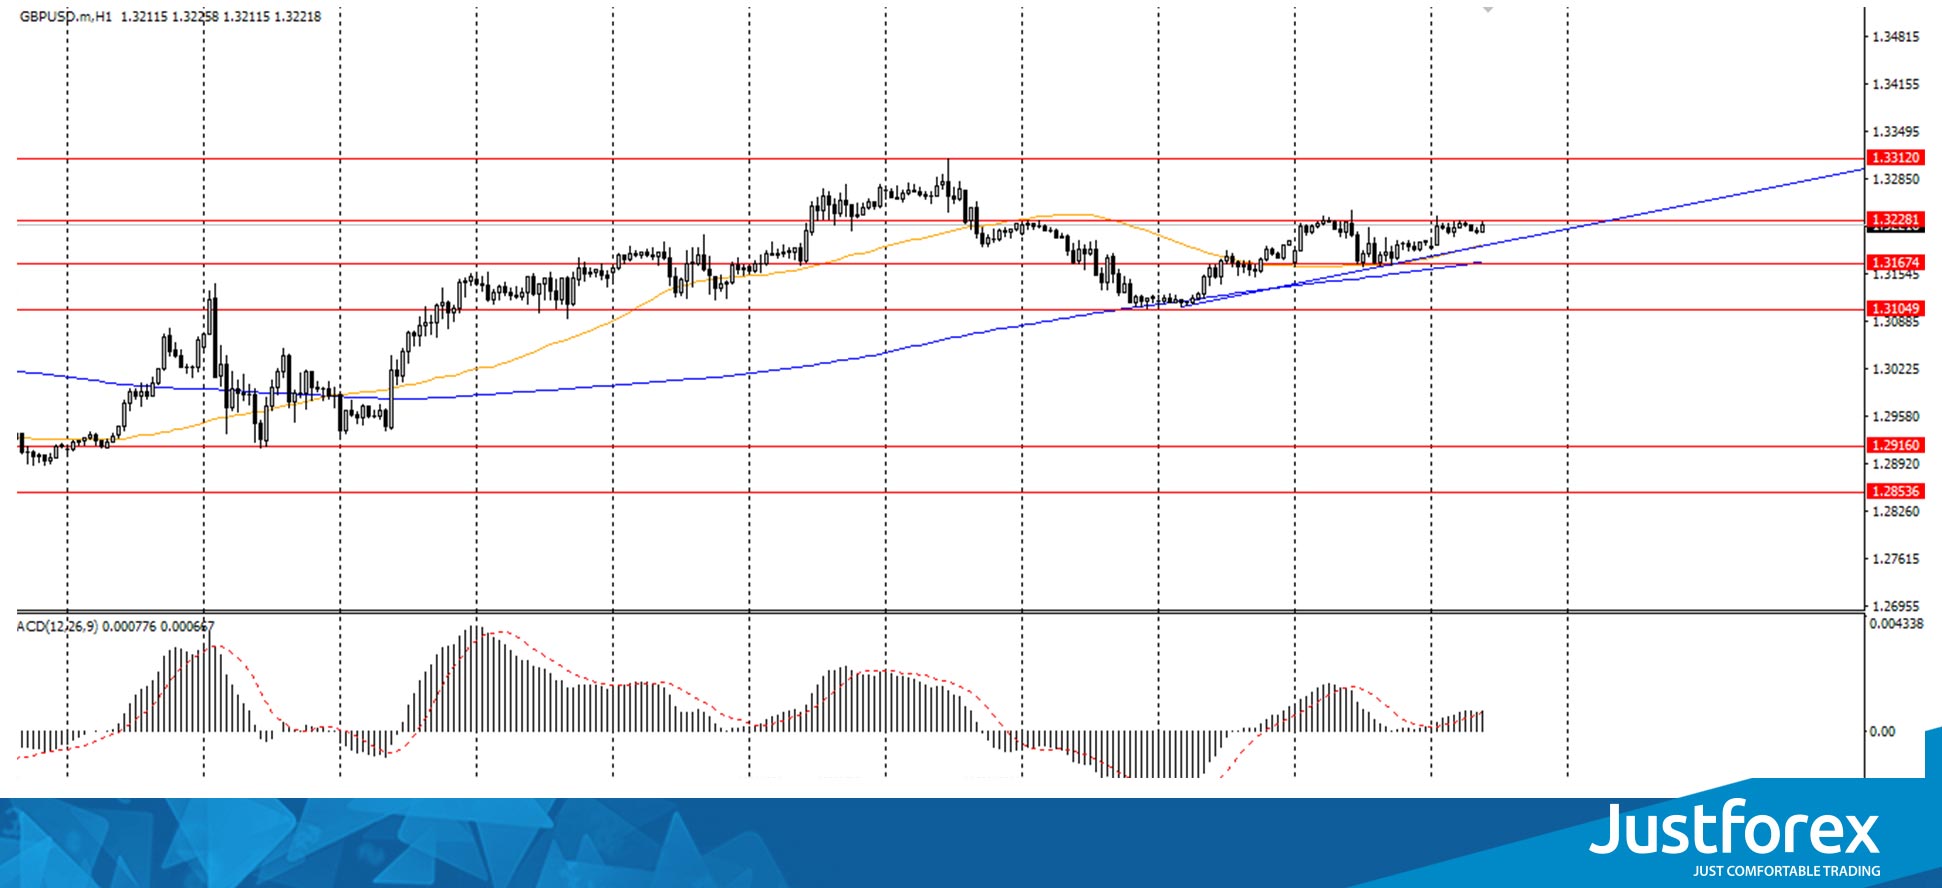
Yesterday, the GBP/USD currency pair was traded in the range of 1.3160-1.3230 and closed the day with a result of +0.22%. On the hourly chart, GBP/USD is being traded above the moving average MA (200) H1. The situation is similar on the four-hour chart. The MACD indicator is in the positive zone. Based on the above, it is probably worth sticking to bull trading and while the currency pair remains above MA 200 H1, it is necessary to look for buy entry points.
Trading recommendations
Support levels: 1.3167, 1.3104
Resistance levels: 1.3228, 1.3312
The main scenario: if the price fixes above the level of 1.3228, GBP/USD quotes may move to $1.3312 (November 11 high).
Alternative scenario: if the price fixes below the moving average MA 200 on H1, GBP/USD may fall to $1.3104.
News feed for 2020.11.17:
- US retail sales at 15.30 (GMT+2);
- Speech by the Bank of England Governor Bailey at 16:00 (GMT+2).
The USD/JPY currency pair
Technical indicators of the currency pair:
Prev Open: 104.714
Prev Close: 104.559
% chg. over the last day: -0.14%
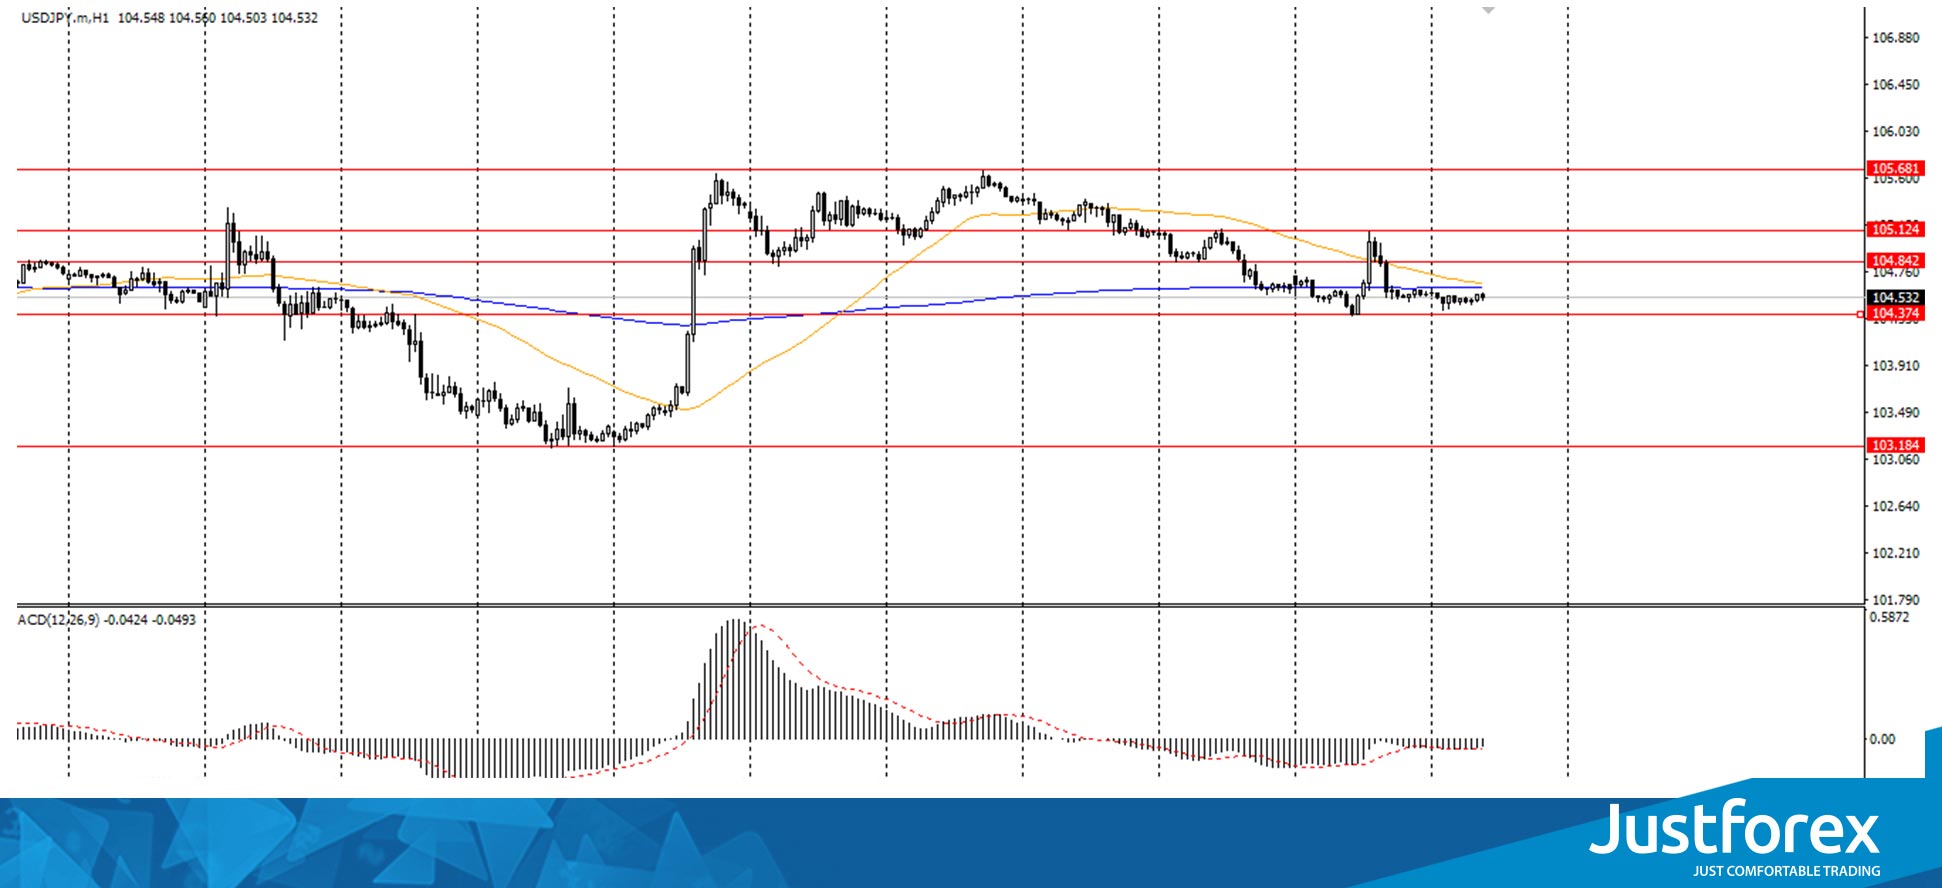
Yesterday, the USD/JPY currency pair showed a good momentum of growth within the day, after which this growth was won back, and the pair closed the day with a result of -0.14%. Today, the pair is being traded in a narrow price range of 104.40-104.50. On the hourly chart, USD/JPY is trading below the MA line (200) on the H1 timeframe. On the four-hour chart, the pair remains below the moving average MA (200) H4. We believe that currently, there is a correction to yesterday’s strong growth, so we recommend considering purchases. However, we recommend looking for entry points only after the price fixes above the MA 200 on H1.
Trading recommendations
Support levels: 104.37
Resistance levels: 104.84, 105.12, 105.68
The main scenario is the continuation of the upward movement, with the price-fixing above the MA 200 on H1 to the level of 105.12 (November 16 high).
An alternative scenario assumes consolidation below 104.37, followed by a decline to 103.20 (November 9 low).
News feed for 2020.11.17:
- US retail sales at 15.30 (GMT+2).
The USD/CAD currency pair
Technical indicators of the currency pair:
Prev Open: 1.3133
Prev Close: 1.3073
% chg. over the last day: -0.45%
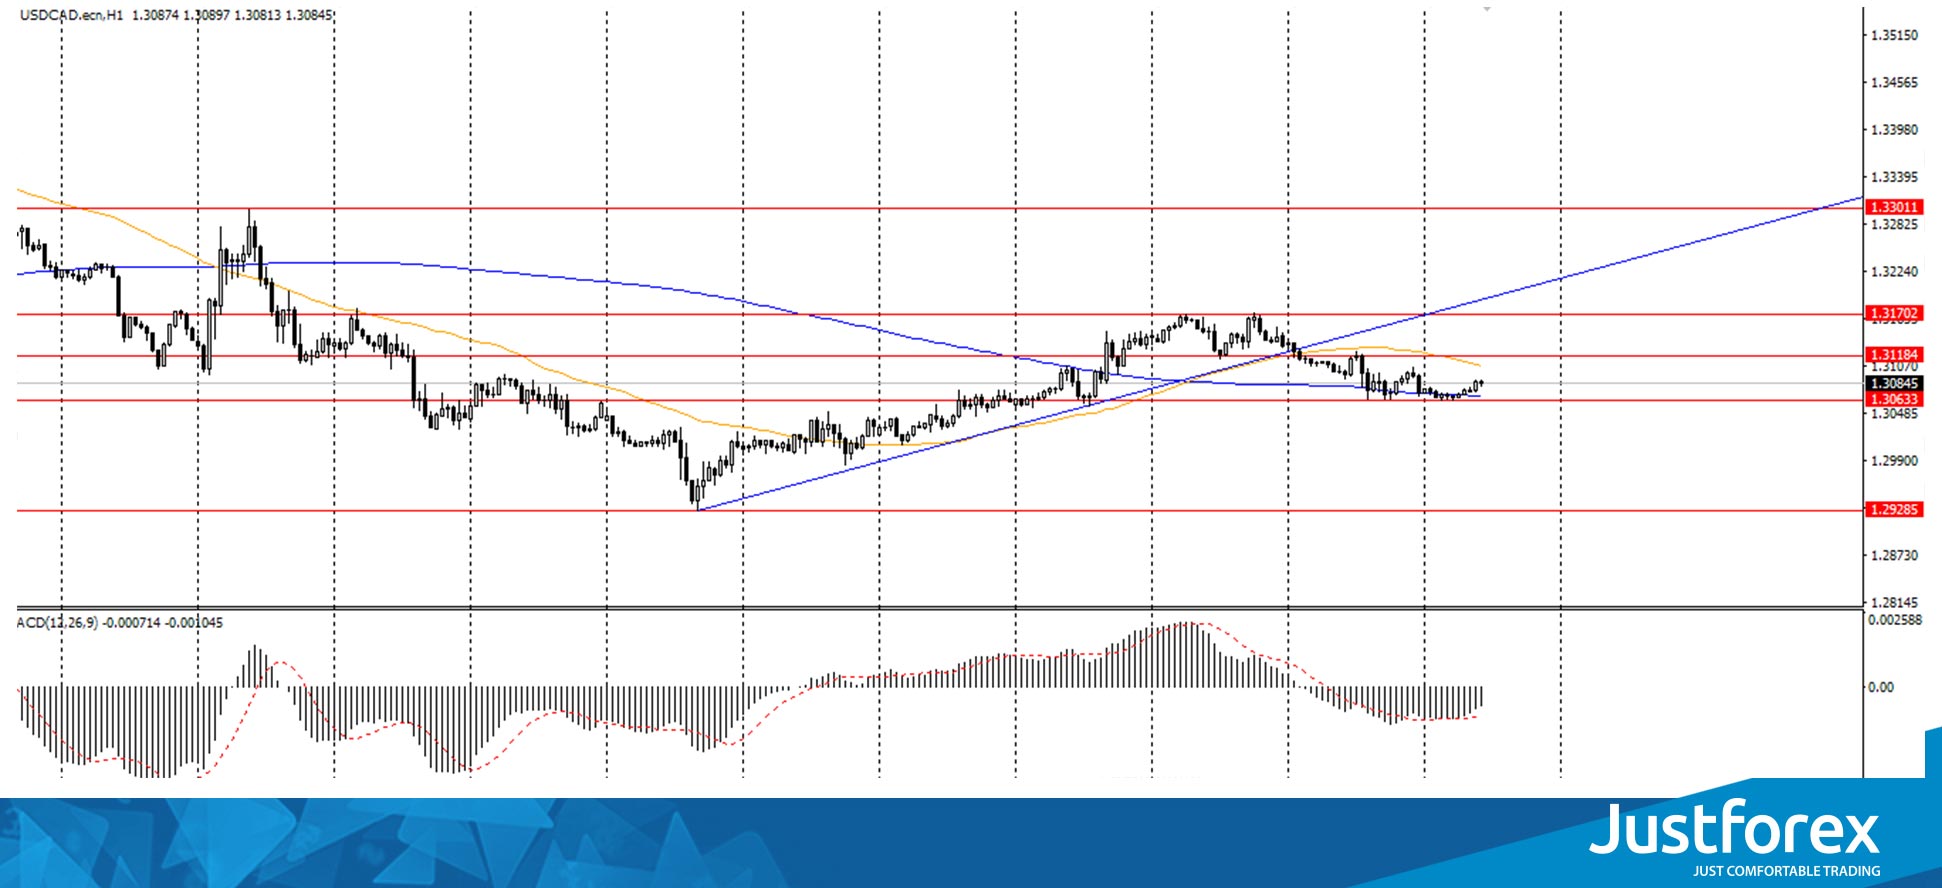
Yesterday, the USD/CAD currency pair was traded in the downtrend and closed at -0.45%. Today, the currency pair has grown slightly, rising to $1.3087. On the H1 timeframe, USD/CAD is above the MA 200 moving average. On the four-hour chart, the price has not yet tested the moving average. Based on the above, it is necessary to look for buy entry points on the correction, while the pair remains above MA 200 H1. It is worth watching how the pair will behave when testing the MA (200) moving average on H4.
Trading recommendations
Support levels: 1.3063, 1.2928
Resistance levels: 1.3118, 1.3170
The main scenario: if the price fixes above the level of 1.3118 on the H1 timeframe, we recommend looking for a buy entry point. The USD/CAD may reach the level of 1.3170.
Alternative scenario: if the price breaks through the level of 1.3063 and fixes below the MA (200), one may consider a sell position to the level of 1.2928.
News feed for 2020.11.17:
- US retail sales at 15.30 (GMT+2).


