Litecoin is rallying above the $70.00 level as the recent breakout move in the top altcoin starts to gather upside momentum. The technical analysis highlights that the LTCUSD pair could test towards the $90.00 level before a meaningful pullback takes place. In the near-term, the $80.00 level currently offers the strongest form of technical resistance for the LTCUSD pair.
The LTCUSD pair is only bullish while trading above the $68.00 level, key resistance is found at the $75.00 and the $80.00 levels.
If the LTCUSD pair trades below the $68.00, sellers may test the $63.00 and $60.00 support levels.
The EUR/JPY has reached a decisive support zone. The break or bounce moment will offer traders an interesting spot for trade setups.
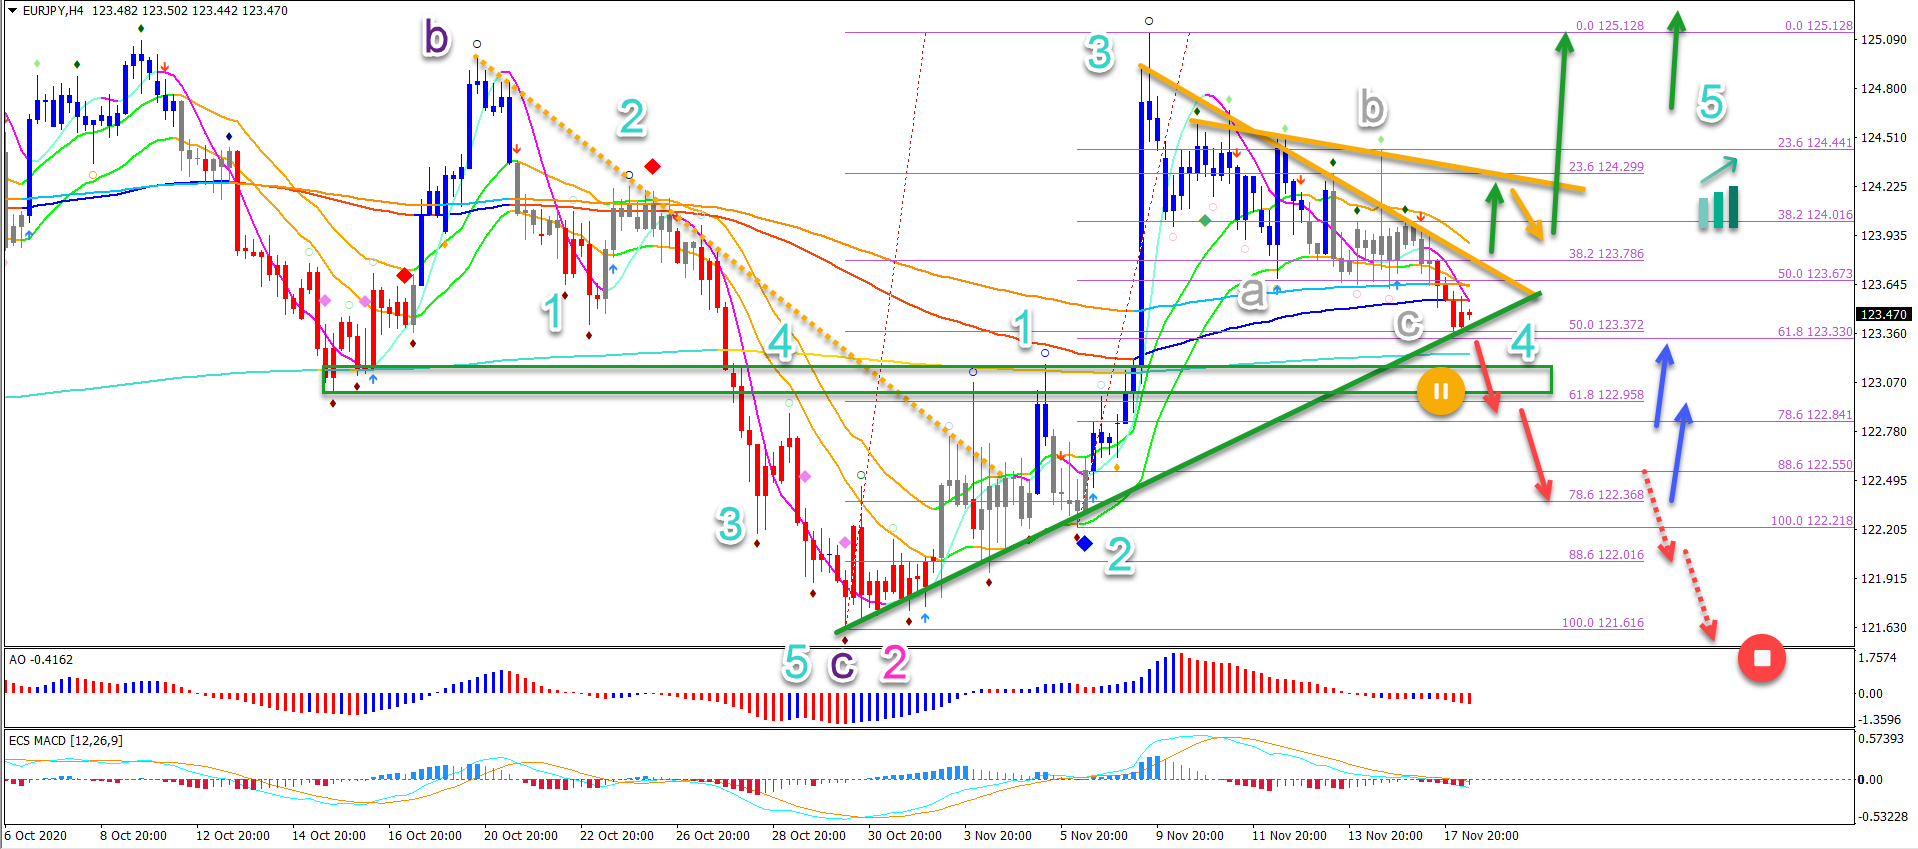
On the 4 hour chart, price action has reached the last support zone if the current pullback is a wave 4 (blue).
This article reviews the potential breakouts, wave patterns, and chart patterns.
Price Charts and Technical Analysis
The EUR/JPY is testing the resistance trend lines and 21 ema zone:
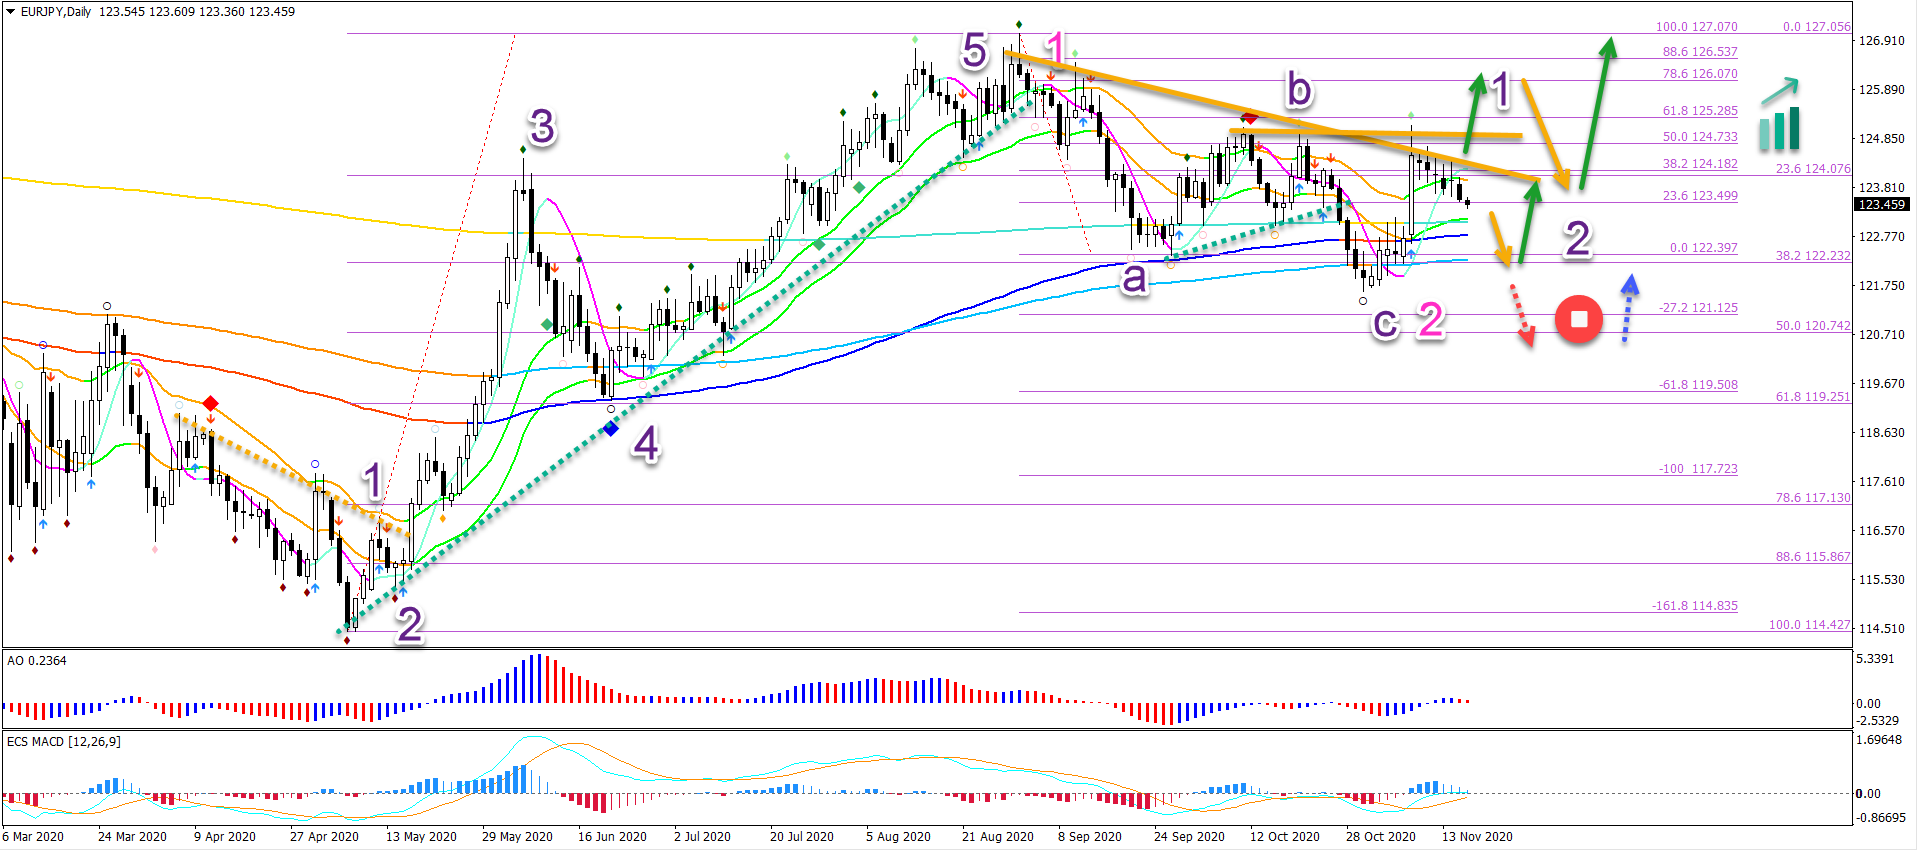
A bullish breakout confirms the uptrend in wave 1 or 3 (purple).
A deeper bearish pullback could indicate a wave 1-2 (purple).
A bullish break is expected to develop as follows:
It could see a break, pullback and continuation pattern.
A bullish daily candlestick should confirm the bullish break.
This is valid as long as the bullish candle appears in about the next 5 trading days (the HMA 20 should remain above the 21 ema high).
A bearish pullback could see two variations:
A test and bounce at the 144 ema for a wave 1-2 (purple).
A bearish breakout (red dotted arrow) which invalidates (red circle) this wave pattern but not the entire uptrend because the 50% and 61.8% Fib remain support.
On the 4 hour chart, price action has reached the last support zone if the current pullback is a wave 4 (blue). A deeper bearish breakout (yellow circle) indicates a wave 1-2 pattern instead. A full break below the bottom (red circle) invalidates the bullish outlook.
However, if price action manages to:
Break above the 21 ema zone.
And break above the resistance trend line.
Then the EUR/JPY would confirm the development wave 5 to the upside.