Gold (XAU/USD) is building a bull flag chart pattern (orange lines). Price action seems ready to break below the 21 ema zone.
The main target of XAU/USD with a bearish break below the 21 ema is the -61.8% Fibonacci. There is also a support zone and previous top.
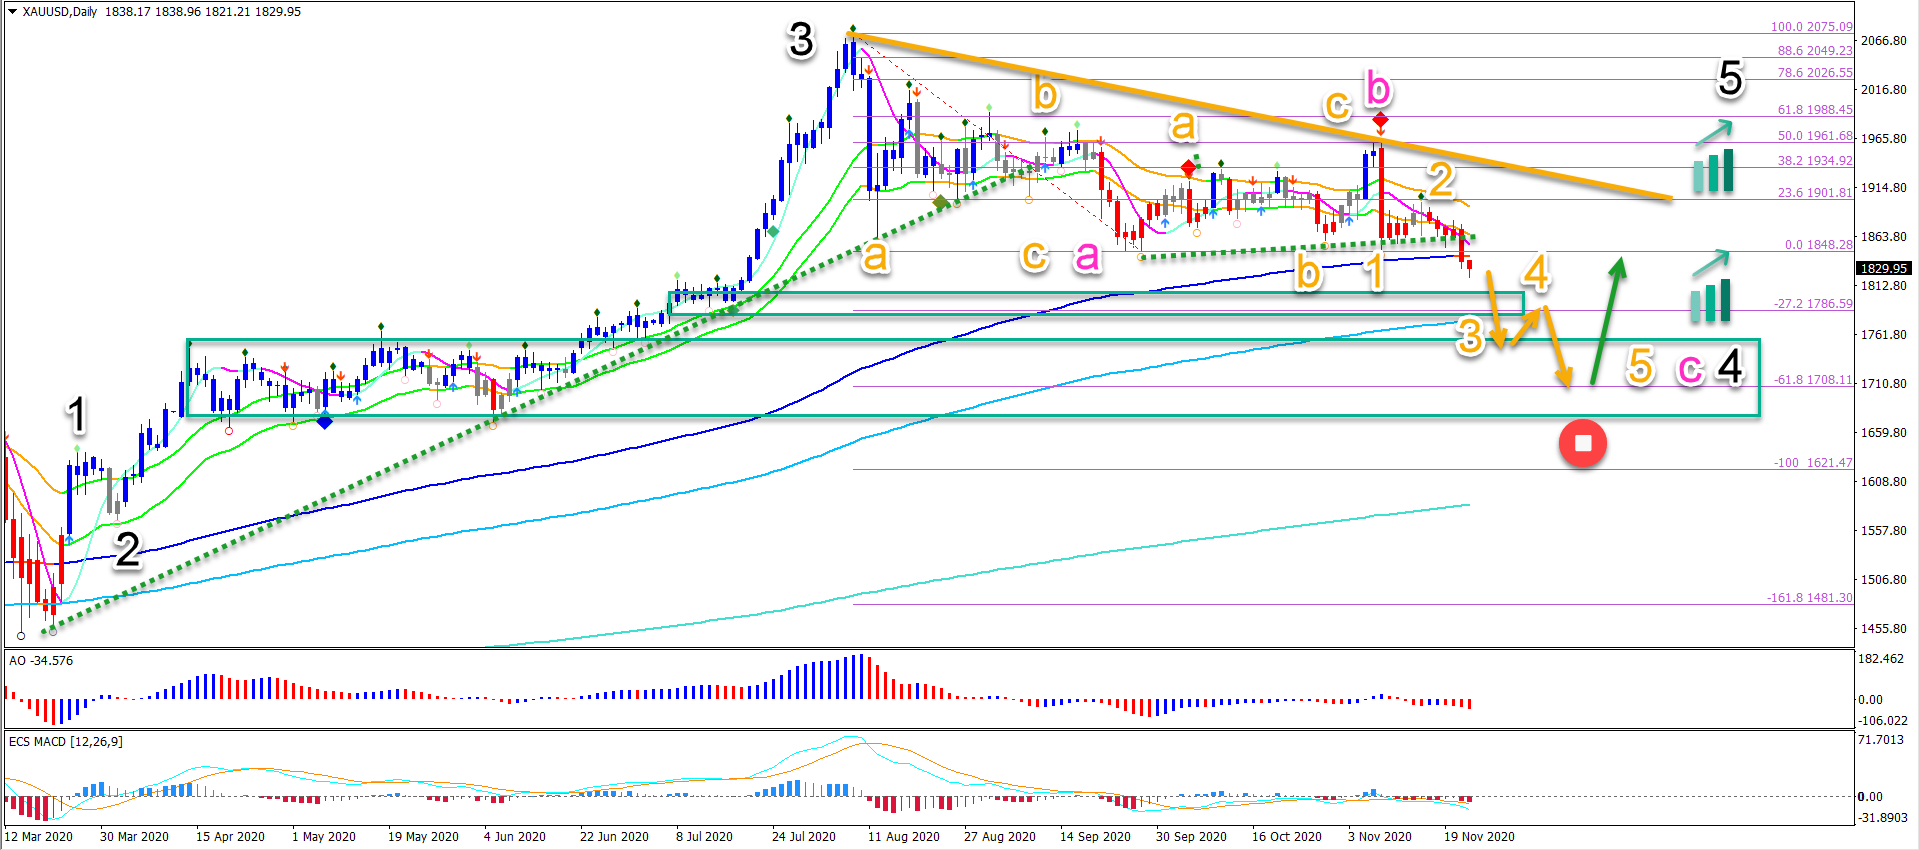
On the daily chart, price action seems to be developing an ABC pattern. A bearish swing via 5 waves could complete wave C and potential wave 4.
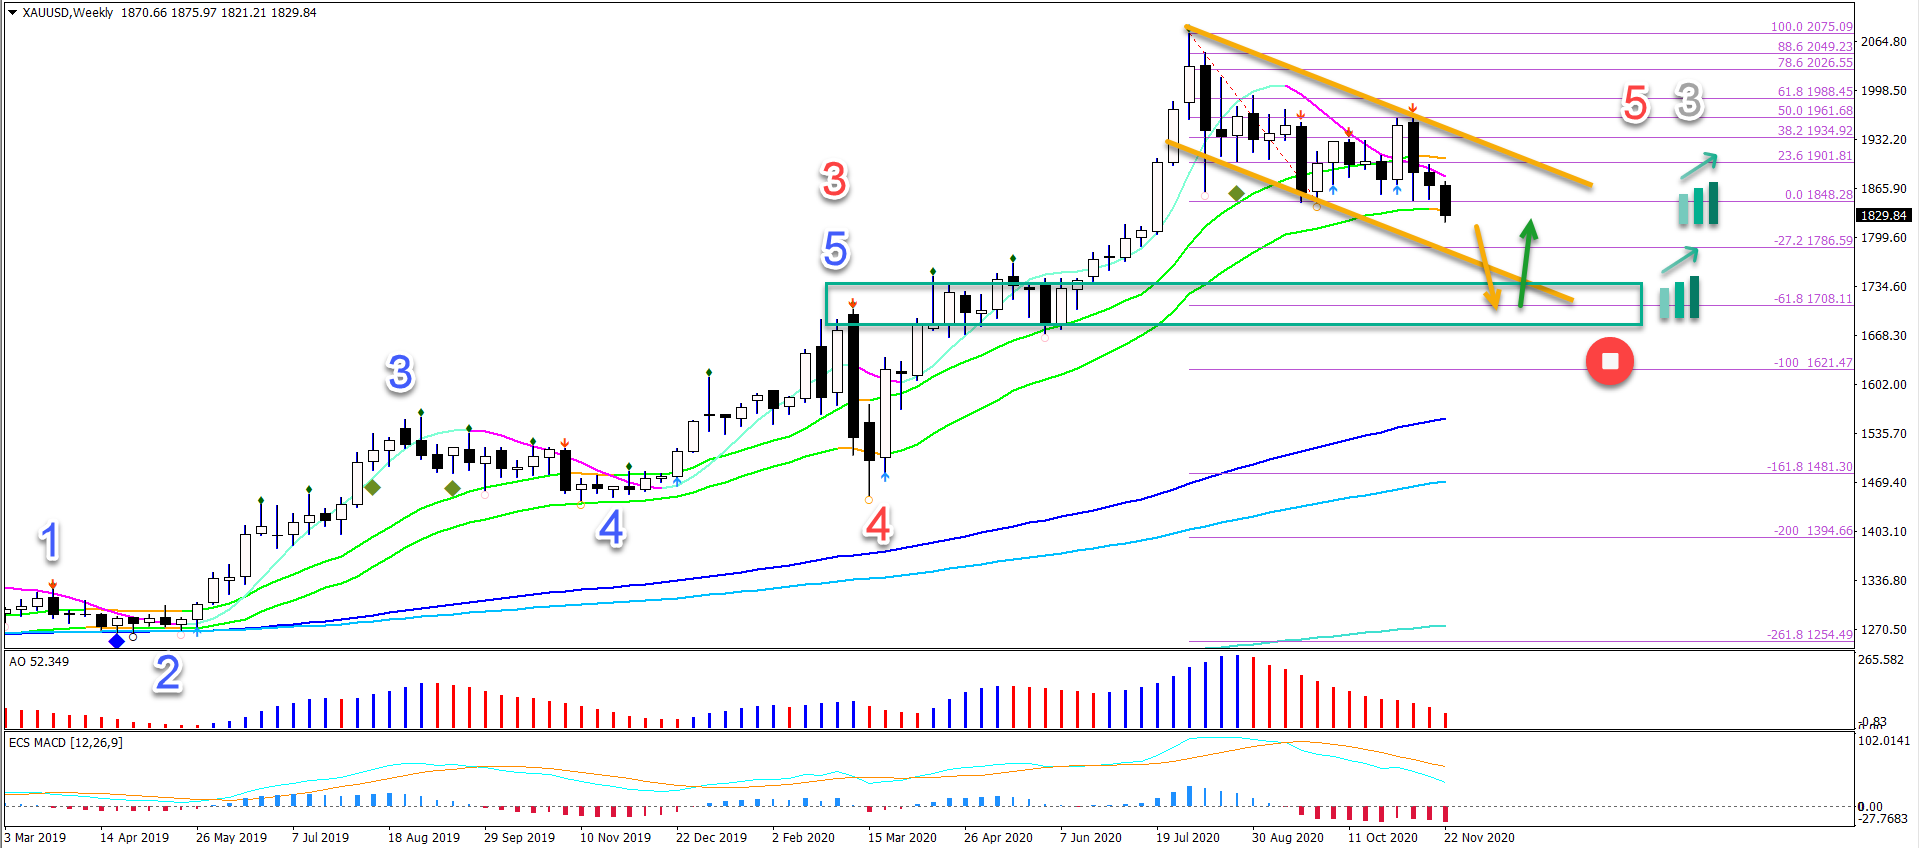
Gold (XAU/USD) is building a bull flag chart pattern (orange lines). Price action seems ready to break below the 21 ema zone. The main targets are the -27.2% and -61.8% Fibonacci targets.
Price Charts and Technical Analysis
The main target of XAU/USD with a bearish break below the 21 ema is the -61.8% Fibonacci. There is also a support zone and previous top (green box) which can stop price action from falling.
A break below the support zone, however, would invalidate the uptrend (red circle). In that case, a reversal is taking place that could take the price much deeper.
On the daily chart, price action seems to be developing an ABC (pink) pattern. A bearish swing via 5 waves (orange) could complete wave C (pink) and potential wave 4 (black).