
Key takeaways
- USD/JPY has confirmed a major technical breakout. The decisive move above the long-standing 161.95 resistance suggests that bullish momentum remains firmly in place, with the pair entering a fresh medium-term impulsive advance despite increasingly forceful verbal intervention from Japanese officials.
- Interest-rate differentials remain the dominant driver. The widening 2-year US Treasury-JGB yield spread continues to underpin dollar strength against the yen, as markets anticipate further policy tightening from the Federal Reserve while the Bank of Japan remains relatively accommodative despite its latest rate hike.
- Japan’s domestic policies are reinforcing yen weakness. A large-scale fiscal stimulus programme, combined with persistent foreign inflows into Japanese equities and associated currency hedging activity, is adding structural selling pressure to the yen.
- Verbal intervention alone appears insufficient. Unless Japanese authorities escalate to direct foreign exchange intervention or the US-Japan yield spread narrows materially, the path of least resistance for USD/JPY remains to the upside.
This is a follow-up analysis on the prior report, “Chart alert: USD/JPY advances toward the next 161.60/95 key intervention levels”, published on 10 June 2026
The price action of USD/JPY has advanced northwards as expected and cleared the key resistance level of 161.95, following the FX intervention in July 2022.
In today’s Asian session (Tuesday, 30 June 2026), the Japanese yen weakened to a 40-year low, printing 162.41 per US dollar despite verbal interventions from Japan’s Finance Minister Katayama and Chief Cabinet Secretary Kihara.
Why are verbal warnings being ignored?
The widening yield gap: While the Bank of Japan (BoJ) lifted its benchmark interest rate to “around 1%” in mid-June (its highest level since 1995), it remains severely behind the curve compared to Western developed central banks. With US rates at 3.50%–3.75% and the Fed expected to raise rates toward 4.00% under Chair Kevin Warsh, the nominal yield differential keeps JPY highly attractive as a funding currency for global carry trades
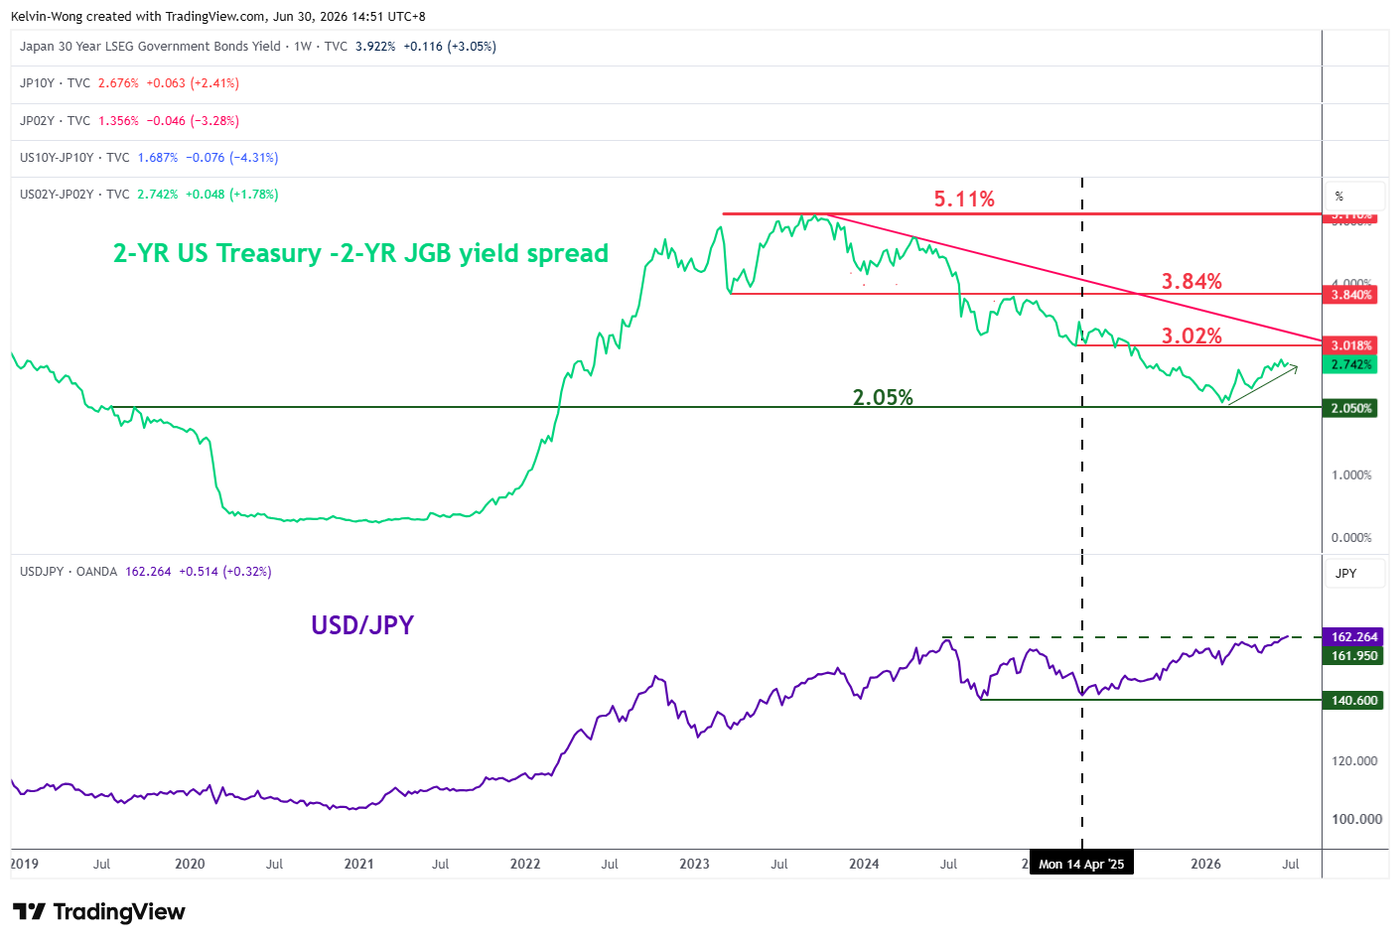
Given these circumstances, the 2-year yield spread between US Treasury notes and Japanese Government Bonds (JGBs) has continued to widen, now just above a major support level of 2.05%, and the yield premium has steadily increased to 2.74%, putting upside pressure on USD/JPY (see Fig. 1).
Takaichi’s aggressive fiscal package: Prime Minister Sanae Takaichi’s late-June unveiling of a massive $2.3 trillion public-private investment program over 14 years has reignited fears of structural fiscal expansion. This unchecked stimulus risks overheating the economy, causing long-term Japanese government bond (JGB) yields to rise in tandem with a weakening currency.
Nikkei 72,000 hedging blowback: The record-breaking rally in the Nikkei 225 past the 72,000 psychological level (printing an intraday all-time high of 72,832 on 22 June 2026) has been heavily fuelled by foreign capital pouring into Japanese AI and semiconductor equities. However, these inflows have been accompanied by aggressive currency hedging by foreign institutions, leading to immediate, heavy selling pressure on the spot JPY.
Fig. 1: 2-YR US Treasuries/JGBs yield spread with USD/JPY as of 30 Jun 2026 (Source: TradingView). The information presented is historical information, and past performance is not indicative of future performance.
Let’s now focus on the short-term trajectory (1 to 3 days) of the USD/JPY from a technical analysis perspective.
Continues to oscillate within a minor ascending channel
Fig. 2: USD/JPY minor trend as of 30 Jun 2026 (Source: TradingView). The information presented is historical information, and past performance is not indicative of future performance.
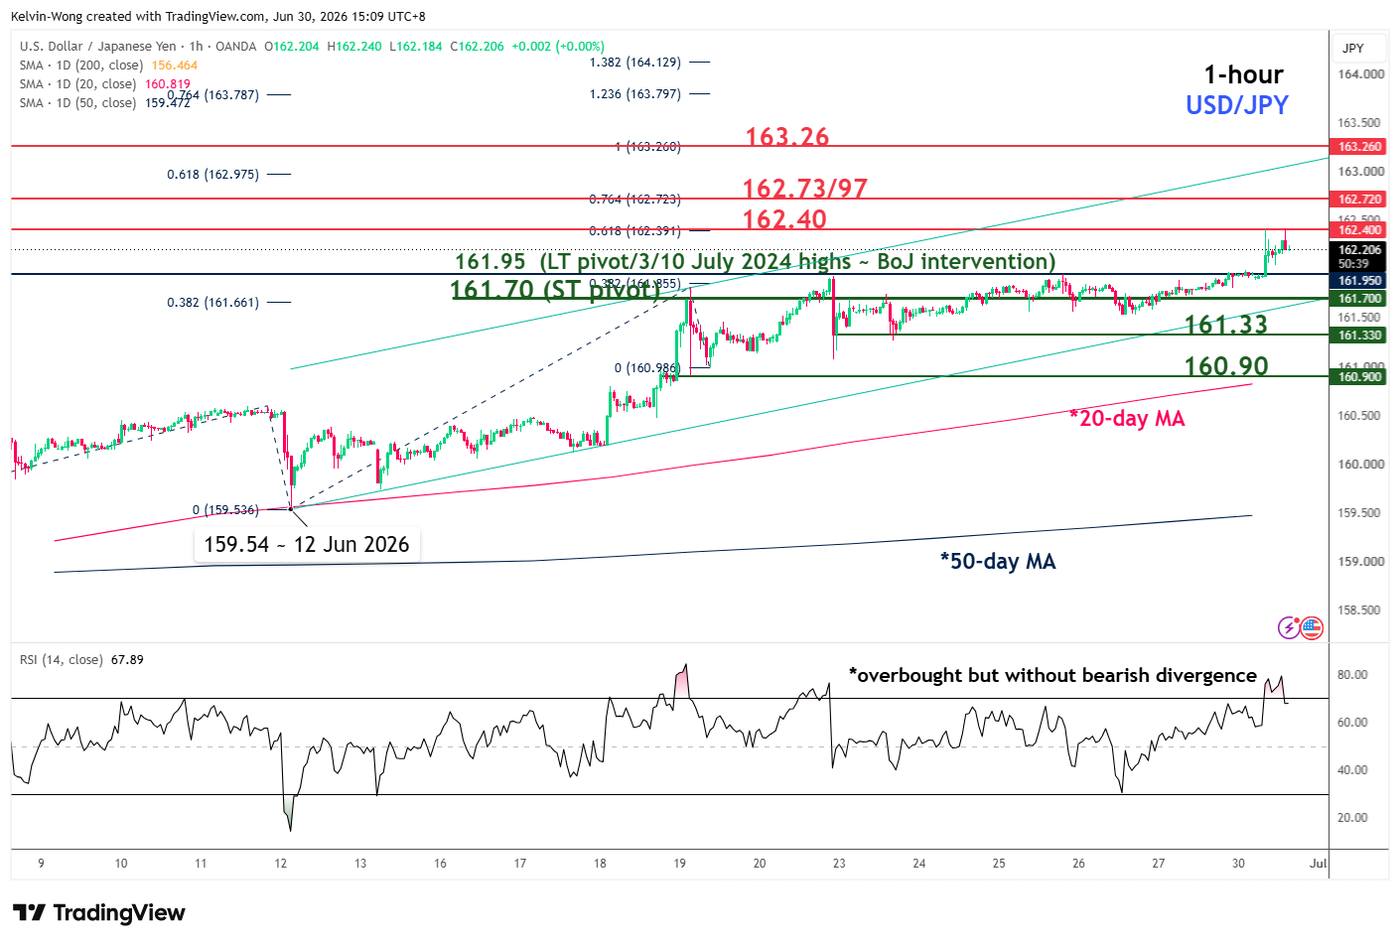
Trend bias: Minor uptrend remains intact with key short-term pivotal support at 161.70.
Resistances: 162.40 (Fibonacci extension), 162.73/97 (Fibonacci extension), 163.26 (Fibonacci extension & upper boundary of minor ascending channel) (see Fig. 2).
Next supports: 161.33 (22/23 Jun 2026 low), 160.90 (19 Jun 2026 low & 20-day MA)
Key elements to support the short-term bullish bias on USD/JPY
- Price action in USD/JPY continues to trade above the rising 20- and 50-day moving averages, suggesting that the minor and medium-term uptrend phases remain intact.
- The bullish breakout above a major range resistance at 161.95 increases the odds of a continuation of the medium-term (multi-week) bullish impulsive up-move sequence in USD/JPY.


