
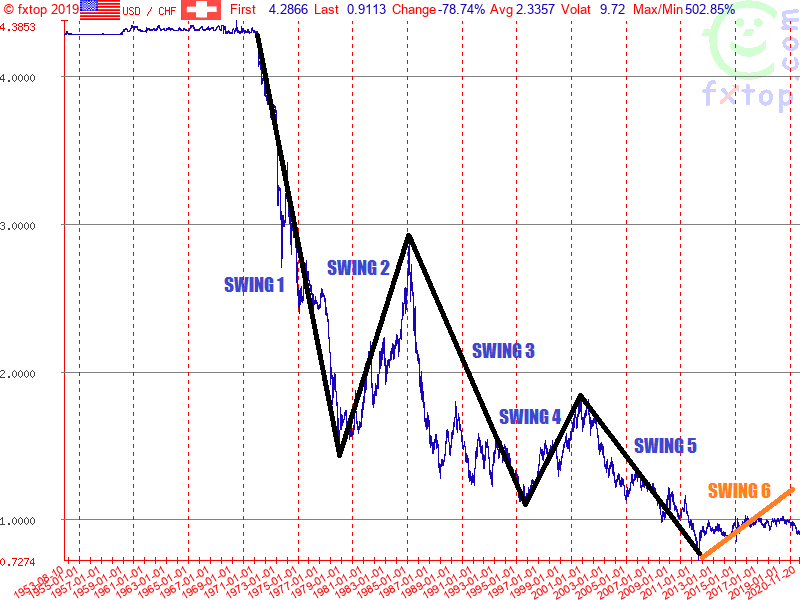
The Swiss franc is a currency that is always in the hurricane of the Forex because on several occasions the Swiss National Bank has intervened to prevent a continued appreciation of the currency against the dollar. The last time we saw a clear consequence for USDCHF intervention was in early 2015 when the pair lost 31 cents in a few minutes. However, these interventions in the USDCHF have not been able to stop the natural cause of the pair, the bearish trend.
As we see in the historical chart, the franc has been appreciating against the dollar for 50 years and it is not unreasonable to infer that it will continue with the same trend. If we look at the structure of the pair, we can count 5 swings down from the year 1970, so we would need at least 2 more swings to complete a great cycle that could last more than 60 years in total. We are currently in swing number 6 which it is very likely that has not finished yet, this is because a correction of this type should look at least a 38.2% Fibonacci correction of the last swings, that means swing 6, which in this case has not yet finished.
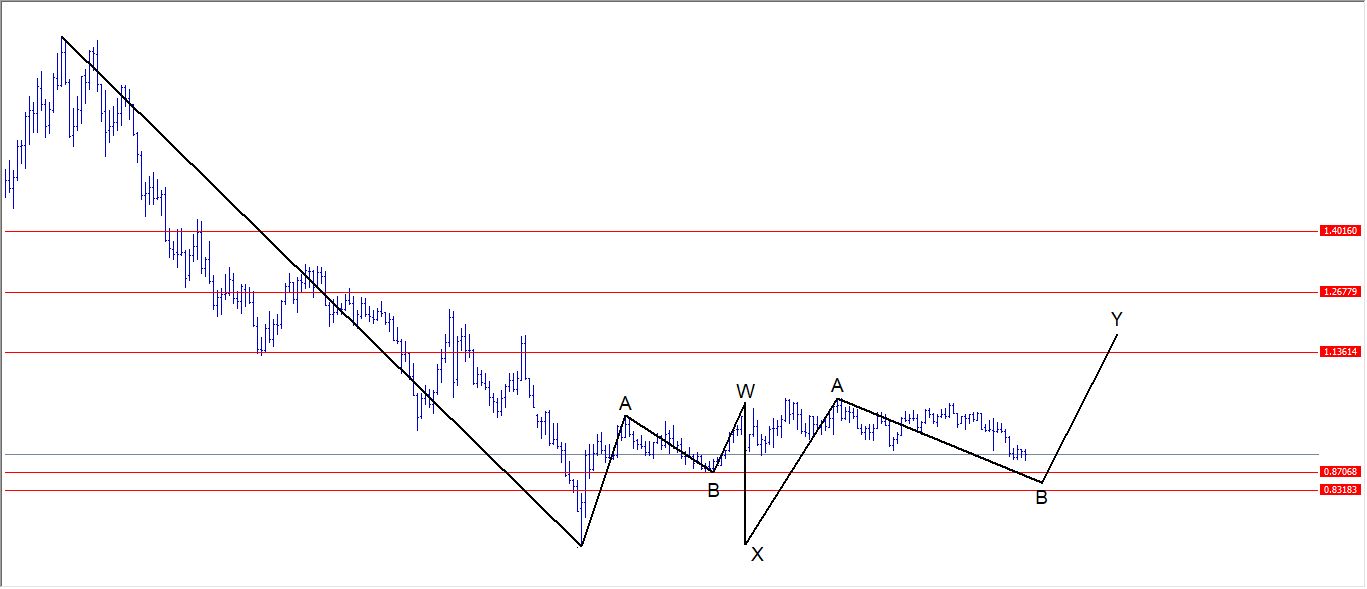
Elliott Wave Structure No. 1 on USD/CHF
In the monthly chart of USDCHF that we see below, we have a probable developing structure of Elliott waves to complete swing 6 that we discussed earlier. The structure we see is a double correction WXY. For more information on Elliott structure visit this link: Elliott Waves Theory. The first part is an ABC correction that we call W that ended at the beginning of 2015. Then we have a correction of all that movement, which we call X, precisely the result of the intervention of the Swiss Bank. Then we started a new corrective structure in 3 ABC waves which we will call Y . We are currently in B which should typically be looking for the 0.83 – 0.87 area and then bounce back and end swing number 6 with a rally close to the 1.13 level.
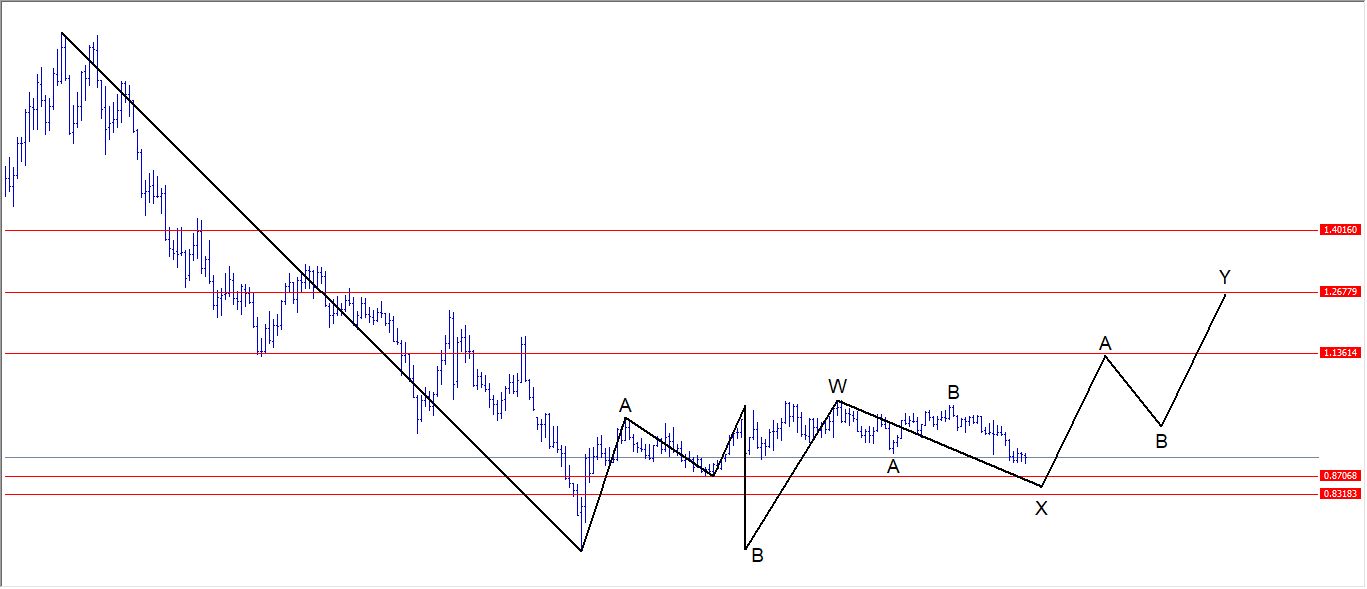
Elliott Wave Structure No. 2 on USD/CHF
In the second monthly chart of the USDCHF, we see the same WXY structure where the depth of the correction varies. This Elliott structure could take USDCHF to levels close to 1.26. The difference here is that the W wave is longer in time. Where wave A is a Leading Diagonal, wave B is an irregular flat correction and wave C is a Ending Diagonal to complete W at the end of 2016. This means that we are recently running the connector X which should reach, like the previous case, to the 0.83 – 0.87 zone and give a rebound. Here the rally would be made up of 3 more waves to complete Y and not just one wave. And this structure could reach levels as high as 1.26.
Of course, this is in theory because hence the corrective structures of Elliott waves are diverse and we can have many variations before ending swing 6. The important thing is to have the long-term direction of the pair.


