
The EUR/USD currency pair
Technical indicators of the currency pair:
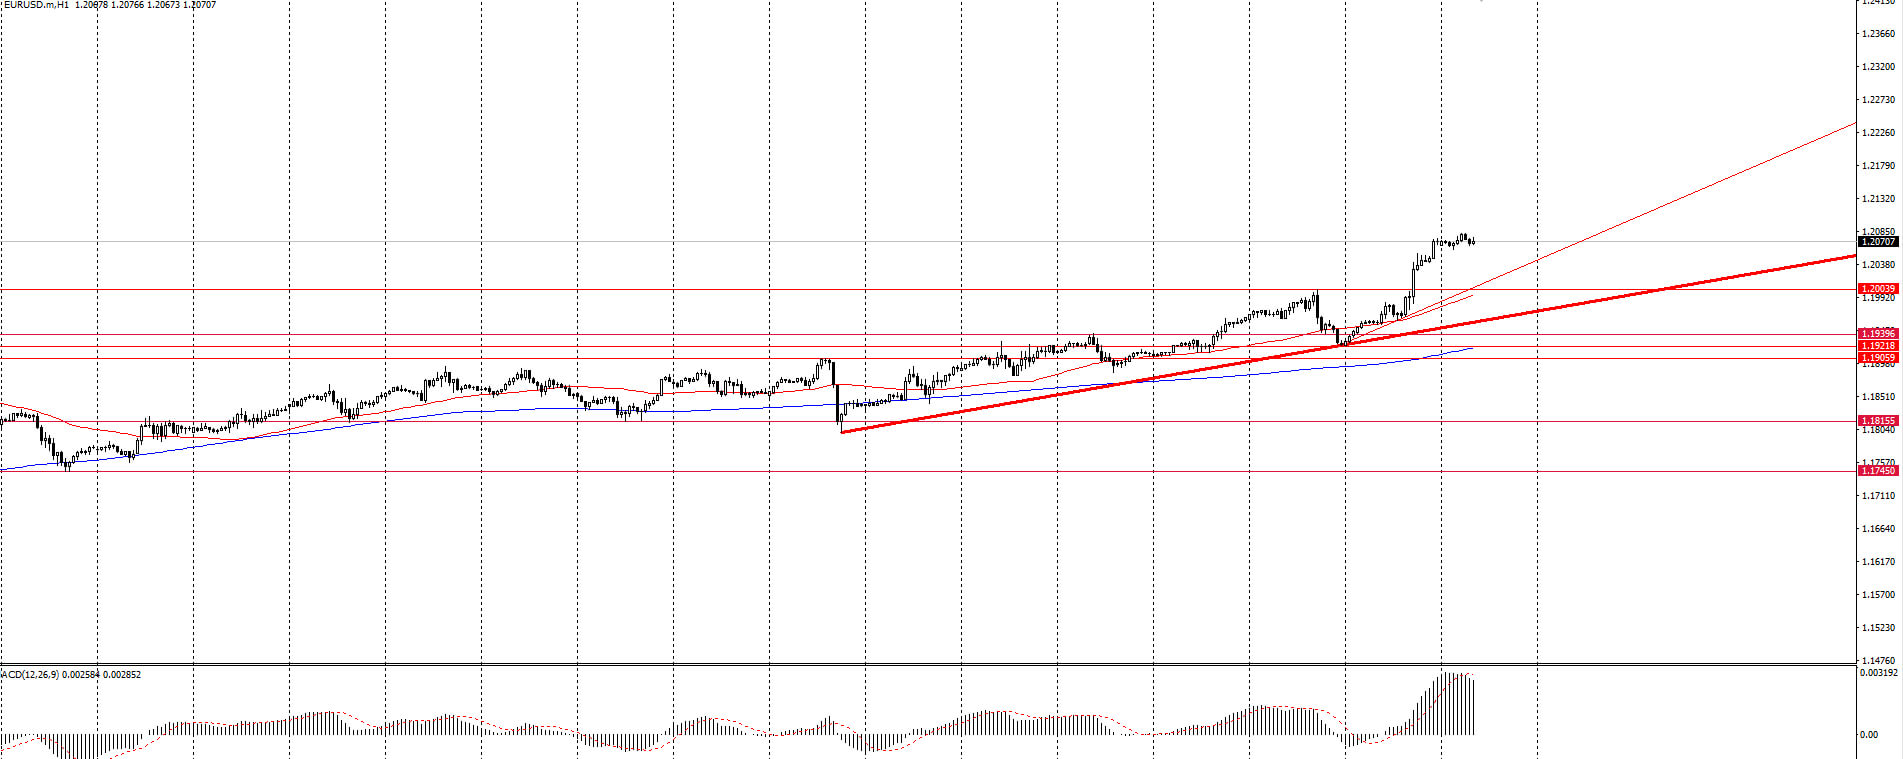
Prev Open: 1.1924
Prev Close: 1.2071
% chg. over the last day: +1.2%
Yesterday, the EUR/USD pair was traded in an uptrend and showed a dynamics of +1.2%. An uptrend is observed on the chart, which indicates the predominance of purchases on this asset. On the hourly timeframe, the price is being traded above the moving average MA 200. On the H4 timeframe, the situation is similar. The MACD indicator is currently in the positive zone on H1. Based on the above, it is worth considering only buy positions while the price is above MA 200 on H1.
Trading recommendations
Support levels: 1.2000, 1.1939, 1.1921, 1.1905, 1.1815
Resistance levels: 1.2100
The main scenario for trading EUR/USD is looking for buy entry points. Yesterday the price broke through the strong level of 1.2000 and fixed above it. It is best to look for buy entry points when the price rolls back to the trend line or to 1.2000. With the opening of long positions, quotes can go to the level of 1.2100.
Alternative scenario: if the price fixes below the level of 1.2000 on the H1 timeframe and below MA 200 on H1, the currency pair is likely to decline to 1.1939.
News feed for 2020.12.02:
- ADP United States Nonfarm Employment Change at 15:15;
- Speech by the Federal Reserve System Chairman Powell at 17:00;
- US crude oil stocks at 17:30.
The GBP/USD currency pair
Technical indicators of the currency pair:
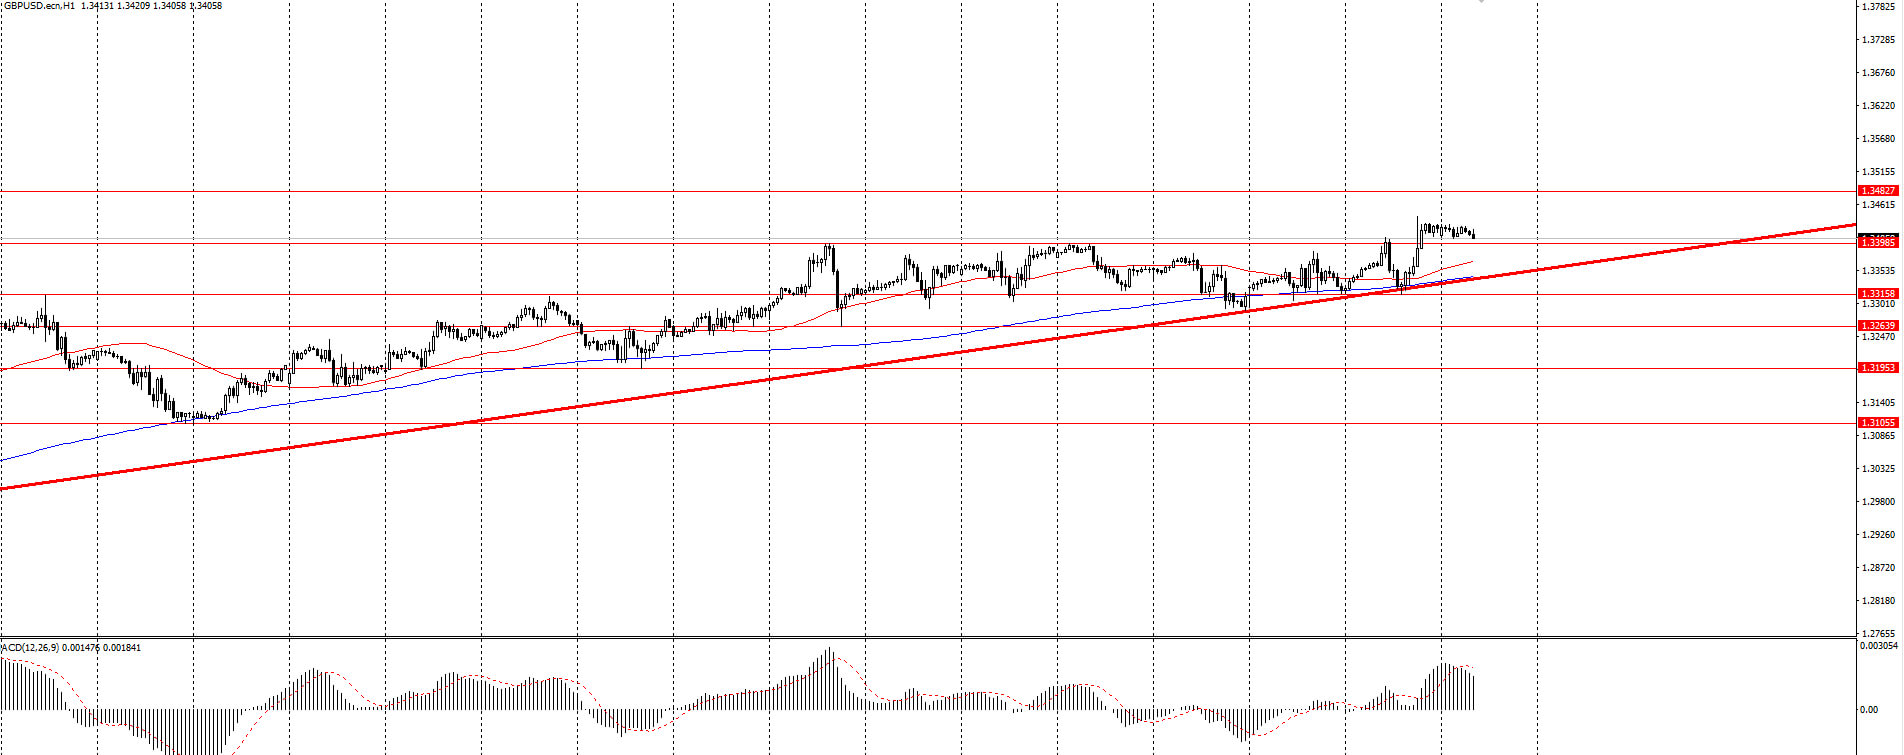
Prev Open: 1.3321
Prev Close: 1.3422
% chg. over the last day: +0,75%
Yesterday, the GBP/USD pair was traded in an uptrend and showed 0.75%. On the hourly chart, GBP/USD is being traded above the moving average MA (200) H1. The situation is similar on the four-hour chart. The MACD indicator is in the positive zone on H1. The uptrend maintains.Based on the above, it’s probably worth holding to bull trading and as long as the currency pair remains above MA 200 H1, it’s necessary to look for buy entry points.
Trading recommendations
Support levels: 1.3398, 1.3315, 1.3263, 1.3195, 1.3105
Resistance levels: 1.3482
The main scenario: look for buy entry points. Yesterday, the currency pair managed to break through the strong level of 1.3398 and fixed above it. When generating signals on lower timeframes, it is worth considering buying an asset. With the opening of long positions, quotes can go to the level of 1.3482. It is also worth noting that divergence is observed on the MACD on the H4 timeframe. This can signal the beginning of a pair correction.
Alternative scenario: if the price fixes below 1.3398, then the asset may fall to 1.3115.
News feed for 2020.12.02:
- ADP United States Nonfarm Employment Change at 15:15;
- Speech by the Federal Reserve System Chairman Powell at 17:00;
- US crude oil stocks at 17:30.
The USD/JPY currency pair
Technical indicators of the currency pair:
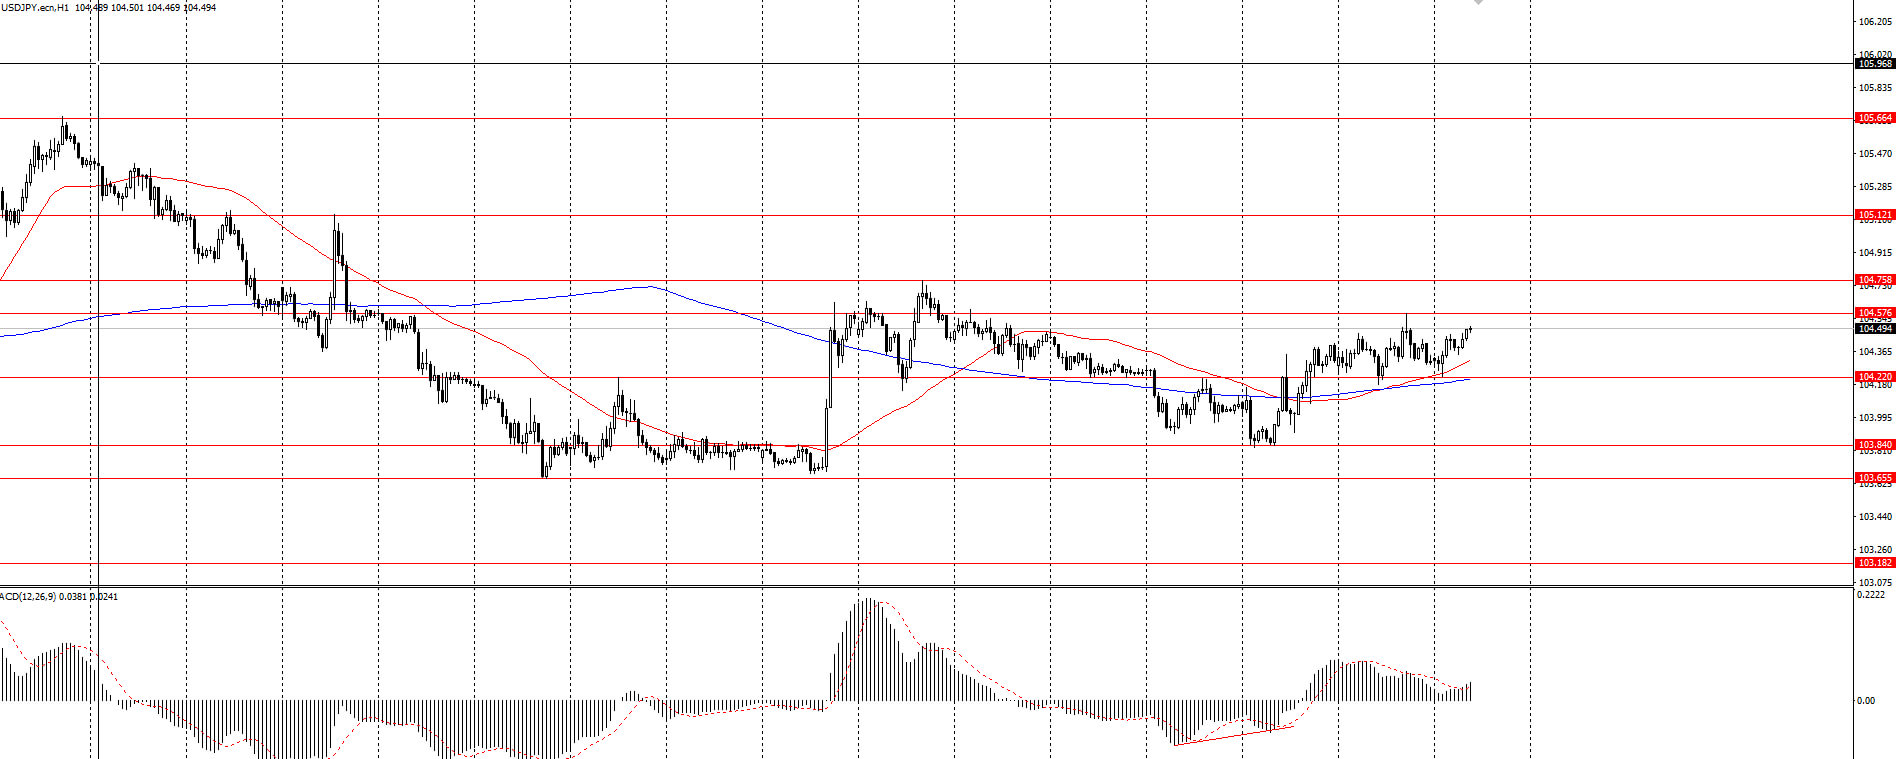
Prev Open: 104.28
Prev Close: 104.30
% chg. over the last day: 0%
Yesterday, the USD/JPY currency pair closed the day with a result of 0%. On the hourly chart, the currency pair fixed above the moving average MA 200. On the four-hour chart, the price is below MA 200. MACD indicator on H1 is in the positive zone. Based on the above, you can try to look for buy entry points on corrections on lower timeframes. It is worth keeping track of how the price will test MA 200 on the H4 timeframe.
Trading recommendations
Support levels: 104.22, 103.84, 103.65
Resistance levels: 104.57, 104.75, 105.12
The main scenario: consider buying an asset. It is best to look for entry points when the price breaks through and fixes above the level of 104.57. With the opening of long positions, quotes can go to the level of 104.75.
An alternative scenario assumes consolidation below the level of 104.22, followed by a fall to the level of 103.84.
News feed for 2020.12.02:
- ADP United States Nonfarm Employment Change at 15:15;
- Speech by the Federal Reserve System Chairman Powell at 17:00;
- US crude oil stocks at 17:30.
The USD/CAD currency pair
Technical indicators of the currency pair:
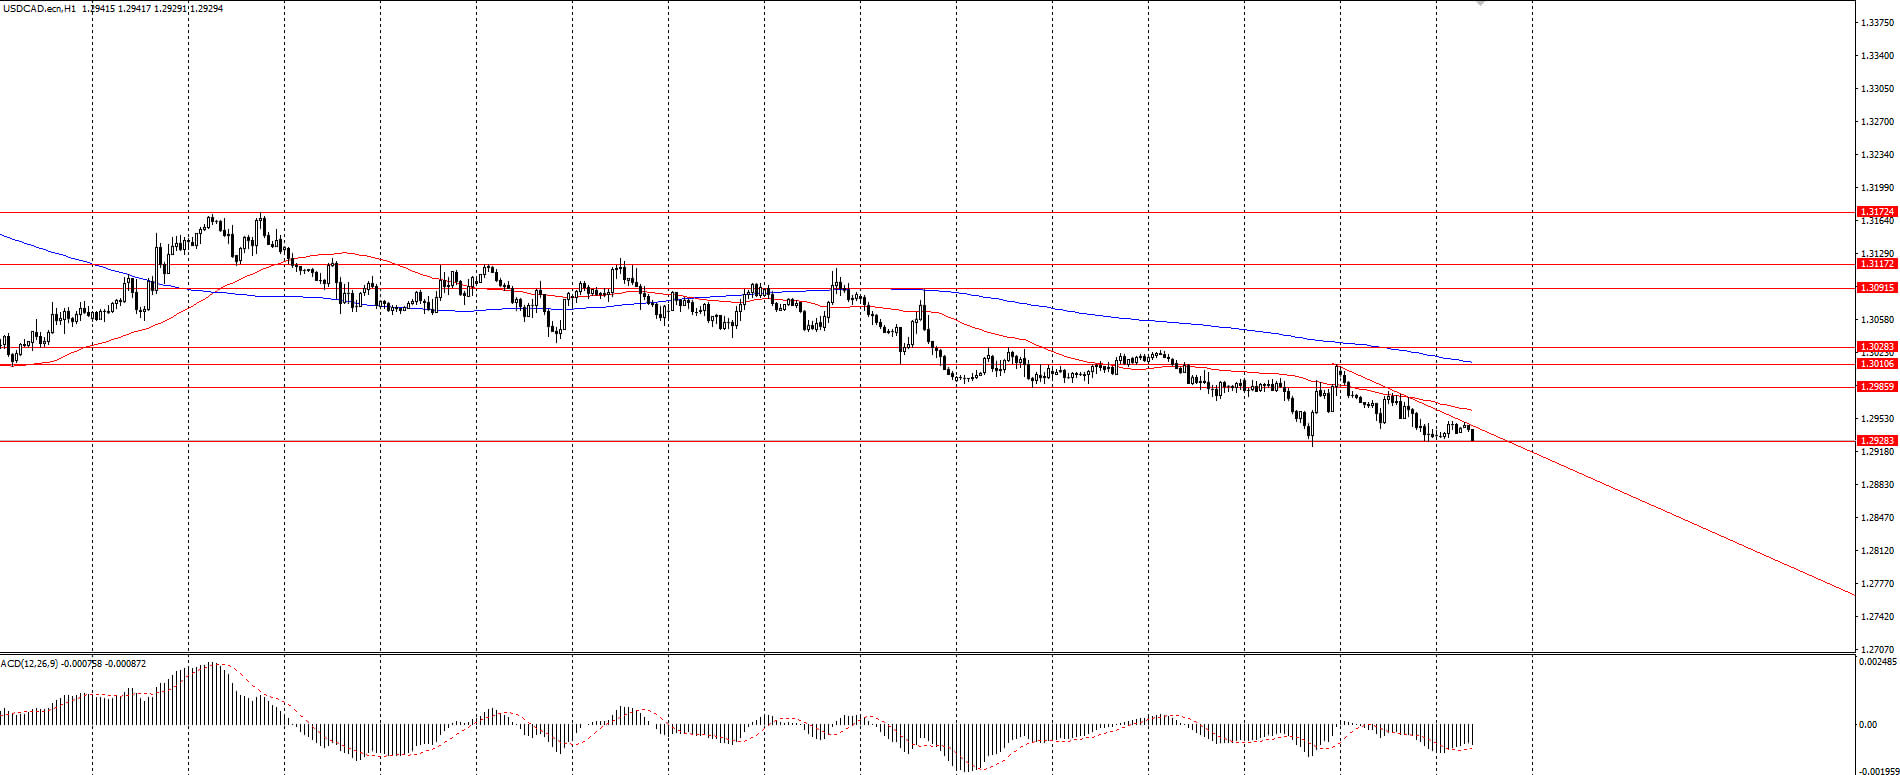
Prev Open: 1.3003
Prev Close: 1.2933
% chg. over the last day: -0,54%
Yesterday, the USD/CAD currency pair was traded in a downtrend and closed with the result of -0.54%. On the H1 timeframe, USD/CAD is below the moving average MA 200. On the four-hour chart, the price is below the moving average. Based on the above, it is worth considering selling an asset.
Trading recommendations
Support levels: 1.2928
Resistance levels: 1.2985, 1.3010,1.3028, 1.3091, 1.3117, 1.3172
The main scenario: we recommend considering the sale of an asset. If the price breaks through and fixes below the level of 1.2928, it is better to look for a sell entry point.
Alternative scenario: if the price can break through the level of 1.2985 and fix above the 200 moving average of the period on H1, we can consider a buy position to the level of 1.3028.
News feed for 2020.12.02:
- ADP United States Nonfarm Employment Change at 15:15;
- Speech by the Federal Reserve System Chairman Powell at 17:00;
- US crude oil stocks at 17:30.


