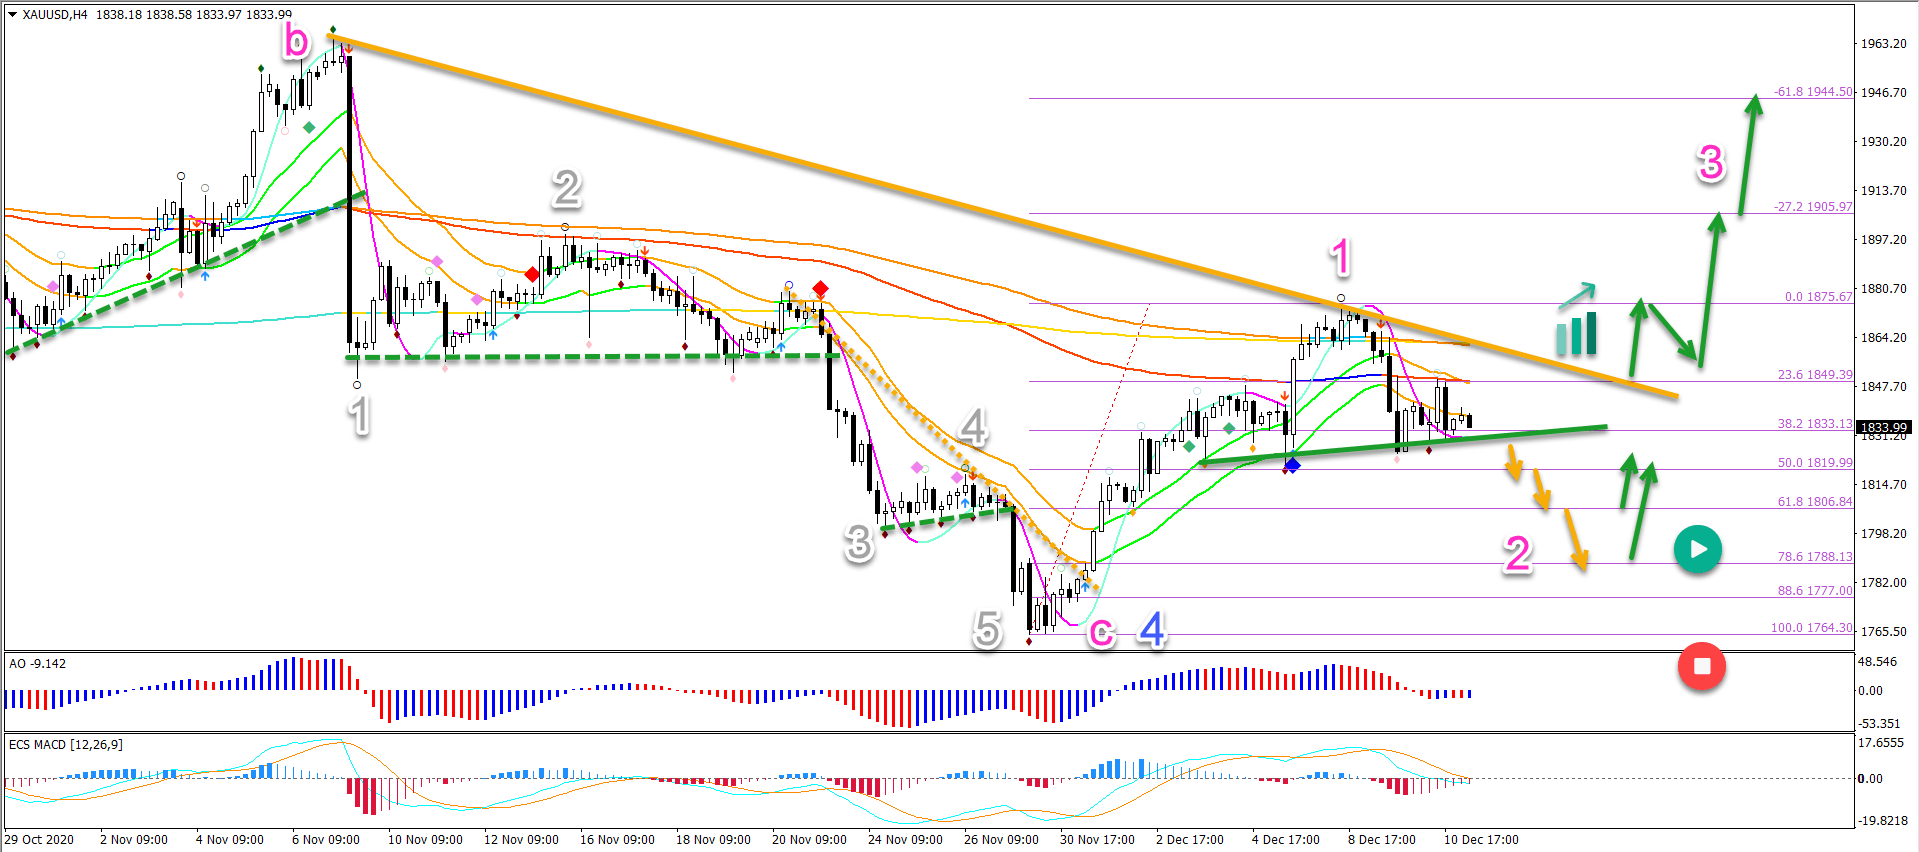
Gold (XAU/USD) could have completed a wave 4 (blue) pattern at the most recent low. But price action will need to stay above the bottom to confirm the end of the correction.
The bullish push is indicating a potential reversal. The impulsive price swing looks strong and suggests that the old uptrend has returned.
A bearish breakout could confirm the wave C (grey). But price action must stay above the bottom and 100% Fibonacci to preserve the uptrend.
Will the uptrend continue? Let’s review the chart patterns to answer this question.
Price Charts and Technical Analysis
However, before the uptrend is back, a bearish break below support (green) seems imminent. Especially because the moving averages are bearishly aligned.
If this is a wave 1 (pink), then the current retracement should be a wave 2 (pink).
This becomes invalid if price action breaks below the bottom (red circle).
A bullish bounce at the Fibonacci levels could confirm the end of the wave 2.
A break above the resistance trend line (orange) confirms the uptrend and wave 3.
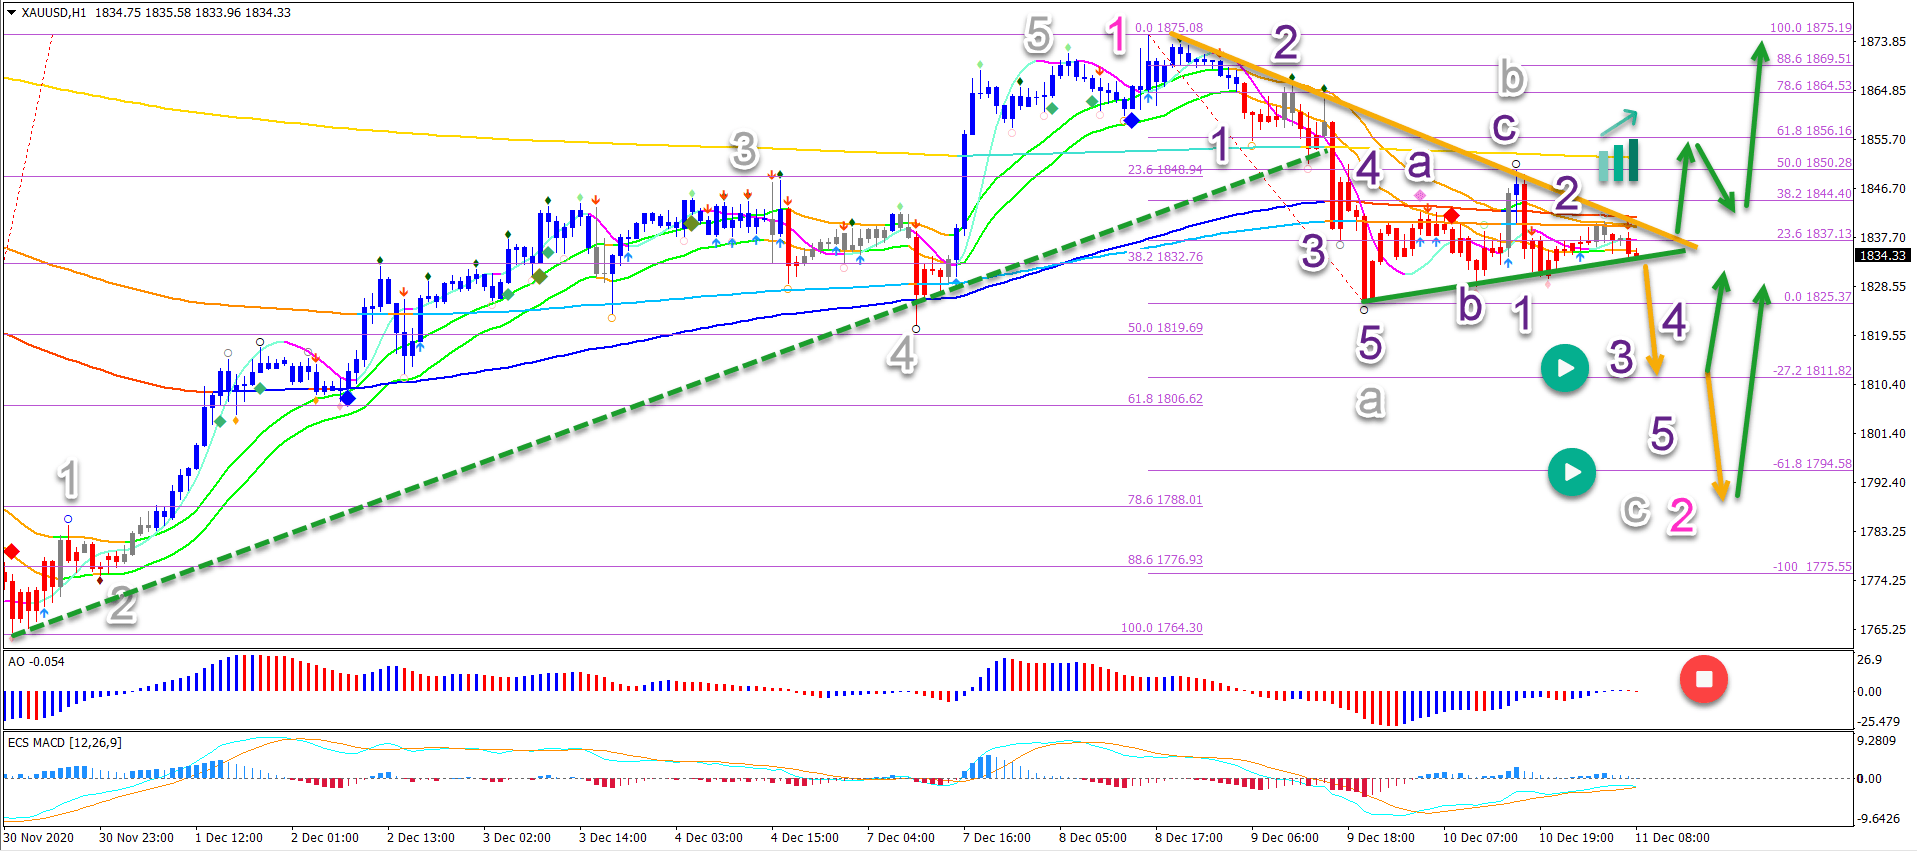
On the 1 hour chart, price action seems to be building an ABC (grey) zigzag pattern:
Within the wave A (grey), there were 5 waves (purple) completed.
Also, the wave B (grey) respected the 50% Fibonacci.