McDonalds (MCD) stocks has made a bullish reverse at the 50% Fibonacci retracement level. Does this indicate the end of the retracement and restart of the uptrend?
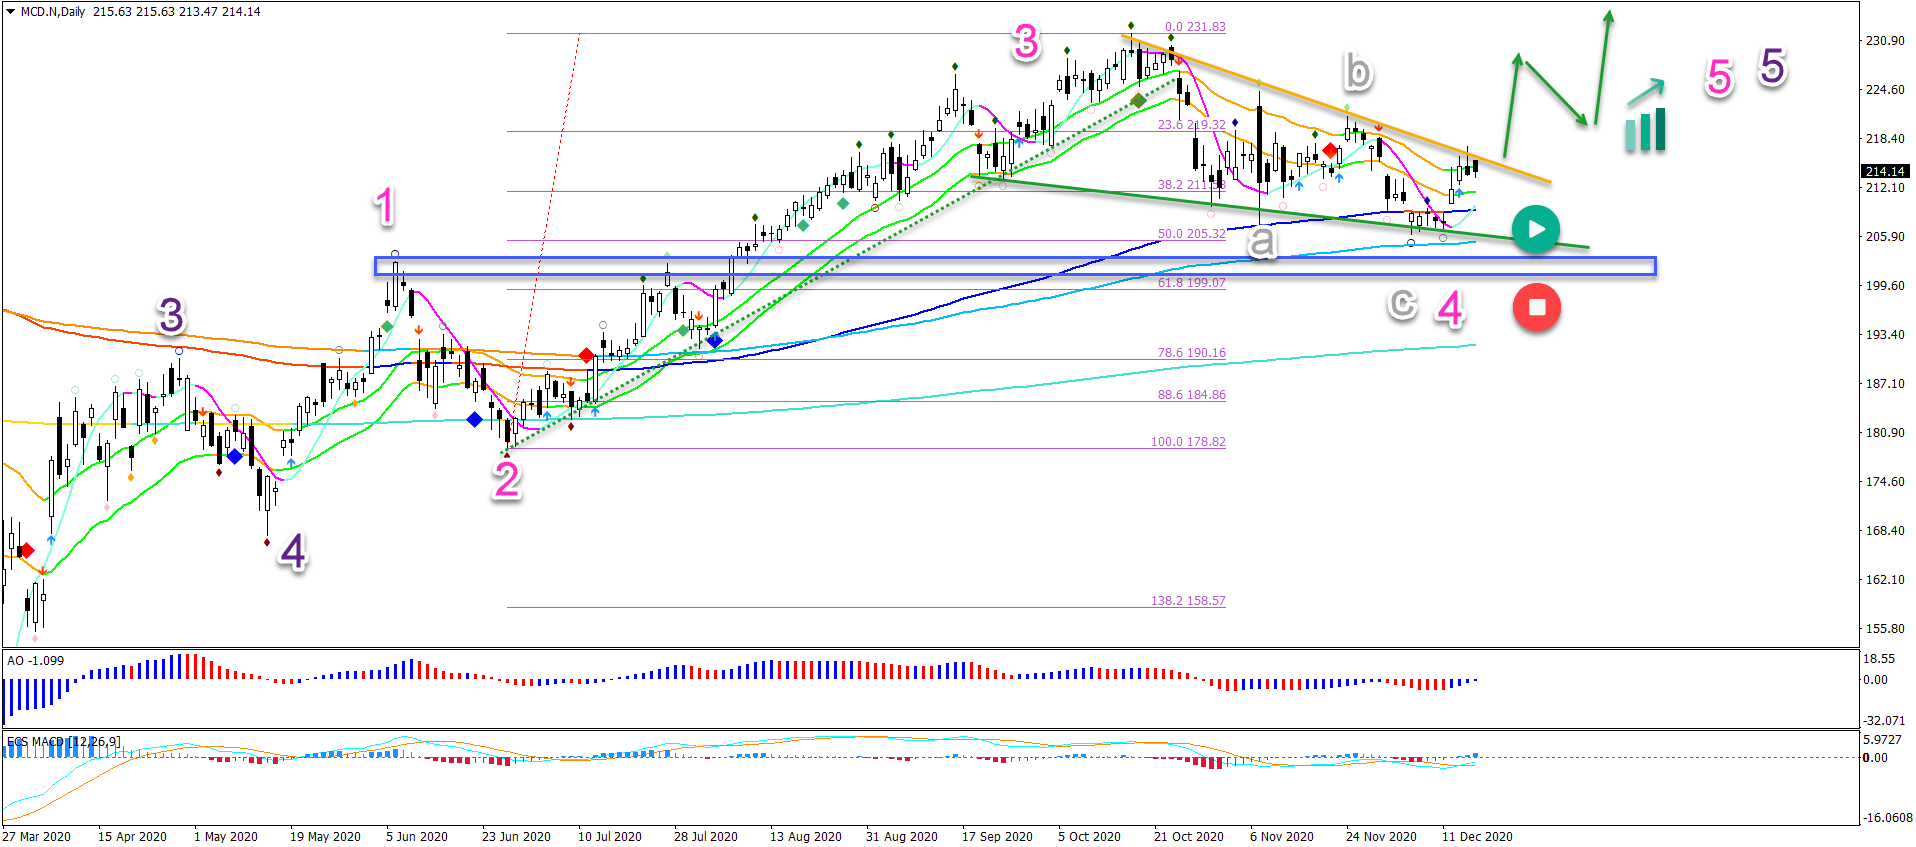
MCD seems to have completed a wave 4 (pink) pattern. This remains valid as long as price stays above the top of wave 1 (blue box).
A wave 5 pattern could emerge above the resistance zone. The main targets for upside are the -27.2% Fib at $246 and -61.8% Fib target at $264.
Price Charts and Technical Analysis
MCD seems to have completed a wave 4 (pink) pattern. This remains valid as long as price stays above the top of wave 1 (blue box). A break below it invalidates (red circle) our wave outlook.
A bullish breakout, on the other hand, confirms our bullish view. A wave 5 pattern could emerge above the resistance zone.
The main targets for upside are the -27.2% Fib at $246 and -61.8% Fib target at $264.
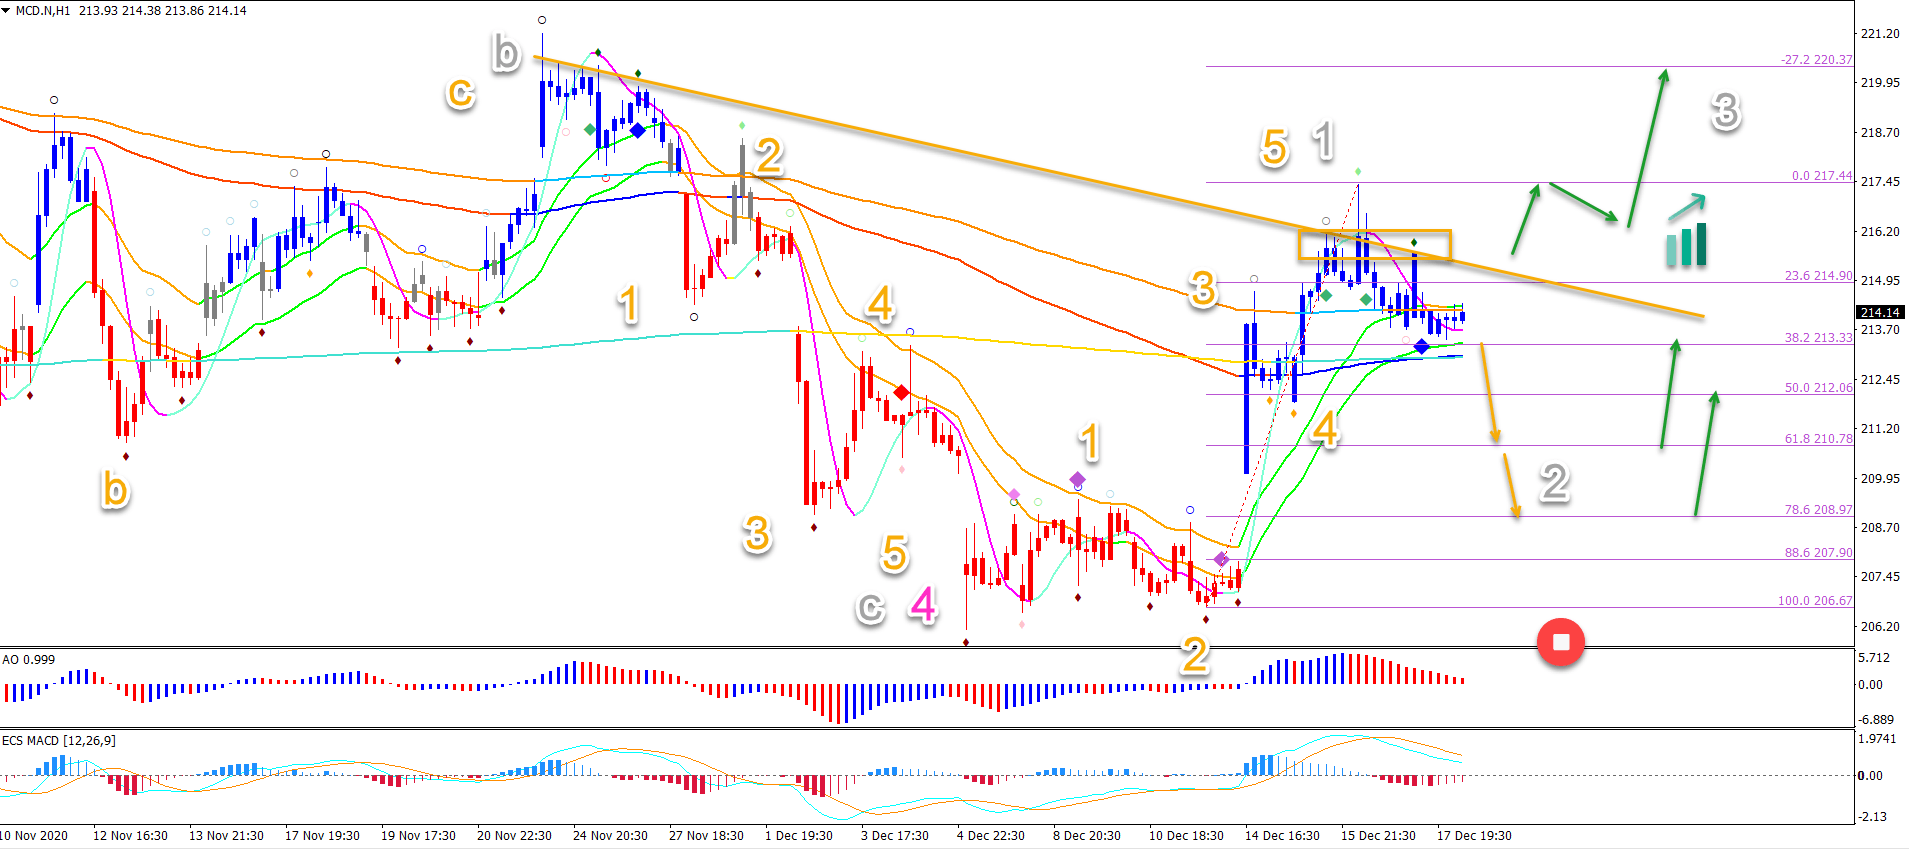
On the 1 hour chart, we see a first hint of a bullish reversal: the price action completed a 5 wave (orange) pattern. This seems to complete a wave 1 (grey).
A bearish breakout could indicate a deeper retracement towards the Fibonacci retracement levels. They are expected to create a bounce or reversal.
Only a break below the bottom and 100% Fibonacci level indicates an invalidation (red circle).
A bullish breakout could indicate a new uptrend again.
After the break, price action should make a bull flag to avoid any false breakouts