
A note on lower timeframe confirming price action…
Waiting for lower timeframe confirmation is our main tool to confirm strength within higher timeframe zones, and has really been the key to our trading success. It takes a little time to understand the subtle nuances, however, as each trade is never the same, but once you master the rhythm so to speak, you will be saved from countless unnecessary losing trades. The following is a list of what we look for:
- A break/retest of supply or demand dependent on which way you’re trading.
- A trendline break/retest.
- Buying/selling tails … essentially we look for a cluster of very obvious spikes off of lower timeframe support and resistance levels within the higher timeframe zone.
- Candlestick patterns. We tend to only stick with pin bars and engulfing bars as these have proven to be the most effective.
We typically search for lower-timeframe confirmation between the M15 and H1 timeframes, since most of our higher-timeframe areas begin with the H4. Stops are usually placed 1-3 pips beyond confirming structures.
EUR/USD
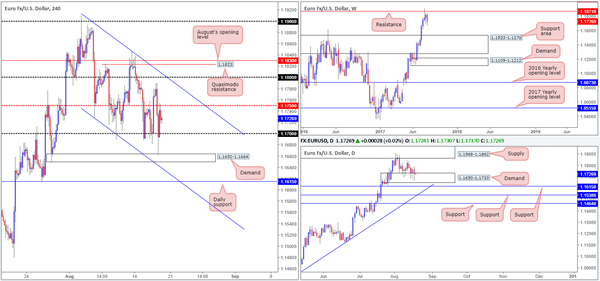
Leaving the 1.18 psychological band unchallenged, the single currency chomped its way through the H4 mid-level support at 1.1750 during yesterday’s London morning segment. This, as you can see, allowed the unit to aggressively whipsaw through the 1.17 handle, challenge a H4 demand at 1.1650-1.1664 and end the day retesting 1.1750 as resistance.
Building a case for entry in this market has been (and still is) proving difficult. On the daily timeframe, the pair remains bolstered by demand coming in at 1.1650-1.1733. A little higher up on the curve, however, the weekly timeframe shows price trading from a resistance at 1.1871.
Suggestions: Unless we’re missing something obvious here, this market remains technically challenging. A long would place you in direct conflict with potential weekly sellers, and a short against possible daily buyers! Considering this, our desk will remain on the sidelines today and look to reassess structure going into Monday’s open.
Data points to consider: US Prelim UoM consumer sentiment at 9pm, followed closely by FOMC member Kaplan speaking at 3.15pm GMT+1.
Levels to watch/live orders:
- Buys: Flat (stop loss: N/A).
- Sells: Flat (stop loss: N/A).
GBP/USD:
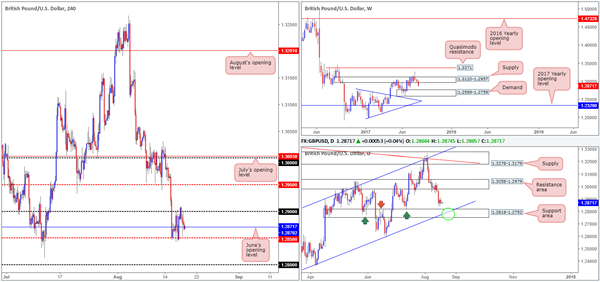
Since Tuesday, the H4 candles have been consolidating between the 1.29 handle and the mid-level support at 1.2850. While we cannot rule out the possibility of fresh upside attempts within the current H4 range, the odds of price breaching 1.2850 is high, in our humble view.
Our reasoning lies within the higher-timeframe structure. The daily support area at 1.3058-1.2979 recently gave way leaving downside free to challenge the daily support area pegged at 1.2818-1.2752 (converges with a daily channel support extended from the low 1.2365). Further supporting the bears, the weekly timeframe shows space for the market to trade as far down as the demand area coming in at 1.2589-1.2759.
Suggestions: Selling sub 1.2850, however, is problematic. Located only 30 pips below this number is the top edge of the aforementioned daily support area, shadowed closely by the 1.28 handle drawn on the H4 chart. As a result,
we are looking for the market to challenge the current daily support area and its fusing channel support (green circle). It will be from this point that we’ll begin hunting for long opportunities on the H4 timeframe and lower.
Data points to consider: US Prelim UoM consumer sentiment at 9pm, followed closely by FOMC member Kaplan speaking at 3.15pm GMT+1.
Levels to watch/live orders:
- Buys: 1.2818-1.2752 is an interesting base for long opportunities.
- Sells: Flat (stop loss: N/A).
AUD/USD
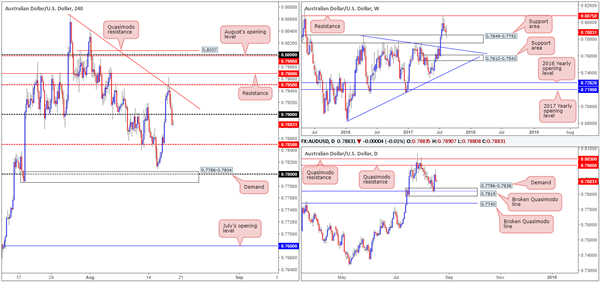
Failing to sustain gains beyond the converging H4 mid-level resistance at 0.7950 and trendline resistance (taken from the high 0.8065) saw the commodity currency change course on Thursday and head into negative territory. In recent hours the 0.79 handle was consumed, leaving the pair free to challenge the H4 mid-level support at 0.7850.
Turning our attention over to the bigger picture, we can see the weekly support area at 0.7849-0.7752 remains in play. While this may be the case, it might be worth noting that the current weekly candle exhibits indecisiveness at the moment. Down on the daily timeframe, the bounce seen from demand at 0.7786-0.7838, which encases a broken Quasimodo level at 0.7819, failed to reach the daily Quasimodo resistance at 0.7988 before turning red. By and of itself, this could imply that we may see the unit retest the demand today/ early next week.
Suggestions: While the daily picture shows room for the piece to trade lower, a short at 0.79 is not something we’d be comfortable with. Given that this market is entrenched within a strong uptrend, and weekly price holding at demand, albeit without conviction, we feel remaining on the sidelines may be the better bet here.
Data points to consider: US Prelim UoM consumer sentiment at 9pm, followed closely by FOMC member Kaplan speaking at 3.15pm GMT+1.
Levels to watch/live orders:
- Buys: Flat (stop loss: N/A).
- Sells: Flat (stop loss: N/A).
USD/JPY
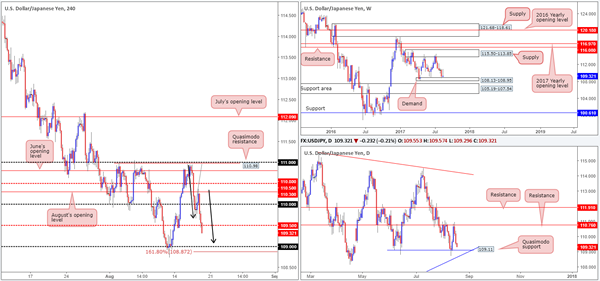
Weekly bulls, as you can see, are struggling to gather momentum from demand at 108.13-108.95. A violation of this zone will lead to price almost immediately challenging a support area seen at 105.19-107.54. A closer look at price action on the daily timeframe, however, shows that the unit is currently hovering ahead of a Quasimodo support at 109.11. This level held the market higher on Friday last week, so there’s a chance we may see history repeat itself here.
Moving across to the H4 timeframe, price recently crossed below the mid-level support at 109.50. Should the bears remain dominant here, the next level on the hit list is the 109 handle. Also of particular interest on this scale is the AB=CD approach (black arrows), completing just beneath 109 at 108.87 (161.8% Fib ext. point).
Suggestions: A long from the 109 handle could be an option today, given the H4 approach (AB=CD), daily Quasimodo support and weekly demand. To be on the safe side though, we would highly recommend waiting for a H4 bull candle to form in the shape of a full, or near full-bodied candle. Although this will not guarantee a winning trade, it will show buyer intent!
Data points to consider: US Prelim UoM consumer sentiment at 9pm, followed closely by FOMC member Kaplan speaking at 3.15pm GMT+1.
Levels to watch/live orders:
- Buys: 1.09 region ([waiting for a reasonably sized H4 bullish candle to form– in the shape of either a full, or near-full-bodied candle – is advised] stop loss: ideally beyond the candle’s tail).
- Sells: Flat (stop loss: N/A).
USD/CAD
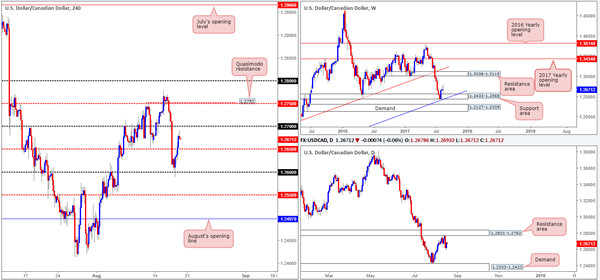
Early on in yesterday’s London segment, H4 price challenged the 1.26 handle and gravitated north. The mid-level resistance at 1.2650 was engulfed going into the US session, opening up the backdoor to 1.27. As you can see though, price has so far been unable to challenge this psychological band.
The bullish momentum seen from the weekly support area at 1.2433-1.2569 has, over the past couple of weeks, diminished. This likely has something to do with the daily resistance area at 1.2831-1.2763 that elbowed its way into view this week.
Suggestions: With selling pressure being seen from daily structure, and weekly price holding above a support area, direction is somewhat restricted at the moment.
We do, however, like the H4 Quasimodo resistance level at 1.2752, which aligns nicely with the H4 mid-level resistance at 1.2750 and the lower edge of the said daily resistance area. Nevertheless, shorting here would place you against potential weekly buying!
Data points to consider: Canadian inflation figures at 1.30pm GMT+1.
Levels to watch/live orders:
- Buys: Flat (stop loss: N/A).
- Sells: 1.2750 region ([waiting for a reasonably sized bearish candle to form– in the shape of either a full, or near-full-bodied candle – is advised] stop loss: ideally beyond the candle’s wick).
USD/CHF
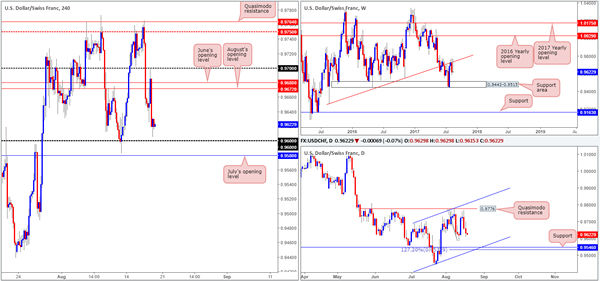
After aggressively whipsawing through June and August’s opening levels at 0.9680/0.9672 and coming within a few pips of the 0.97 handle, the pair went on to erase daily gains during the US segment. With H4 price seen hovering just ahead of the 0.96 handle right now, what’s likely in store for this market today?
According to weekly structure, further selling could be upon us. The trendline resistance extended from the low 0.9257 remains in view, and therefore could send the unit down as far as the support area penciled in at 0.9443-0.9515. Also of particular interest is the daily timeframe. The chart shows room for the pair to trade as far down as support coming in at 0.9546, which happens to unite with a channel support etched from the low 0.9438 and a AB=CD 127.2 Fib ext. at 0.9532.
Suggestions: Despite both weekly and daily structure indicating further selling could be on the cards, the 0.96 handle and July’s opening level at 0.9580 are not levels we’d feel comfortable selling into. Usually, in cases such as this, we would simply wait for these levels to be consumed and then look to trade the retest. However, given the distance between 0.9580 and 0.9546 (the daily support) is only 34 pips, we’re unfortunately left with little room to maneuver for a short.
Data points to consider: US Prelim UoM consumer sentiment at 9pm, followed closely by FOMC member Kaplan speaking at 3.15pm GMT+1.
Levels to watch/live orders:
- Buys: Flat (stop loss: N/A).
- Sells: Flat (stop loss: N/A).
DOW 30
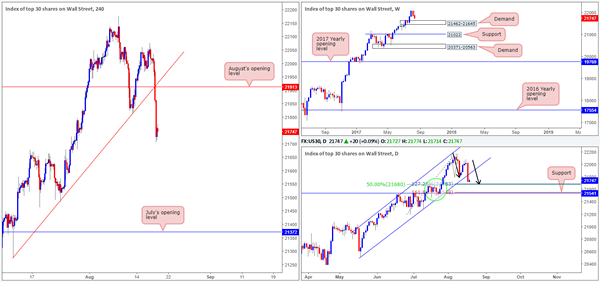
The US equity market came under considerable pressure on Thursday. The H4 trendline support etched from the low 21273, alongside August’s opening level at 21913, was engulfed as a result of this. Traders may have also noticed that daily action closed below a channel support line extended from the low 20494. With that being said, however, the daily candles are now seen loitering just ahead of an AB=CD (black arrows) 127.2% Fib ext. point at 21683, and a converging 50% support line at 21680 drawn from the low 21192.
If you’re in the process of considering whether or not it’s worth taking a long from the daily AB=CD 127.2% completion point, you may want to look at the weekly timeframe. A fresh demand is seen lurking just below current price at 21462-21645. Of particular interest is the top edge of this area being positioned just above the daily support level at 21541 (converges with daily AB=CD 161.8% Fib ext. point) and a few points below the AB=CD completion 127.2% point!
Our suggestions: Personally, a long from the daily support mentioned above at 21541 seems the most logical, in our opinion. The level, as mentioned above, fuses with a daily AB=CD 161.8% ext. point and is positioned within the noted weekly demand. Further adding to this, the trend in this market is incredibly strong, and by trading long from 21541, we can place stops below the consolidation of candles seen marked with a green circle on the daily chart at 21459.
Data points to consider: US Prelim UoM consumer sentiment at 9pm, followed closely by FOMC member Kaplan speaking at 3.15pm GMT+1.
Levels to watch/live orders:
- Buys: 21541 region (stop loss: 21459).
- Sells: Flat (stop loss: N/A).
GOLD
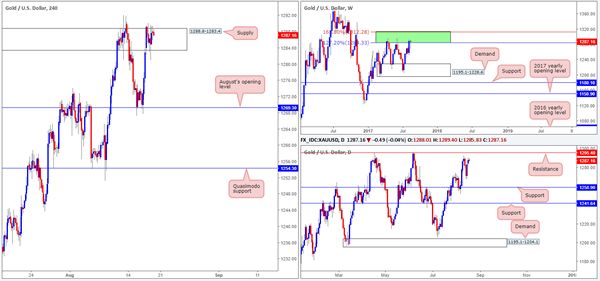
It was a relatively sober day in the gold market yesterday, with price continuing to loiter within H4 supply coming in at 1288.8-1283.4. As a result of this, much of the following report will echo thoughts put forward in Thursday’s analysis.
From the weekly timeframe, we can see that the bears are struggling to hold ground. Of course, it’s far too early to judge just yet since the green weekly resistance area (comprised of two weekly Fibonacci extensions 161.8/127.2% at 1312.2/1284.3 taken from the low 1188.1) has managed to successfully hold the metal lower on two separate occasions in the past.
The story on the daily chart, nevertheless, shows price trading nearby a resistance level at 1295.4. Apart from the two instances on 17/04/2017 and 06/06/2017, there’s little history registered with this number! For that reason, we may see price break above this line and head to the resistance carved from 1308.4, which boasts very attractive history dating back to early 2011.
The way we see things right now is the above noted H4 supply is the last barrier stopping daily price from connecting with resistance mentioned above at 1295.4.
Our suggestions: Based on the above, our desk will not be looking for (long-term) shorts until the daily resistance line plotted at 1308.4 is in play. This is due to the history surrounding this number and its position within the current weekly resistance area (allowing us to place stops tightly above this zone). Regarding intraday opportunities, we still see very little to hang our hat on at the moment.
Levels to watch/live orders:
- Buys: Flat (stop loss: N/A).
- Sells: 1308.4 region. This is, given the location of this daily resistance on the weekly timeframe, a fantastic level to be looking for a short from.


