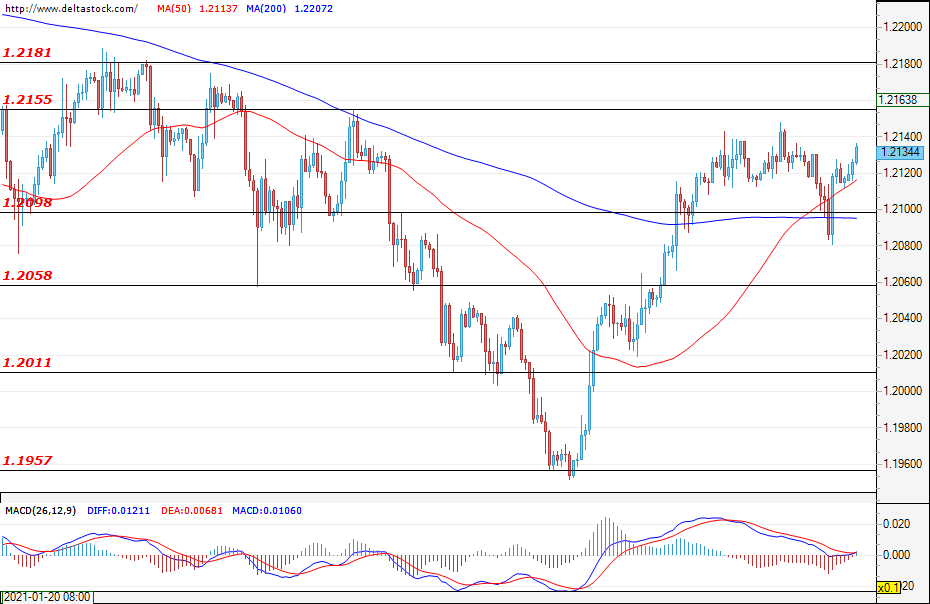
EUR/USD
Current level – 1.2134
During the last few trading sessions, the currency pair formed a narrow price range between 1.2098 – 1.2155. At the time of writing, neither the bulls nor the bears have been able to prevail, with the most likely scenario for today being a test of the resistance zone at 1.2155. The first significant support is the 1.2098 level. The most important economic news for this week is the data on retail sales for the U.S. (Wednesday; 13:30 GMT), the PPI data for the U.S. (Wednesday; 13:30 GMT), as well as the consumer price index data for the euro area (Thursday; 10:00 GMT).
| Resistance | Support | ||
| intraday | intraweek | intraday | intraweek |
| 1.2155 | 1.2230 | 1.2098 | 1.2011 |
| 1.2121 | 1.2300 | 1.2058 | 1.1957 |
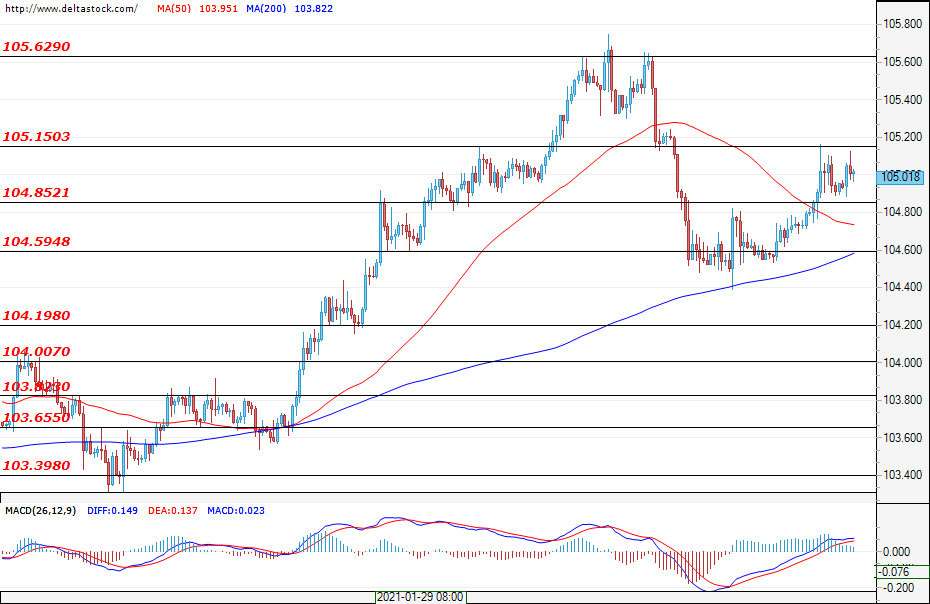
USD/JPY
Current level – 105.01
During the last week, trading was limited to the narrow range between 104.40 – 104.85, and it was only in the last trading session on Friday when the Ninja managed to leave the range and test the next resistance zone at 105.15. At the time of writing the analysis, the currency pair has not finished the test of the mentioned area. The most likely scenario is for a breach of the resistance and a test of the next level at around 105.62. In the negative direction, the main support lies at the level of 104.60.
| Resistance | Support | ||
| intraday | intraweek | intraday | intraweek |
| 105.15 | 106.70 | 104.85 | 104.19 |
| 105.62 | 107.40 | 104.59 | 103.39 |
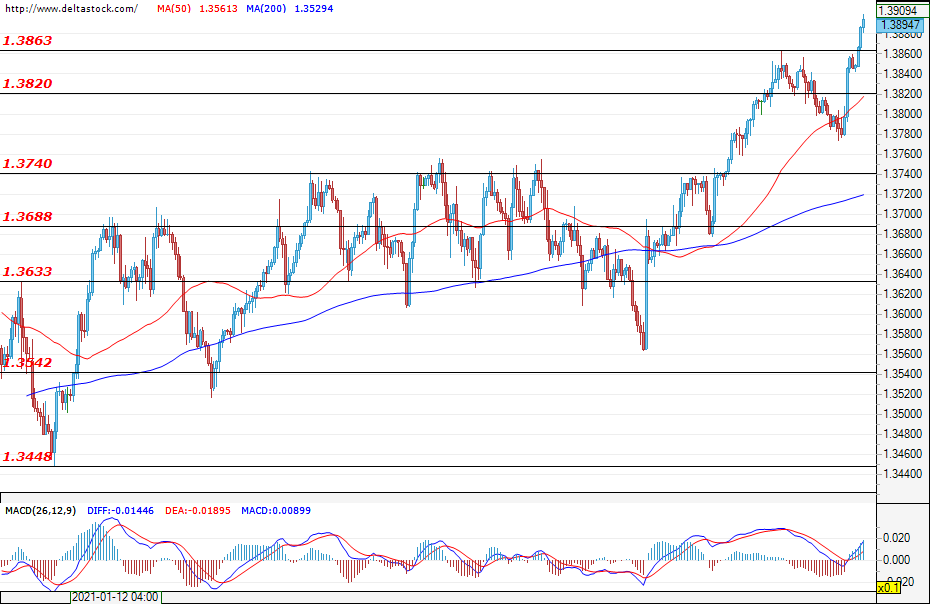
GBP/USD
Current level – 1.3894
The upward trend resumed after the short-term decline was limited to 1.3780. The subsequent appreciation and the definite breach of the main resistance at 1.3863 gave buyers an additional incentive. The sentiment is entirely positive and it is highly probable for the pair to breach the next significant level in the upward direction – 1.3970. In the event of bear predominance and the development of a corrective phase, the bullish sentiment from the higher time frames will remain unchanged and the decline should be limited to the main support level at 1.3740.
| Resistance | Support | ||
| intraday | intraweek | intraday | intraweek |
| 1.3895 | 1.4000 | 1.3863 | 1.3740 |
| 1.4000 | 1.4100 | 1.3820 | 1.3688 |