The EUR/USD currency pair
Technical indicators of the currency pair:
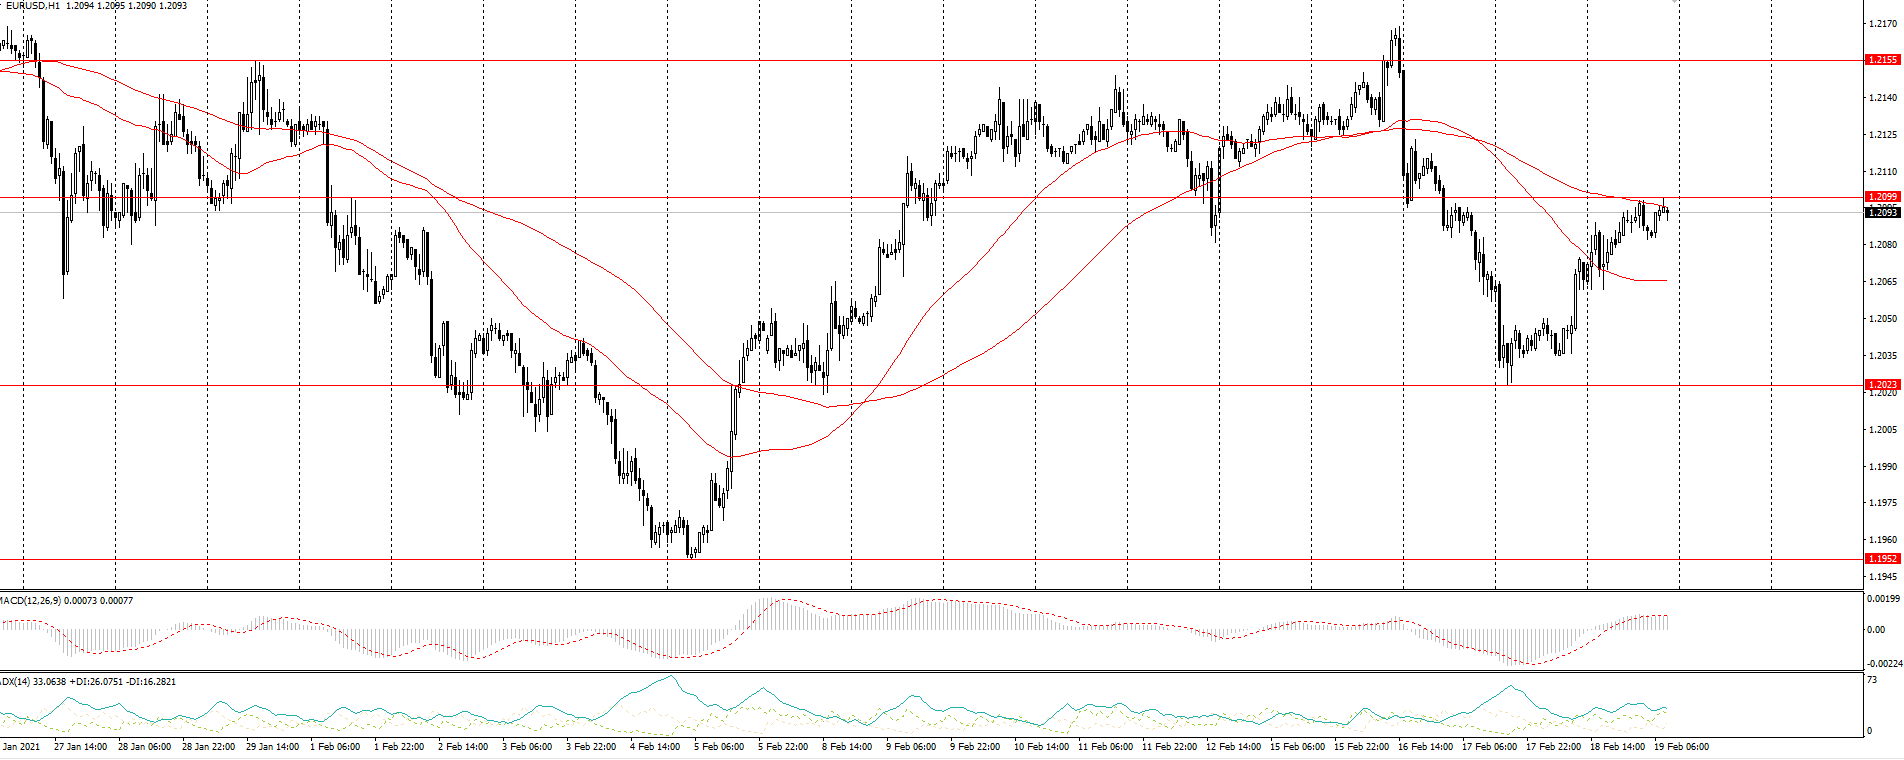
Prev Open: 1.2038
Prev Close: 1.2090
% chg. over the last day: +0.43%.
The pair stopped the decline on Thursday. Though, it is too early to talk about the resumption of growth. Many signs indicate that the price is beginning to stabilize in a range, the boundaries of which will emerge later. On the daily chart, the price is stuck between the moving averages and is staying there for the second week, which indicates a gradual decrease in volatility.
Trading recommendations
Support levels: 1.2023, 1.1952
Resistance levels: 1.2099, 1.2155, 1.2189
The main scenario for the EUR/USD is trading in the range between 1.2099 and 1.2023. On the D1, H4, and H1 timeframes, the picture remains unchanged – the price is stuck between the SMA50 and the SMA100 moving averages. The ADX showed very little reaction to the northern impulse on Thursday, indicating the possibility of a halt in growth. These are all signs of the beginning of trading in a sideways range.
Alternative scenario: if the price manages to consolidate above the level of 1.2099, the pair may continue to rise to 1.2155. A break at 1.2023 could send the pair towards 1.1952.
News feed for 2021.02.19:
- The German Manufacturing Purchasing Managers’ Index (PMI) (Feb) at 10:30 (GMT+2);
- The Eurozone Manufacturing Purchasing Managers’ Index (PMI) (Feb) at 11:00 (GMT+2).
The GBP/USD currency pair
Technical indicators of the currency pair:
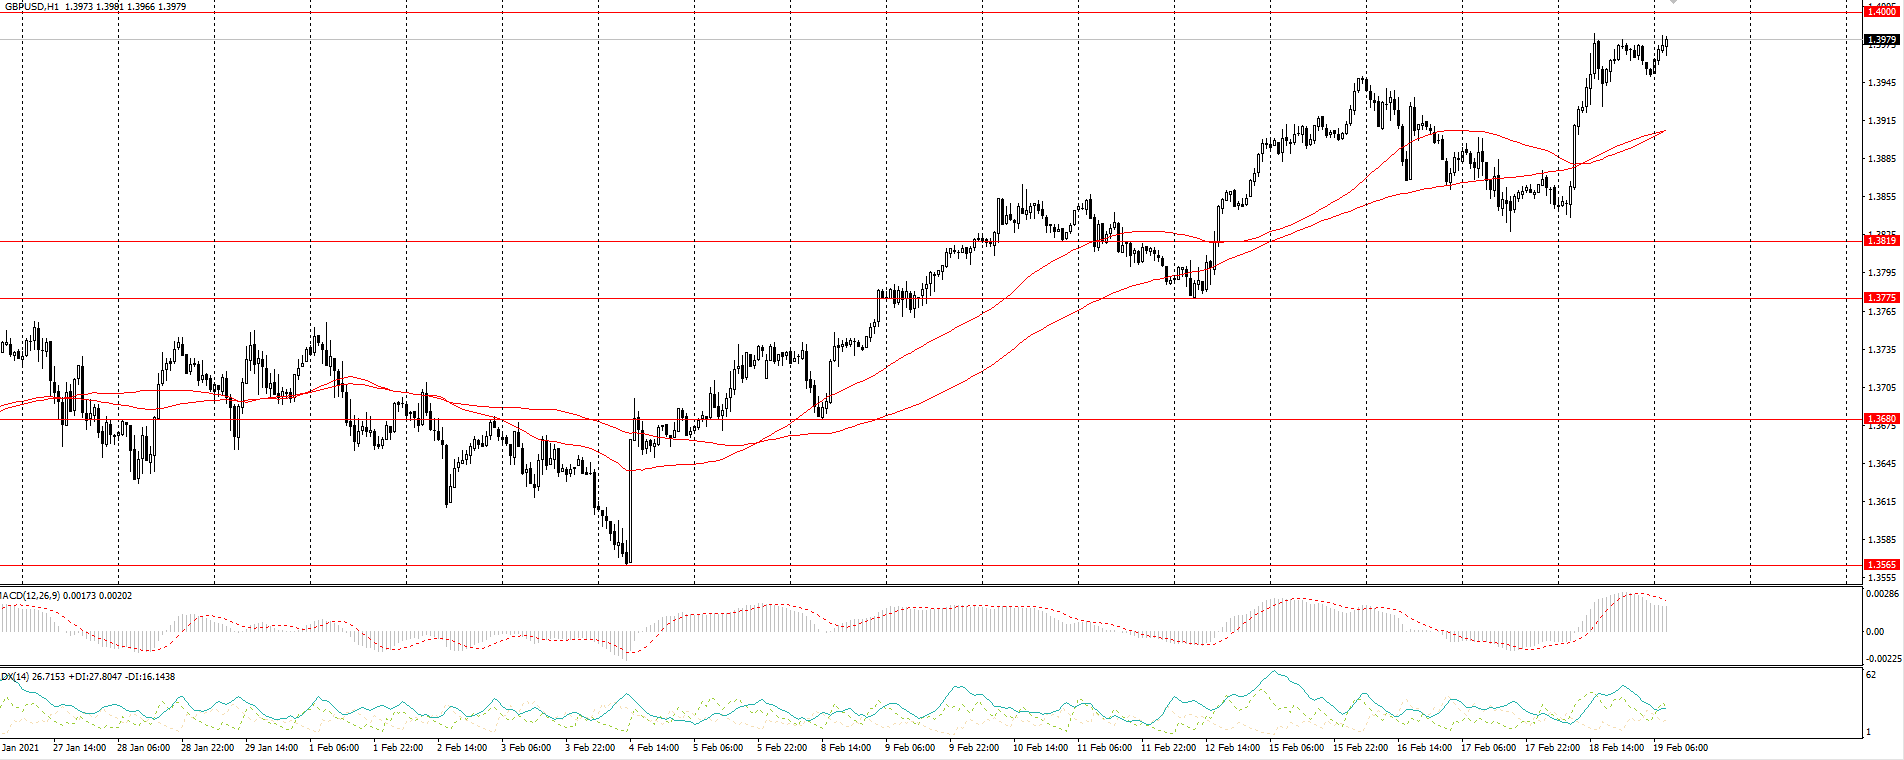
Prev Open: 1.3857
Prev Close: 1.3970
% chg. over the last day: +0.82%
On Thursday, the sterling showed its biggest intraday gain since January 12. According to LIBOR data, a significant difference in cash liquidity in favor of the dollar continues to put upward pressure on the pair. At the same time, the negative data in the US from the labor market strengthens the northern trend in the GBP/USD.
Trading recommendations
Support levels: 1.3819, 1.3775
Resistance levels: 1.4000, 1.4050
The main scenario for the GBP/USD is buying. On the hourly timeframe, the price has fixed above the moving averages, which indicates the end of the pullback. Convergence has been formed on the MACD, confirming the north direction. The ADX shows high bullish potential.
Alternative scenario: if the pair consolidates below 1.3910, it may return to 1.3819.
News feed for 2021.02.19:
- The UK retail sales (m/m) (Jan) at 09:00 (GMT+2);
- The UK Services Purchasing Managers’ Index (PMI) (Feb) at 11:30 (GMT+2).
The USD/JPY currency pair
Technical indicators of the currency pair:
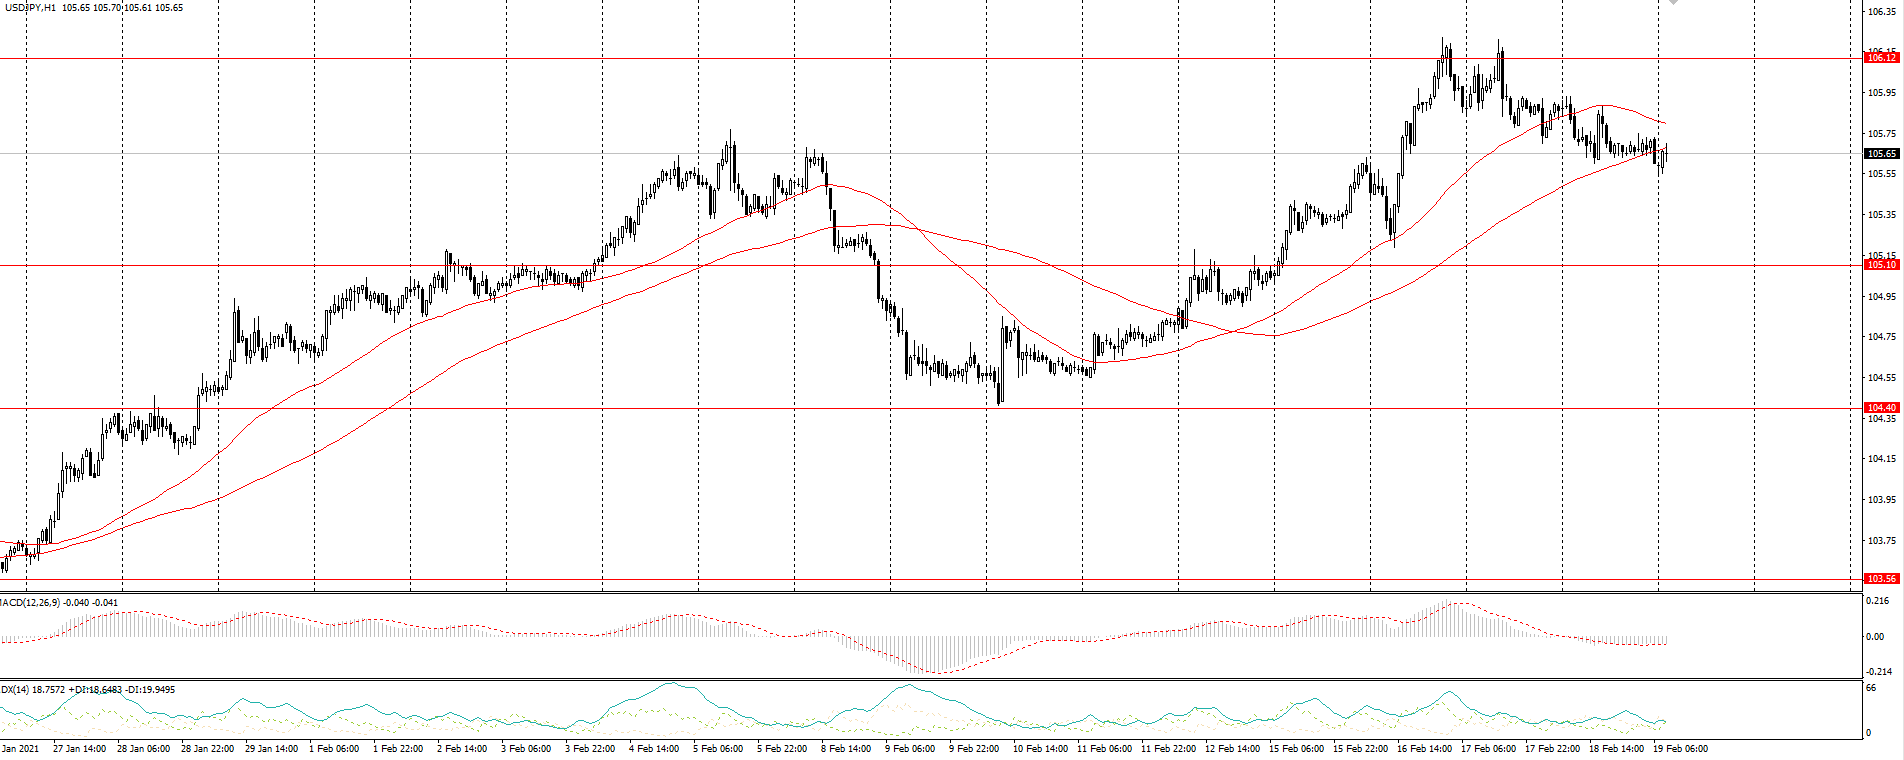
Prev Open: 105.84
Prev Close: 105.65
% chg. over the last day: -0.18%
The dollar-yen continues its gradual decline following risky assets. In the stock market, there is a decline in demand for shares, which leads to an appreciation of the yen. But at the same time, the growth in the yield of American Treasuries may indicate the imminent completion of the correction. In this case, bears in the USD/JPY should be vigilant.
Trading recommendations
Support levels: 105.10, 104.40
Resistance levels: 106.12, 106.55
The main scenario is trading in a range between 105.80 and 105.10. The bullish direction is still dominating, despite the price-fixing below the moving averages. The ADX shows no reaction to the southern movement, and the gradual decline looks more like a consolidation.
An alternative scenario implies the price-fixing above 105.80. In this case, the pair may resume growth to 106.12 – 106.55. A breakthrough of 105.10 could trigger a further decline towards 104.40.
The USD/CAD currency pair
Technical indicators of the currency pair:
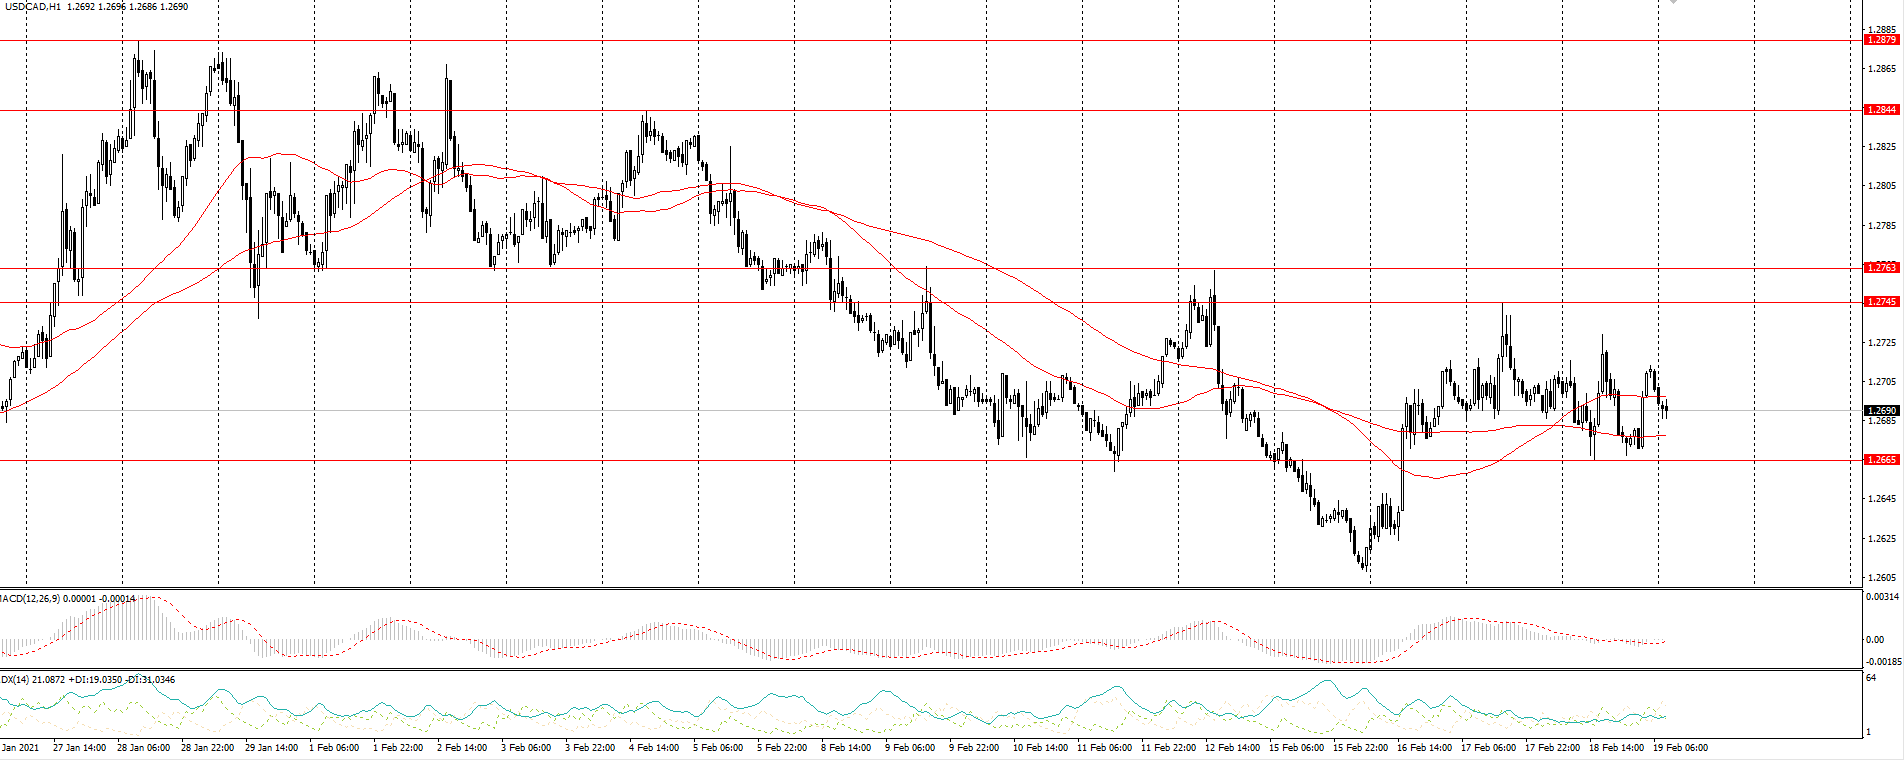
Prev Open: 1.2699
Prev Close: 1.2674
% chg. over the last day: -0.20%
Following the dollar index, the pair fell slightly after the Wednesday rise. Oil prices are subject to a southern correction, which balances the strength of bulls and bears in the short term. But the medium-term direction remains south.
Trading recommendations
Support levels: 1.2665, 1.2590, 1.2550
Resistance levels: 1.2745, 1.2763
The main scenario is trading in a sideways range between 1.2665 and 1.2745. The ADX and the MACD have dropped to their minimum values, which indicates the absence of price direction. The pair is between the moving averages. This indicates that the instrument is stuck in the range.
Alternative scenario: if the price manages to consolidate below 1.2665, the pair may resume its decline to the level of 1.2590. A rise above 1.2745 will indicate a continuation of the northern correction.