EUR/USD made a bullish bounce at the 144 ema close. The uptrend is now aiming at the Fibonacci targets after price action broke above the resistance.
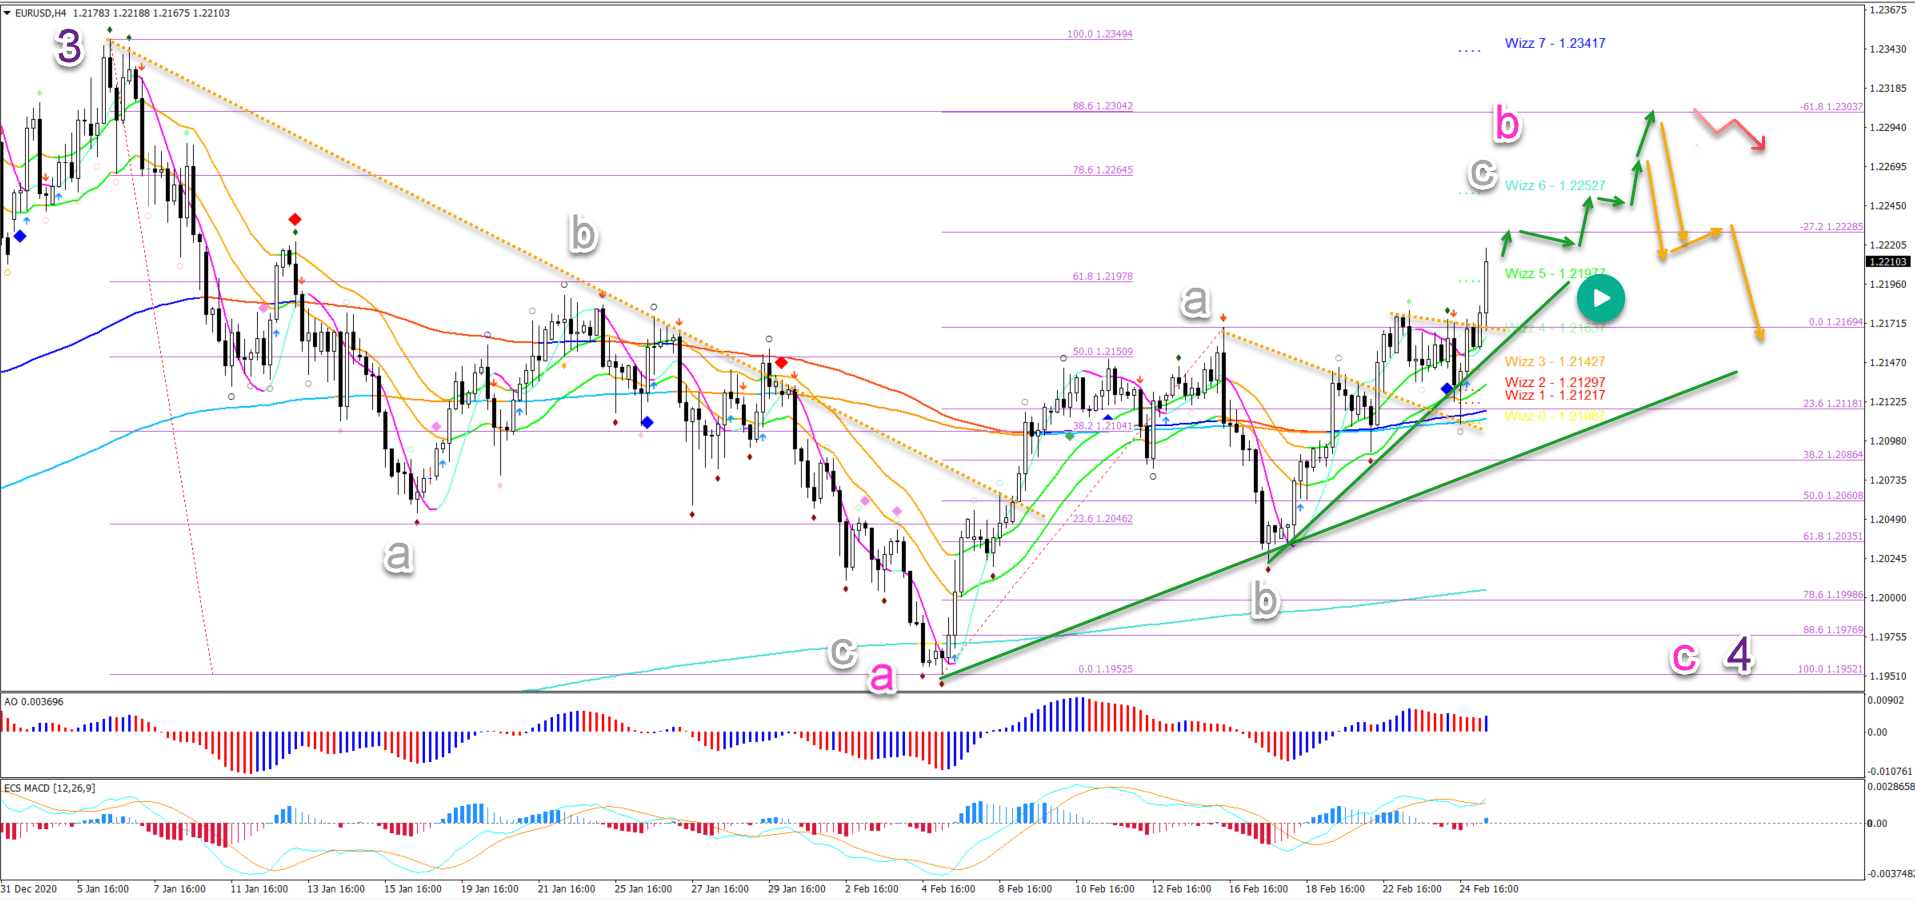
The EUR/USD is making a bullish break as expected. The swing up is probably a wave C (grey) of larger ABC pattern (grey).
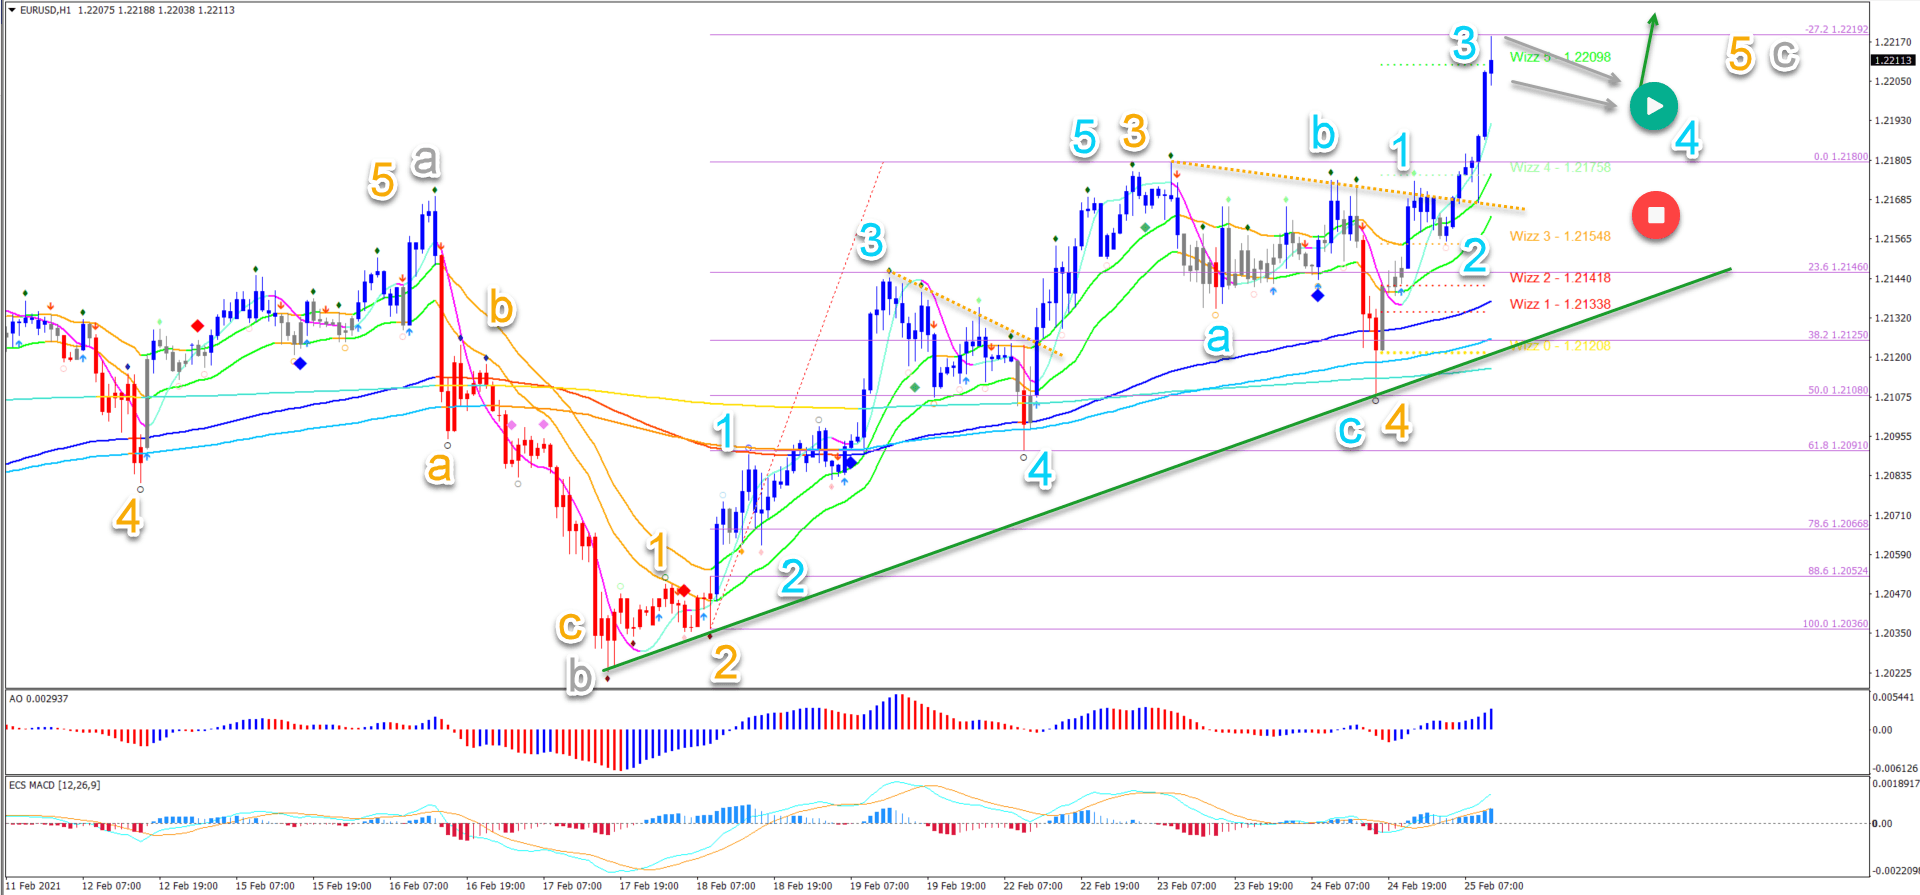
On the 1 hour chart, price action completed a bearish abc pattern in wave 4 (orange). The bullish swing is showing strong momentum. This is probably a wave 3.
This article reviews the main targets for the bulls. We also analyse the potential bearish reversal zones.
Price charts and technical analysis
The EUR/USD is making a bullish break as expected. The swing up is probably a wave C (grey) of larger ABC pattern (grey).
The main targets are therefore the -27.2% and-61.8% Fibonacci levels. Also the 78.6% and 88.6% Fibonacci retracement levels are key.
- A bearish reversal could take place in this resistance zone.
- The bounce (orange arrows) would confirm the end of the ABC (grey) in wave B (pink).
- A bearish wave C could take place in the larger wave 4 (purple).
- Later on, even a wave D and E could develop as part of a triangle pattern.
On the 1 hour chart, price action completed a bearish abc pattern(light blue) in wave 4 (orange).
The bullish swing is showing strong momentum. This is probably a wave 3 (light blue).
A bull flag chart pattern (grey arrows) would confirm the expected wave 4 (light blue) pattern. But price action must not break below the top of wave 1 otherwise the wave analysis becomes invalid (red circle).