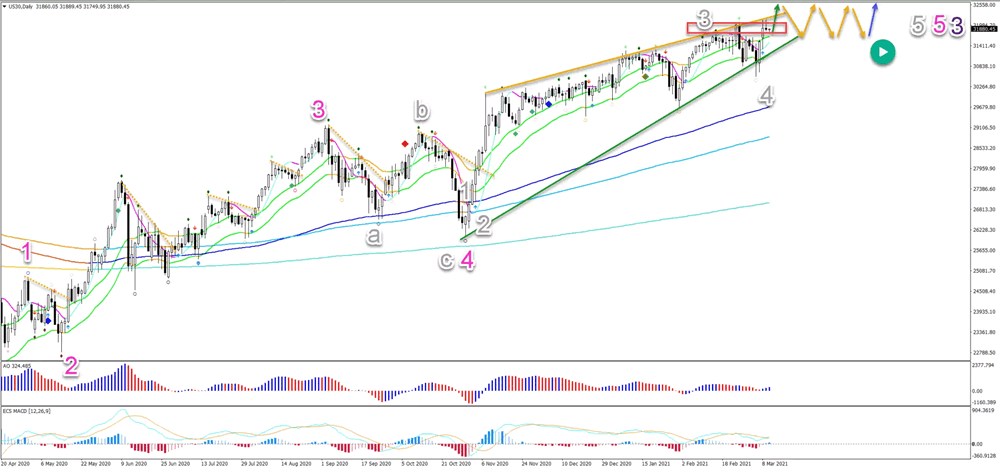
The US30 made a strong bullish bounce at the bottom of the 21 ema zone and the support trend line (green). A push higher (green arrow) is expected.
The bullish impulse is typical for a wave 3 (orange). The current pullback is a wave 4 (orange) pattern.
The first target for the upside is 32,500. The second target is at 33,000.
The Dow Jones Index (US30) made an ABC correction as expected. This has already completed a wave 4 pattern (grey). Especially when considering the strong bullish price action.
Can the bulls push the price up even higher? And if yes, what targets are expected?
Price charts and technical analysis
The US30 made a strong bullish bounce at the bottom of the 21 ema zone and the support trend line (green). A push higher (green arrow) is expected now that the wave 4 (grey) seems completed.
- The bullish breakout could complete a wave 5 (grey) of wave 5 (pink) of wave 3 (purple).
- After this bullish wave 5 of wave 3, price action could build a larger consolidation within a wave 4 (orange arrows).
- The first target for the upside is 32,500. The second target is at 33,000.
- The long-term targets (after wave 4) could aim as high as 34,250 – 35,000 later this year.
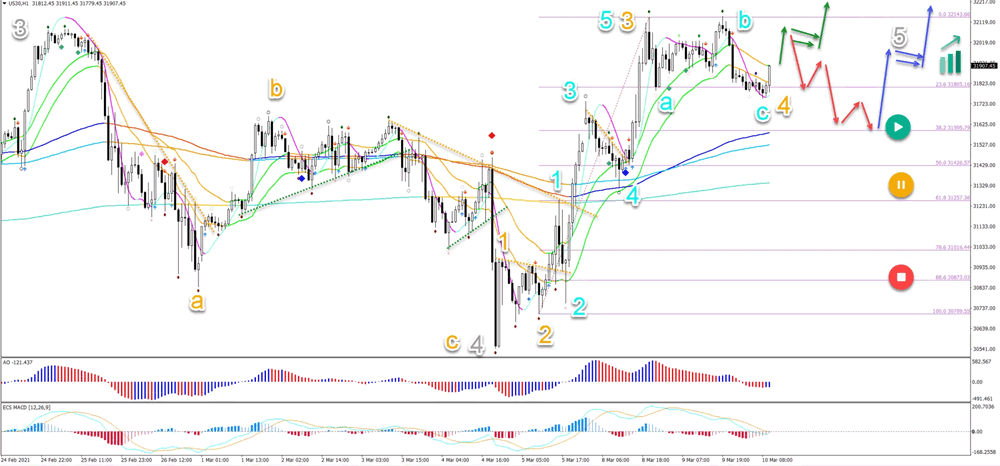
On the 1 hour chart, we can see that an ABC correction (orange) was completed as forecasted in our previous analysis. This ABC completed the wave 4 (grey).
- The bullish impulse is typical for a wave 3 (orange).
- The current pullback is a wave 4 (orange) pattern as long as price remains above the shallow Fibonacci levels.
- The most common Fibs for the wave 4 are the 23.6% and 38.2%.
- A break below the 50% Fib places the uptrend on hold (yellow button) whereas a deeper retracement invalidates it (red circle).
- A bullish breakout is expected (green arrow). A bull flag pattern and second breakout (green arrows) could confirm the immediate uptrend.
- A strong bearish reversal (red arrow) could indicate a deeper retracement to the 38.2% Fib. An uptrend is expected from the 38.2% Fib via a bullish bounce (blue arrow).