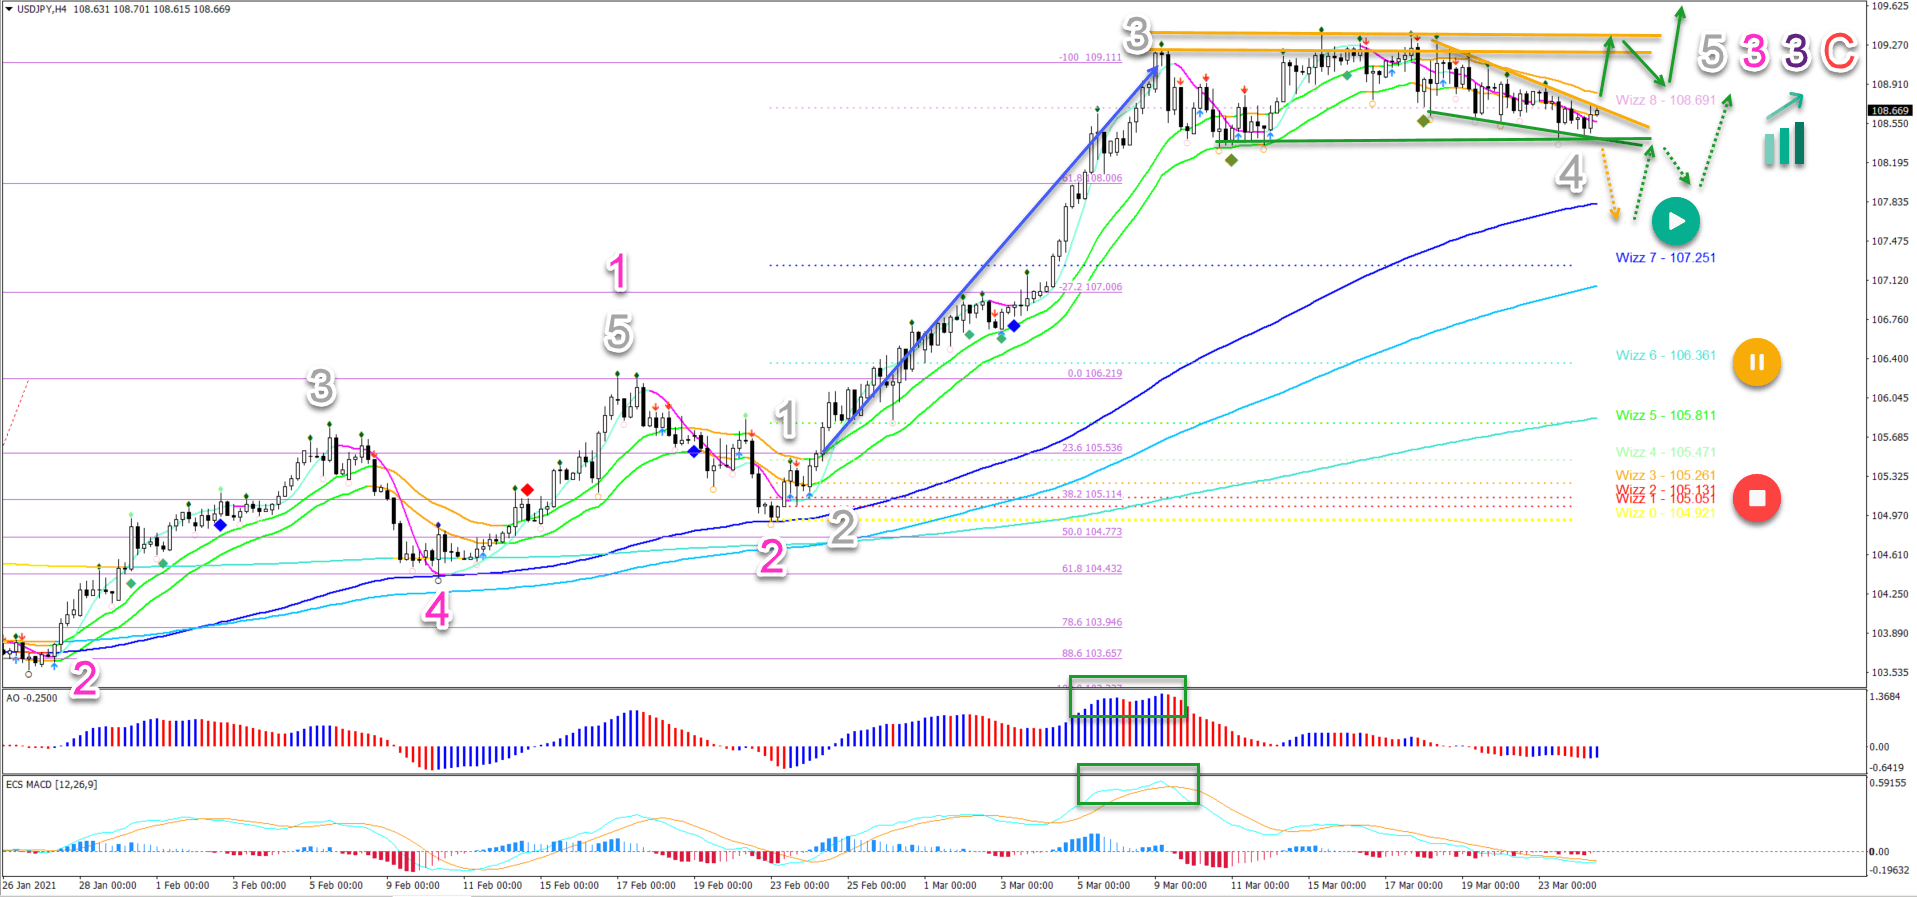
- USD/JPY is creating a sideways correction after a massive impulse upwards (blue arrow). The bulls are expected to push price action even higher.
- The USD/JPY bullish momentum is probably a wave 3 (grey). The strong AO (awesome oscillator) and ecs.MACD bars are typical for such an impulse.
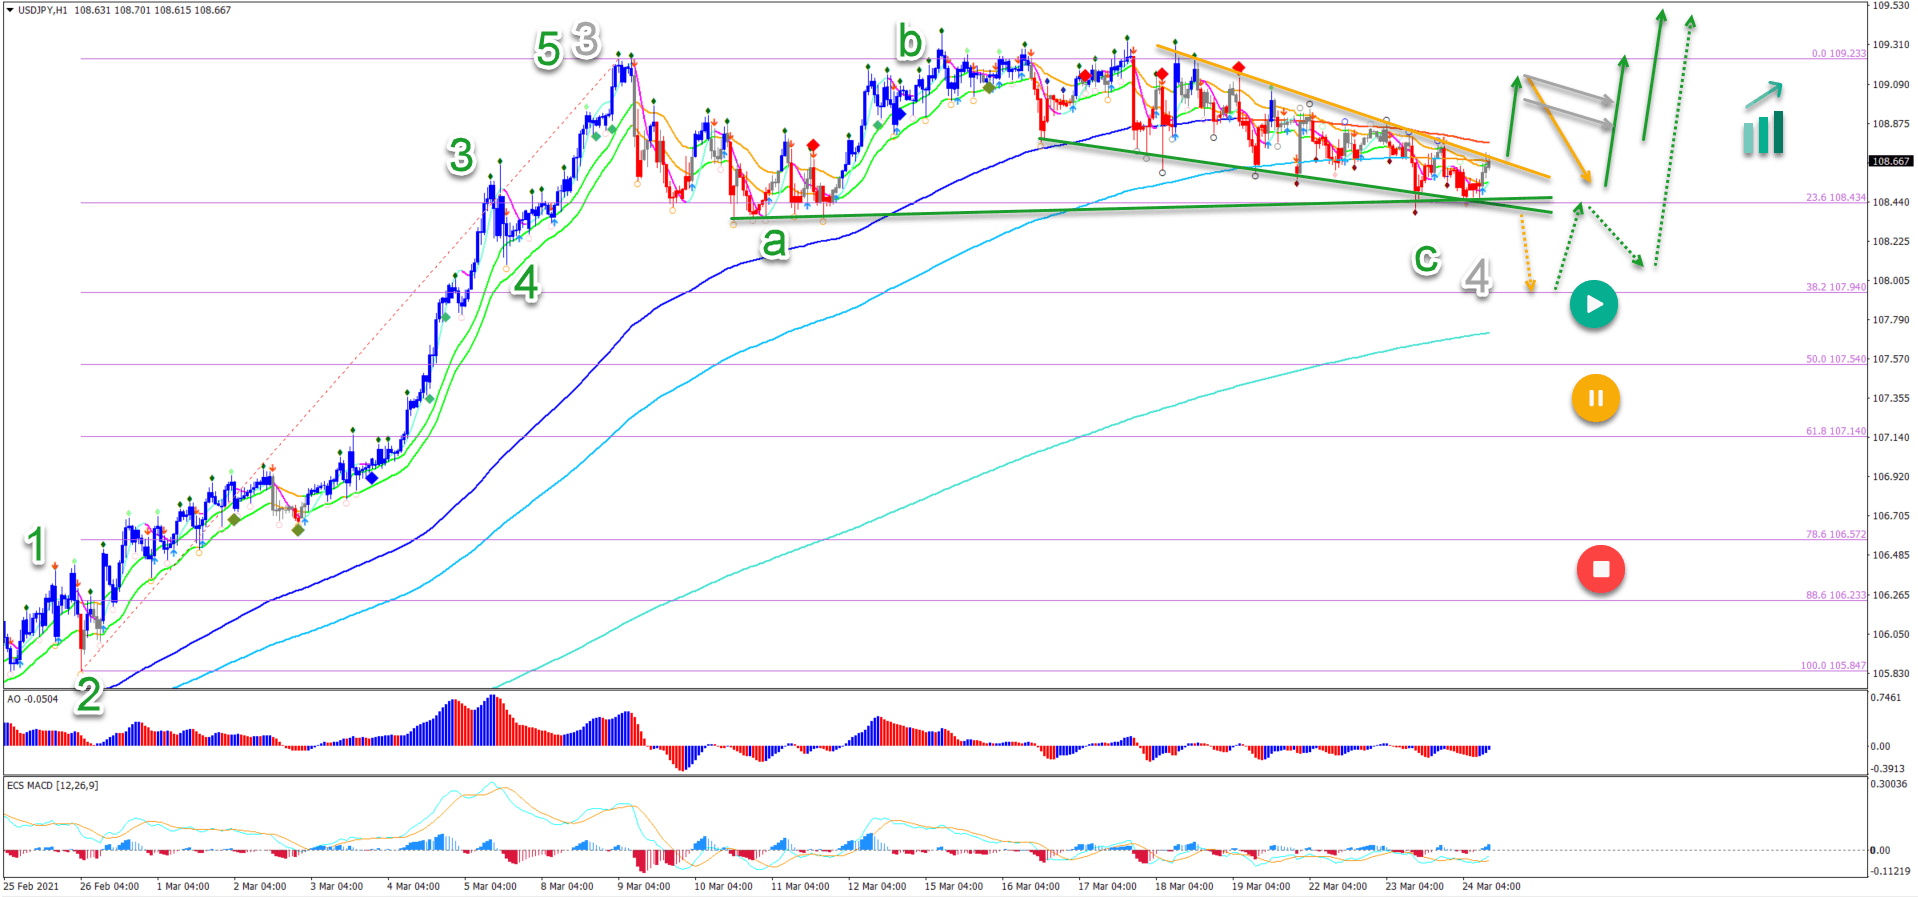
- On the 1 hour chart, the wave 4 (grey) could soon be completed because price action is finishing an ABC (green) correction.
This article examines the potential breakout and targets.
 Price charts and technical analysis
The USD/JPY bullish momentum is probably a wave 3 (grey). The strong AO (awesome oscillator) and ecs.MACD bars are typical for such an impulse.
- The sideways correction makes a wave 3 pattern more likely, because it confirms a potential wave 4 pattern (grey).
- Waves 4 are usually shallow and choppy. The current wave 4 seems to be a sideways range.
- A bullish breakout (green arrows) above the resistance (orange lines) could confirm the bullish continuation in wave 5 (grey).
- More upside is possible if price action is indeed in a wave 3 (pink) of wave 3 (purple).
- A bearish breakout below the zone (green line) could indicate a deeper pullback (orange dotted arrow). In that case, the long-term 144 moving average should stop price and create a new bounce up (green dotted arrow).
- Only a deeper retracement places the uptrend on hold (yellow button) or invalidates it (red circle).
On the 1 hour chart, the wave 4 (grey) could soon be completed because price action is finishing an ABC (green) correction.
- The wave 4 (grey) is respecting the 23.6% Fibonacci level of the wave 3 (grey).
- A bearish breakout below the support is aiming for the 38.2% Fibonacci retracement level.
- The 38.2% (and 50%) Fib are support levels which could create a bullish bounce (dotted green arrows).
- Only a deeper breakout places the uptrend view in danger (yellow and red circles).
- The immediate target for the wave 5 (grey) is the round level of 110. The second target is located at 111, which is the -1.618% Fib target of the 4 hour chart.