EUR/USD
Majors were confined to tight daily ranges this Thursday, with no big events in the macroeconomic calendar and all eyes on Draghi and Yellen’s speeches within the Jackson Hole central bankers’ meeting this Friday. Still, the greenback lost ground against its major rivals, with the EUR/USD pair settling at the upper end of its latest weekly range, a few pips above the 1.1800 level. Data coming from the US was mixed, as following an encouraging weekly unemployment claims report, showing that claims fell to 234K in the week ended August 18th, existing home sales fell to their lowest for the year in July, at a seasonally adjusted annual rate of 5.44 million.
There are lots of speculation on what the heads of the Fed and the ECB would say tomorrow. Investors go into the speeches generally believing that ECB’s Draghi will be cautious, not making any major statements, while Mrs. Yellen from the US is expected to talk normalization through reducing the balance sheet. Market’s reaction will depend on how much the speeches’ outcomes diverge from these preconceptions, with the hawker the tone, the bullish the currency.
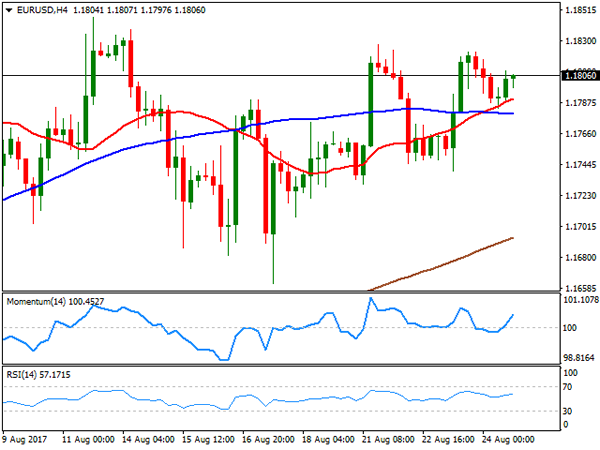
In the meantime, the neutral stance persist in the EUR/USD pair, having traded within a well-defined 100 range ever since the week started. In the 4 hours chart, the price is a few pips above its 20 and 100 SMAs, both directionless and converging in a tight range, a clear reflection of the ongoing range, while the RSI indicator in the mentioned chart holds pat around 56. The Momentum indicator in the mentioned time frame aims higher within positive territory, but the pair would need to break above 1.1860 to actually gain upward traction, whilst bears will take the grip only on a break below the 1.1680/90 region.
Support levels: 1.1770 1.1730 1.1685
Resistance levels: 1.1825 1.1860 1.1910
USD/JPY
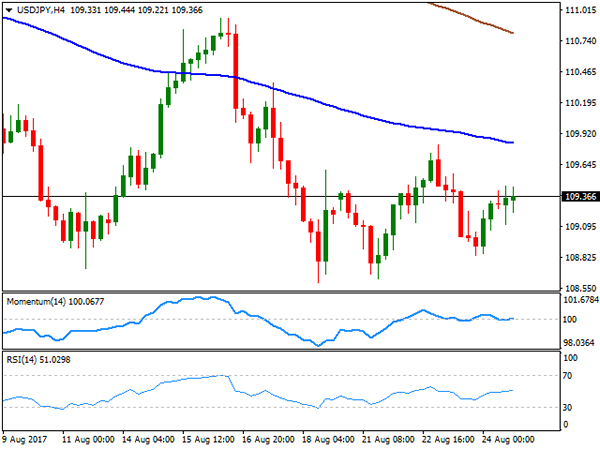
The USD/JPY pair rose up to 109.45, this Thursday, having spent most of the US session consolidating some 20 pips below the level, to end the day around 109.36. The Japanese yen eased against its American rival ever since the day started, weighed by soft local data and falling JGB yields. According to official data, Japan’s leading index improved less than initially estimated in June, climbing to 105.9 in June from 104.7 in May, and downwardly revised from 106.3. The coincident index that reflects the current economic activity rose to 117.1 in June from 115.8 in the prior month. US yields traded at fresh 2-month lows, but recovered during US trading hours, maintaining the pair afloat, with the 10-year note yield settling around 2.19% after trading as low as 2.17%. The short term picture for the pair is neutral, given that in the 4 hours chart, the price remains well below its 100 and 200 SMAs, both maintaining their bearish slopes, while technical indicators head nowhere around their mid-lines. Nevertheless, the risk remains towards the downside, with another attempt of breaking below 108.80 probably resulting in a test of the year low set last April at 108.12.
Support levels: 108.80 108.45 108.10
Resistance levels: 109.60 110.00 110.45
GBP/USD
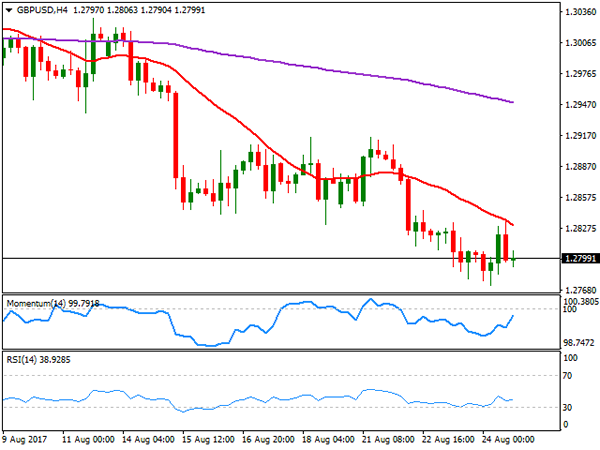
The GBP/USD settled around 1.2800 this Thursday, pretty much unchanged daily basis, despite an early attempt to regain the upside. A broadly weaker greenback helped the pair advance up to 1.2836, but the pair was once again rejected by selling interest around the 1.2830 region. The UK Q2 GDP revision came in unchanged at 0.3%, but consumer spending and business total business investment during the same period fell strongly, with the first up by 0.1% in the quarter, and the second standing at 0.0%. Furthermore, the CBI Distributive Trades Survey indicated a major slide in the volume of sales in August, from previous 22% to -10%, a worrisome picture for the UK economic future. The 4 hours chart for the pair shows that the early advance was contained by a bearish 20 SMA, while technical indicators in the mentioned chart have recovered from oversold territory, but remain below their mid-lines, limiting the upward potential of the pair. Given that the pair has set a lower low for the week, this time at 1.2773, the risk remains towards the downside, with the market still looking to test the 1.2700/20 region.
Support levels: 1.2770 1.2725 1.2690
Resistance levels: 1.2835 1.2870 1.2920
GOLD
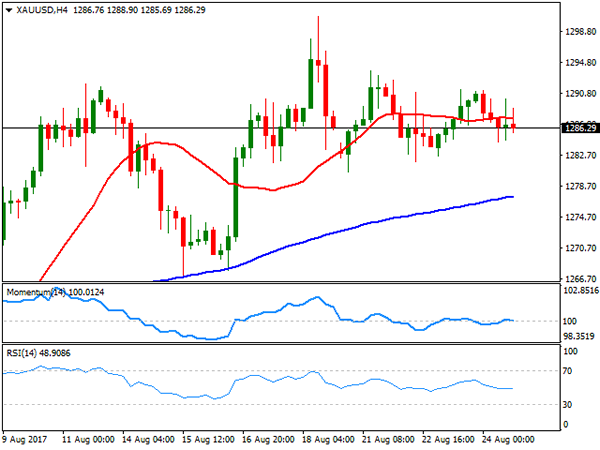
Spot gold remained within its early week range, ending this Thursday with modest losses at $1,286.29 a troy ounce. The commodity has been struggling for direction ever since the week started, as investors wait for clues from Jackson Hole’s key speeches from Fed’s Yellen and ECB’s Draghi. Nevertheless, the commodity remains near the yearly high set August at 1,300.72, underpinned by US political jitters. The daily chart shows that the intraday trading range has been shrinking since the beginning of the week, resulting in technical indicators losing their upward momentum, but anyway holding well above their mid-lines, as the price holds far below a still bullish 20 DMA, all of which indicates that selling interest is well limited. Shorter term, the 4 hours chart maintains a neutral stance, with the price settling a few pips below a horizontal 20 SMA, the Momentum indicator heading nowhere around its 100 level, and the RSI heading modestly lower around 47. The weekly low has been set at 1,280.56, now the immediate support, with a break below it exposing the metal to a deeper correction, towards the 1,274.00 region first, but towards 1,260.00 later.
Support levels: 1,280.55 1,273.95 1,261.20
Resistance levels: 1,293.70 1,300.90 1,309.25
WTI CRUDE OIL
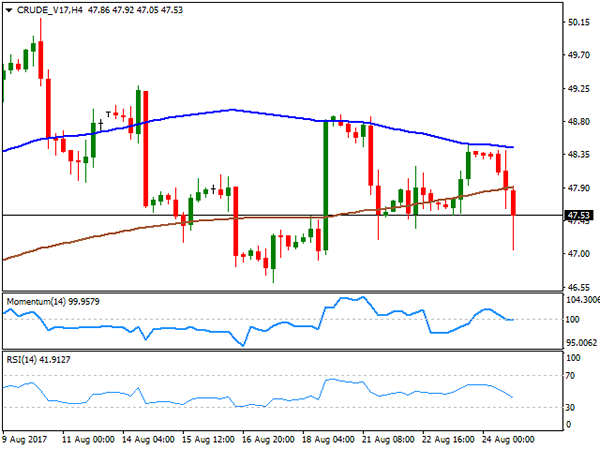
Crude oil prices plunged this Thursday, with West Texas Intermediate futures settling at $47.52 a barrel after printing a fresh weekly low of 47.05. There was no clear catalyst for this late slump, but seems speculative interest has taken profits out from the recent advance, still wary about the market’s conditions and ahead of key events later this week. The fact that, despite US stockpiles keep shrinking, US production remains at its highest in over two years, helps keeping oil prices subdued. The commodity is at risk of falling further, although would need to extend its slide below the mentioned daily low to confirm a bearish extension, as in the daily chart, the price managed to settle above a marginally bearish 100 SMA, whilst technical indicators present modest bearish slopes within negative territory, but above previous weekly lows. In the 4 hours chart, the price settled below its moving averages, whilst technical indicators entered bearish territory, now with limited downward strength, but also favoring a bearish extension for this Friday.
Support levels: 47.05 46.60 46.00
Resistance levels: 47.90 48.50 49.10
DJIA
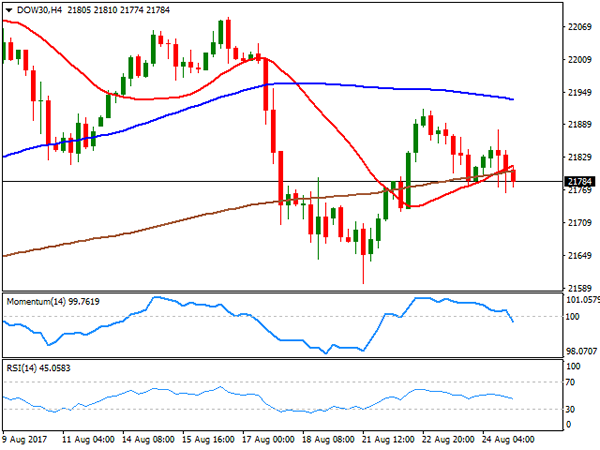
Following Wednesday’s advance, Wall Street resumed its decline this Thursday, with all of the three major indexes closing in the red. The Dow Jones Industrial Average opened 40 points higher on improved results from retail sales, but ended the day 28 points lower at 21,783.40. The Nasdaq Composite shed 7 points, to settle at 6,271.33, while the S&P closed at 2,438.97, down 5 points or 0.21%. Grocery stocks plunged after Amazon vowed to cut Whole Foods prices after purchasing the company for $13.7 billion. As it happened across the financial world, trading was limited to tight intraday ranges, as investors wait for Draghi and Yellen’s speeches to take place this Friday in the US afternoon. Cisco System was the best performer, up 1.02%, while Merck added 0.84%. Wal-Mart led decliners, shedding 2.13%, followed by United Technologies that shed 1.58%. For the Dow, the daily chart shows that early gains were contained by a modestly bearish 20 DMA, whilst technical indicators have lost directional strength, but hold within negative territory. In the same chart, the index is far above bullish 100 and 200 DMAs, leaving the latest retracement from record highs as barely corrective. In the 4 hours chart, the index settled below all of its moving averages, whilst technical indicators entered bearish territory with strong bearish slopes, but limited momentum, favoring a bearish extension particularly on a break below the daily low of 21,764.
Support levels: 21,764 21,725 21,672
Resistance levels: 21,814 21,850 21,892
FTSE100
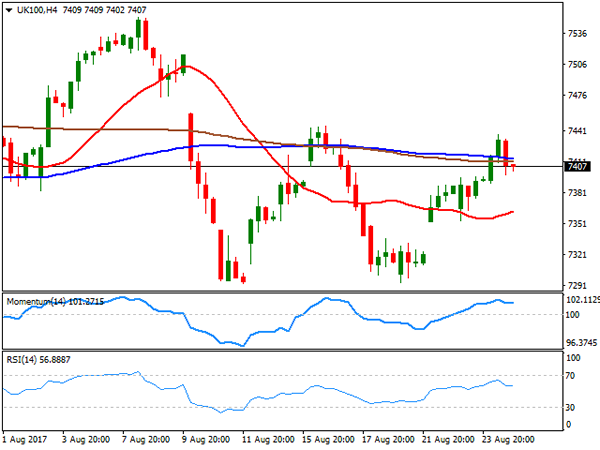
The FTSE 100 gained 24 points or 0.33% to end the day at 7,407.06, help by a continued recovery in Provident Financial, as the share added 13.16% following a similar advance on Wednesday, but after plummeting over 66% the day before. Lackluster UK data released early London kept the upside limited in the index, which traded as high as 7,438 intraday. EasyJet was the worst performer, ending the day 4.41% lower, followed by Whitbread that lost 2.60%. The daily chart for the index shows that it still trapped around its 20 and 100 DMAs converging horizontally within a tight range, while the Momentum indicator maintains its bearish slope within negative territory as the RSI consolidates around 50, all of which limits chances of a steeper advance. In the 4 hours chart, however, the index presents a more constructive outlook, having set well above its 20 SMA that gains upward strength, whilst technical indicators aim to regain the upside well above their mid-lines and after correcting oversold conditions.
Support levels: 7.396 7,353 7,309
Resistance levels: 7,444 7,482 7,533
DAX
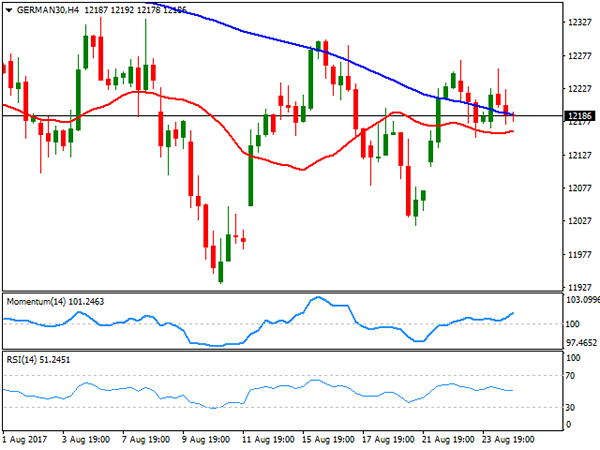
European indexes managed to close the day in the green, with the German DAX adding 6 points to 12,180.83, backed by an advance in the automotive sector. Trading, however, was choppy as investors were in cautious mode ahead of Friday’s central bankers speeches. Within the German benchmark, Daimler was the best performer, ending the day up 1,23%, followed by Fresenius, which added 1.10%. On the negative side, Commerzbank was the worst performer, shedding 0.92%, and followed by ProSiebenSat.1 Media, which lost 0.88%. The daily chart for the index retains the negative tone seen on Wednesday, as the benchmark is barely holding above a horizontal 20 DMA and trapped between the larger ones, whilst technical indicators present modest bearish slopes within neutral territory. In the 4 hours chart, technical outlook is neutral, as the index is hovering around its 20 and 100 SMAs, both with bearish slopes but quite close to each other, the RSI indicator heads lower around its 50 level, whilst the Momentum indicator diverges higher within bullish territory.
Support levels: 12,153 12,110 12,065
Resistance levels: 12,222 12,263 12,301