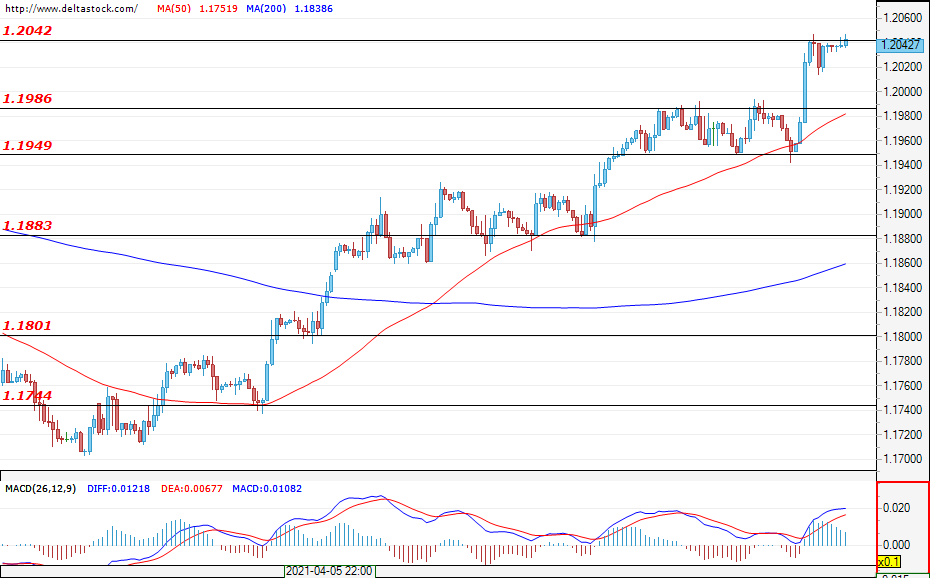
EUR/USD
Current level – 1.2042
The USD continues to lose ground and, yesterday, the pair managed to breach the local resistance at 1.1986. The rally is ramping up in speed and will likely continue, with the first target being found at 1.2100, followed by the levels of 1.2180 and 1.2340. The resistance around the current level of 1.2042 is coming from the higher time frames and the market could enter a pullback or a consolidation phase before restoring its upward momentum. Price action does not seem to be hindered by the formation of a channel or a range, so any pullbacks should remain limited above the support zone between 1.1950 and 1.1986.
| Resistance | Support | ||
| intraday | intraweek | intraday | intraweek |
| 1.2040 | 1.2180 | 1.1986 | 1.1880 |
| 1.2100 | 1.2340 | 1.1950 | 1.1800 |
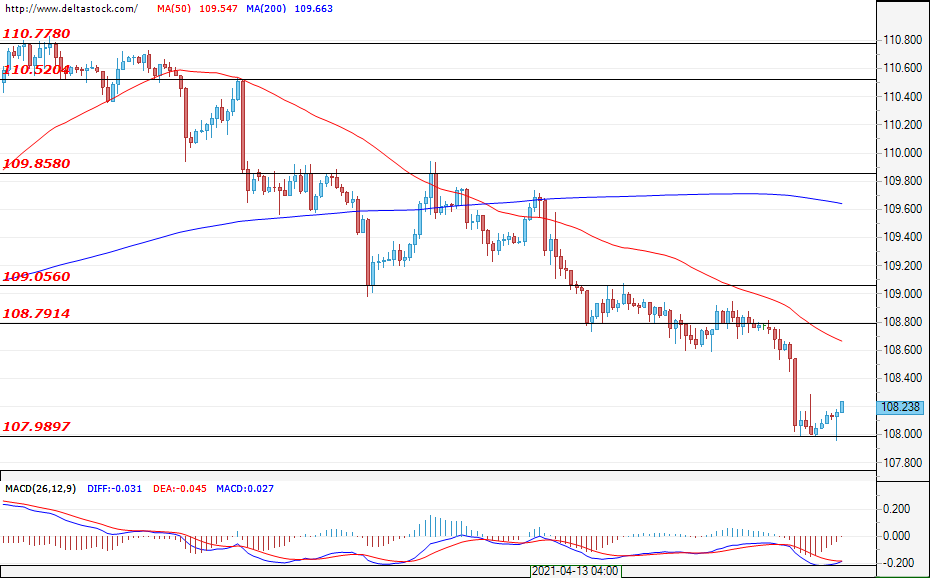
USD/JPY
Current level – 108.23
The downtrend is developing in line with expectations and the bears are testing the support at 108.00. It’s possible that this zone will persuade the bulls to return to the market, who would then charge the resistance at 108.80. The major uptrend from the higher time frames is still intact. However, if the U.S. dollar continues to lose ground, bears might ramp things up and charge the support at 106.20. Should the bulls fail to keep prices above 108.80, the chances for a reversal and steeper sell-offs would go up.
| Resistance | Support | ||
| intraday | intraweek | intraday | intraweek |
| 108.81 | 109.85 | 108.00 | 106.20 |
| 109.05 | 110.52 | 106.20 | 104.90 |
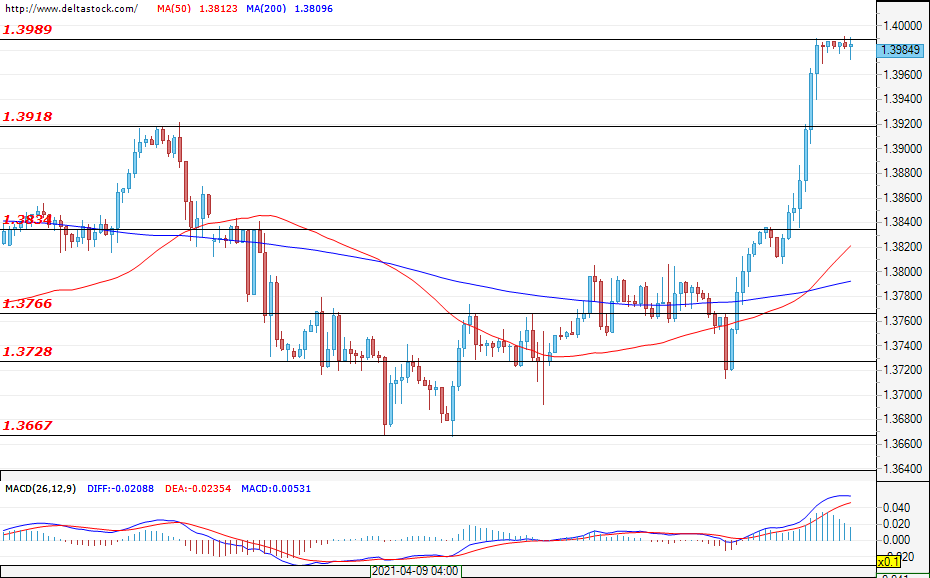
GBP/USD
Current level – 1.3984
The aggressiveness and the speed of the rally surpassed expectations and, at the time of writing, the pair is testing the resistance at 1.3990. It’s possible for the Cable to test the breach zone at around 1.3920. It looks like the retracement from the higher time frames is finally over, and the GBP/USD could continue rallying towards the resistance at 1.4140. Today’s news about the unemployment rate and the average earnings in the UK (06:00 GMT) could spark more market activity in the beginning of the day.
| Resistance | Support | ||
| intraday | intraweek | intraday | intraweek |
| 1.3990 | 1.4140 | 1.3920 | 1.3760 |
| 1.4140 | 1.4300 | 1.3834 | 1.3670 |