- EUR/USD has made another bullish bounce at the 21 ema zone after breaking the resistance trend line. Price action, however, is reaching a critical resistance.
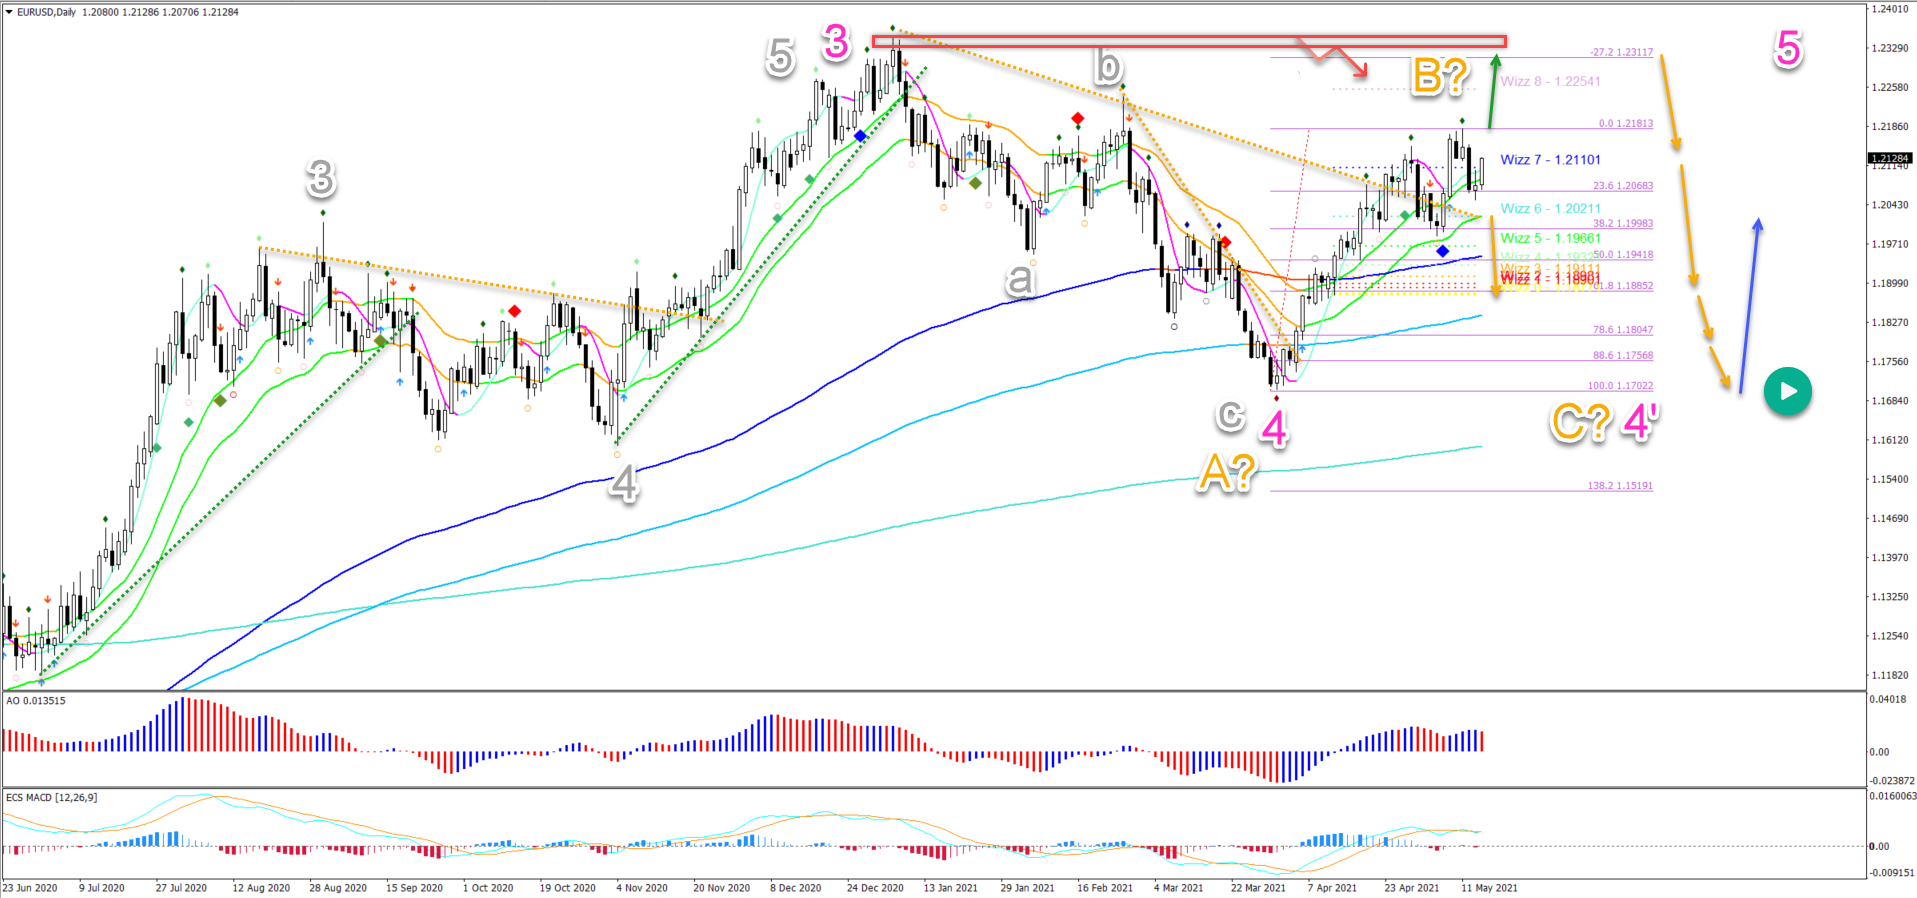
- The EUR/USD is expected to build a larger ABC (orange) pattern in wave 4’ (pink). But bearish reversal needs to occur at or below the previous top.
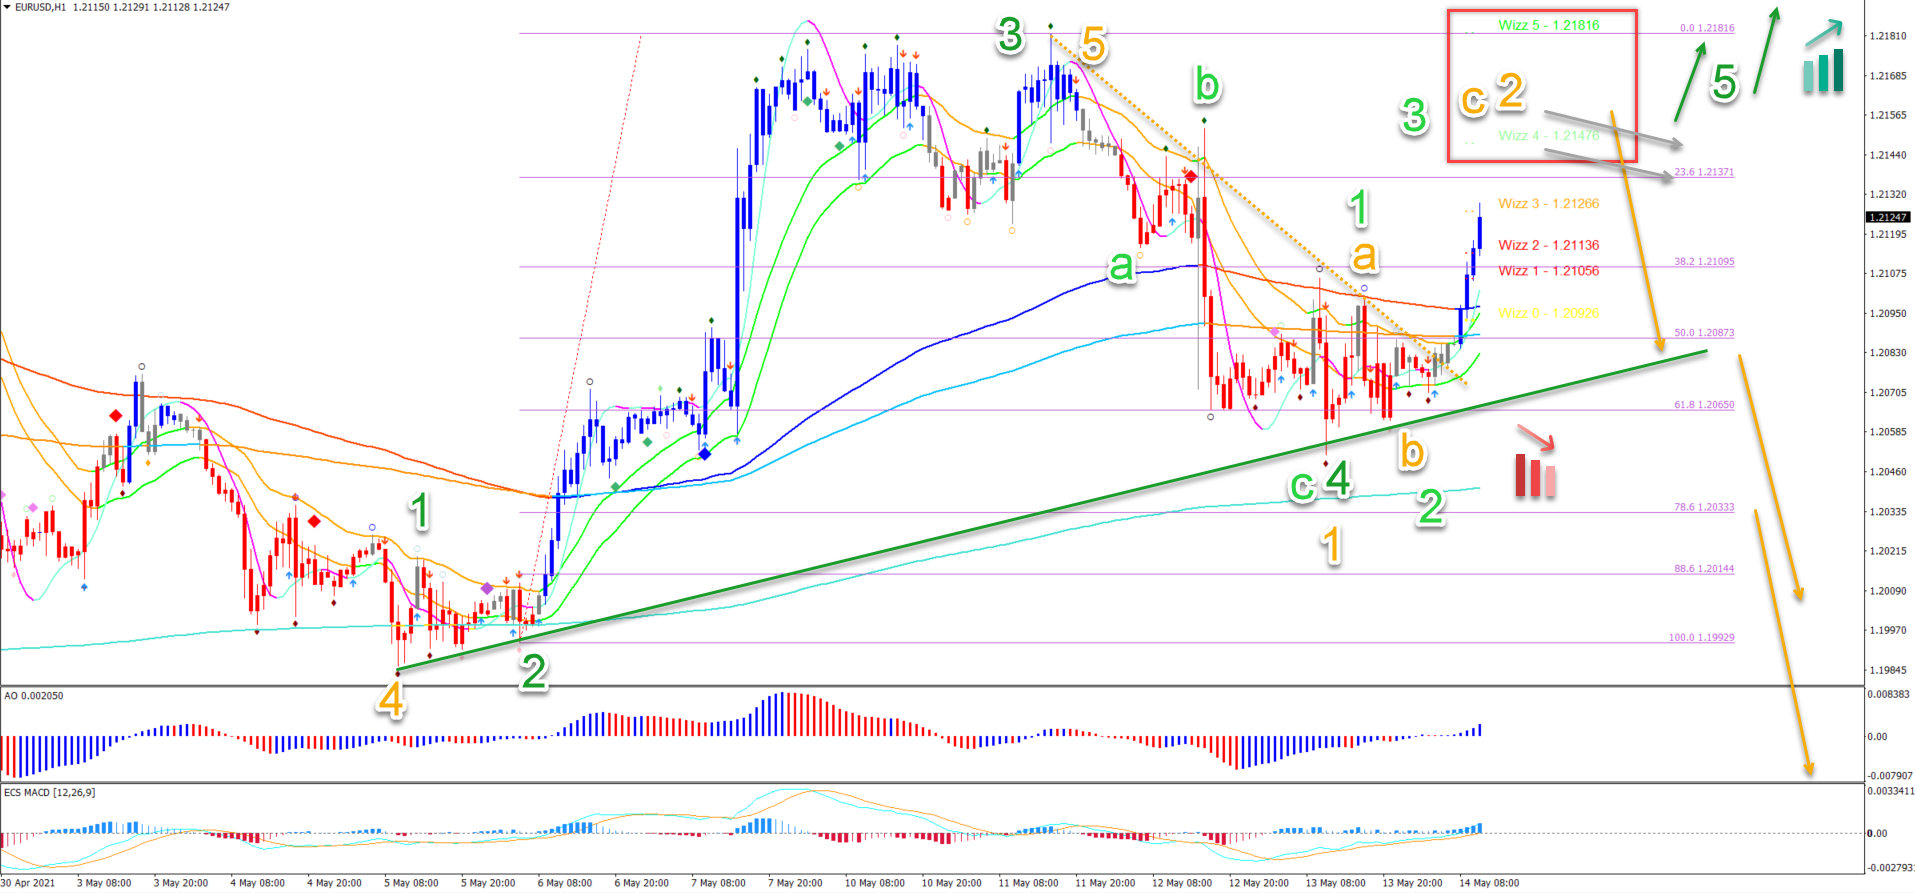
- On the 1 hour chart, we are showing two variations with the bullish scenario in green and the bearish outlook in orange.
The EUR/USD has made another bullish bounce at the 21 ema zone after breaking the resistance trend line (dotted orange). Price action, however, is reaching a critical resistance zone.
This wave analysis will therefore show both bullish and bearish scenarios depending on how price responds to support and resistance levels.
Price charts and technical analysis
The EUR/USD is expected to build a larger ABC (orange) pattern in wave 4’ (pink). But bearish reversal needs to occur at or below the previous top. Otherwise, the first bearish ABC (grey) could already have completed wave 4 (pink):
- A break above the top indicates another bullish swing (green arrow).
- The main target of the bullish breakout is the previous top (red box).
- A bearish bounce (orange arrows) at the previous top could indicate wave C (orange) in wave 4’ (pink).
- A lack of a bearish bounce indicates more uptrend and a simple ABC (grey) in wave 4 (pink).
- A bearish breakout below the 21 ema zone could indicate more downside (orange arrow).
On the 1 hour chart, we are showing two variations with the bullish scenario in green and the bearish outlook in orange:
- The bullish scenario is possible with a wave 4 bouncing at the deep 61.8% Fibonacci retracement level. Although the deep bounce is unusual, the bullish wave 4-5 is not invalidated.
- A bull flag chart pattern (grey arrows) at the resistance (red box) could help confirm the breakout higher (green arrows).
- A strong bearish bounce (orange arrow) at the resistance (red box) could indicate more downside and that the bearish scenario is valid.
- A bearish breakout (orange arrows) below the support trend line (green) could confirm that price action completed wave 5 (orange).
- A bearish scenario indicates a wave 1-2 (orange).