
The EUR/USD currency pair
Technical indicators of the currency pair:
Prev Open: 1.1926
Prev Close: 1.1896
% chg. over the last day: -0.25%
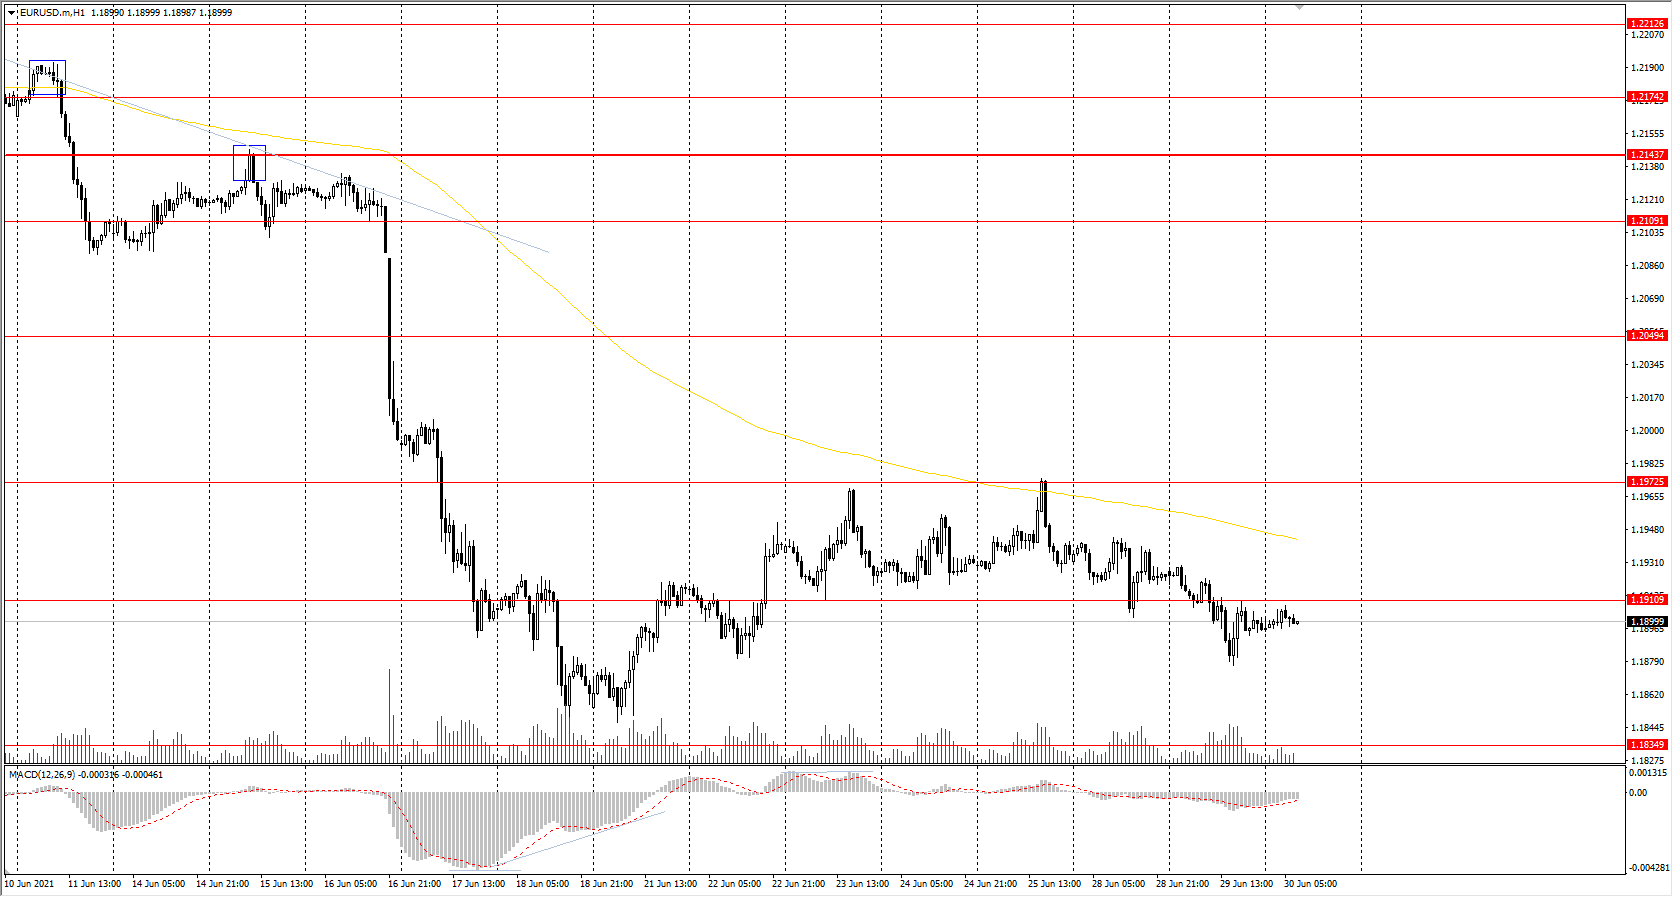
The situation with the EUR/USD currency pair remains mixed, with a slight advantage in favor of the euro. The consumer price index data will be published in Europe today. This is the most important indicator of inflation. If the data is worse than expected, it may negatively impact the European currency and lead to a decrease in the EUR/USD quotes.
Trading recommendations
Support levels: 1.1835, 1.1809
Resistance levels: 1.1911, 1.1973, 1.2002, 1.2050, 1.2109, 1.2144, 1.2174, 1.2212
The trend is still bearish, with sellers’ pressure gaining strength again. The price managed to break down through the support level of 1.1911. The MACD indicator is inactive. Under such market conditions, traders are better to look for sell trades from resistance levels. There is no optimal entry point for long positions on the H1 timeframe now.
Alternative scenario: if the price breaks out through the 1.2144 resistance level and fixes above, the general uptrend is likely to resume.
News feed for 2021.06.30:
- German Unemployment Rate (m/m) at 10:55 (GMT+3);
- Eurozone Consumer Price Index (m/m) at 12:00 (GMT+3);
- US ADP Non-Farm Employment Change at 15:15 (GMT+3);
- US Chicago PMI (m/m) at 16:45 (GMT+3);
- US Pending Home Sales (m/m) at 17:00 (GMT+3).
The GBP/USD currency pair
Technical indicators of the currency pair:
Prev Open: 1.3879
Prev Close: 1.3841
% chg. over the last day: -0.27%
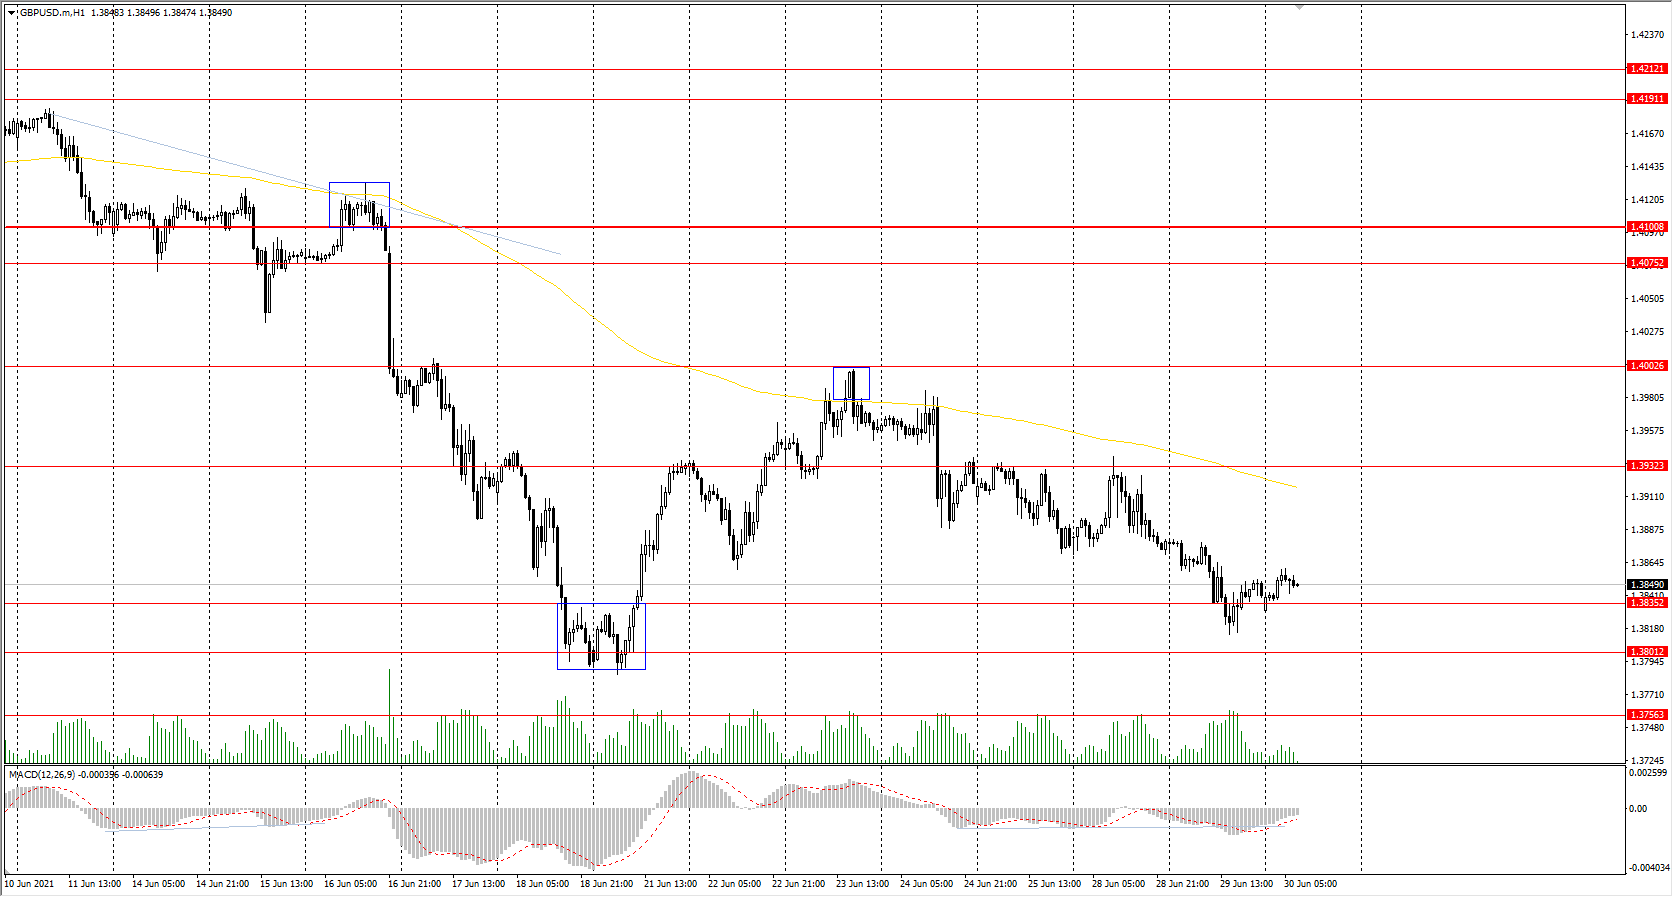
The fundamental picture in the UK has not changed. Coronavirus restrictions in the United Kingdom are still holding back business activity in various sectors of the economy. Given that the dollar index remains unchanged, the situation is not in favor of the British pound. The quarterly GDP data is expected today.
Trading recommendations
Support levels: 1.3835, 1.3801, 1.3767
Resistance levels: 1.3931, 1.4002, 1.4075, 1.4101, 1.4138, 1.4191
The GBP/USD trend is bearish on the H1 timeframe. The price is trading near the moving average, while the MACD indicator is inactive again. Under such market conditions, traders are better to look for both sell trades from the resistance levels and buy trades from the support levels on the intraday timeframes.
Alternative scenario: if the price breaks out through the 1.4101 resistance level and consolidates above, the bearish scenario is likely to be canceled.
News feed for 2021.06.30:
- UK GDP (q/q) at 09:00 (GMT+3).
The USD/JPY currency pair
Technical indicators of the currency pair:
Prev Open: 110.63
Prev Close: 110.54
% chg. over the last day: -0.08%
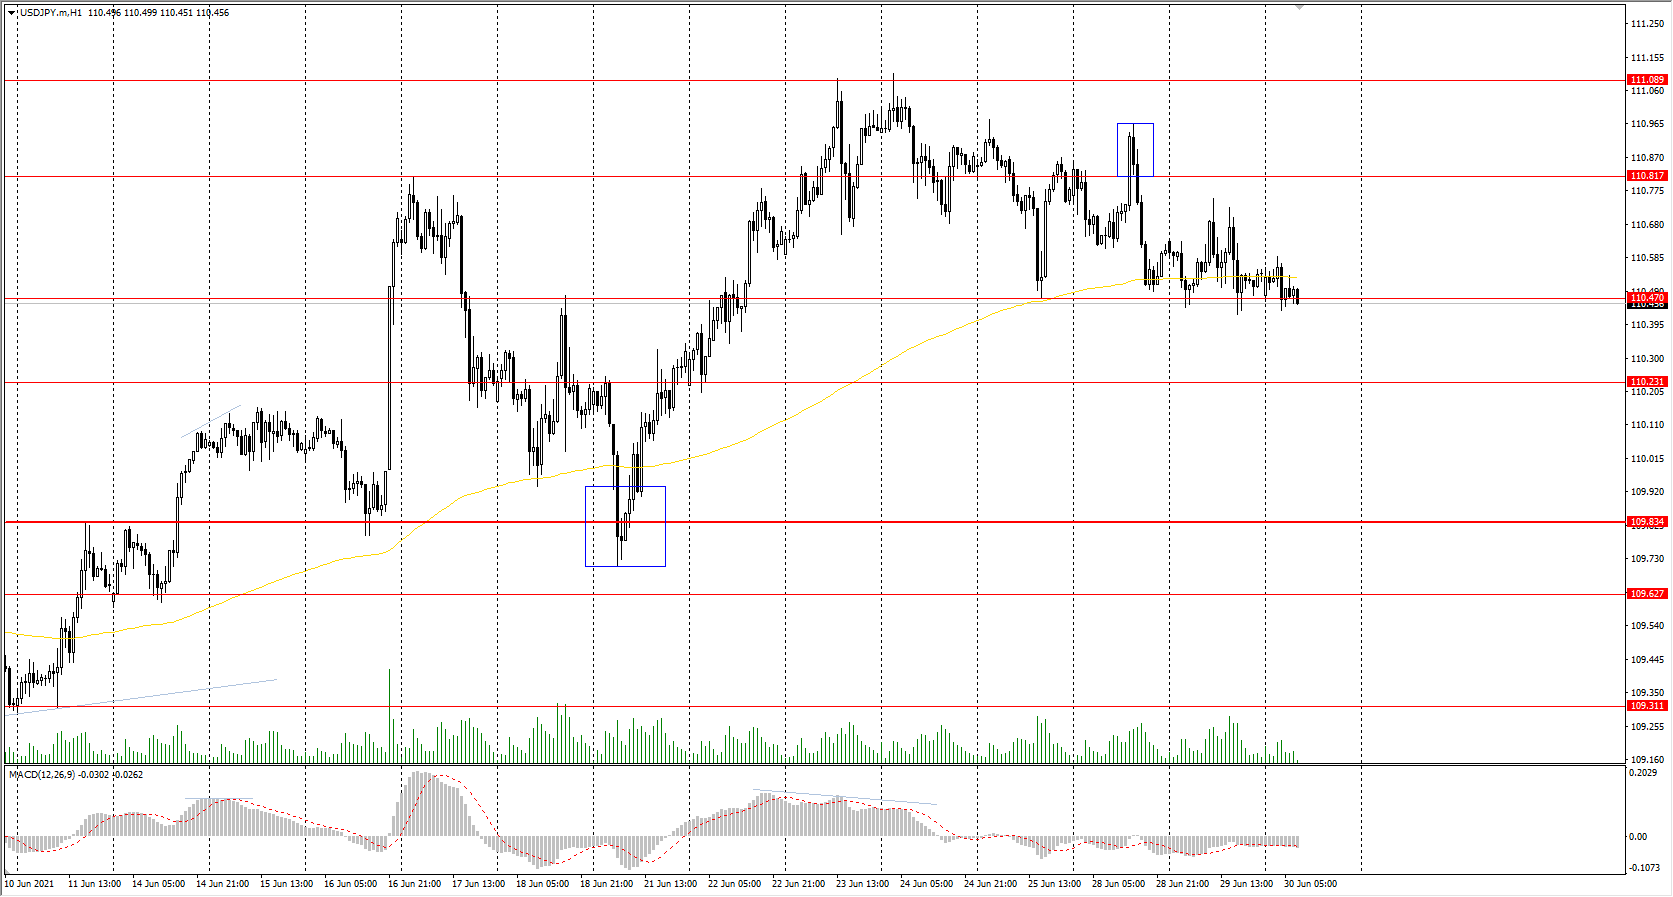
The USD/JPY currency pair is trading in a narrow price range ahead of the support level of 110.47. Such price behavior usually occurs before a breakdown. The fundamental background remains mixed, as both the dollar index and the Japanese yen show weakness.
Trading recommendations
Support levels: 110.47, 110.23, 109.83, 109.62, 109.31
Resistance levels: 110.82, 111.09, 111.48
The trend remains bullish. The price is trading at the moving average level, and the MACD indicator is in the negative zone. Under such market conditions, traders are better to look for buy trades from support levels, but only after the buyers’ initiative appears. Sell positions can be considered on intraday timeframes after the breakdown of the 110.47 support level.
Alternative scenario: if the price falls below 109.83, the general downtrend is likely to resume.
The USD/CAD currency pair
Technical indicators of the currency pair:
Prev Open: 1.2331
Prev Close: 1.2400
% chg. over the last day: +0.56%
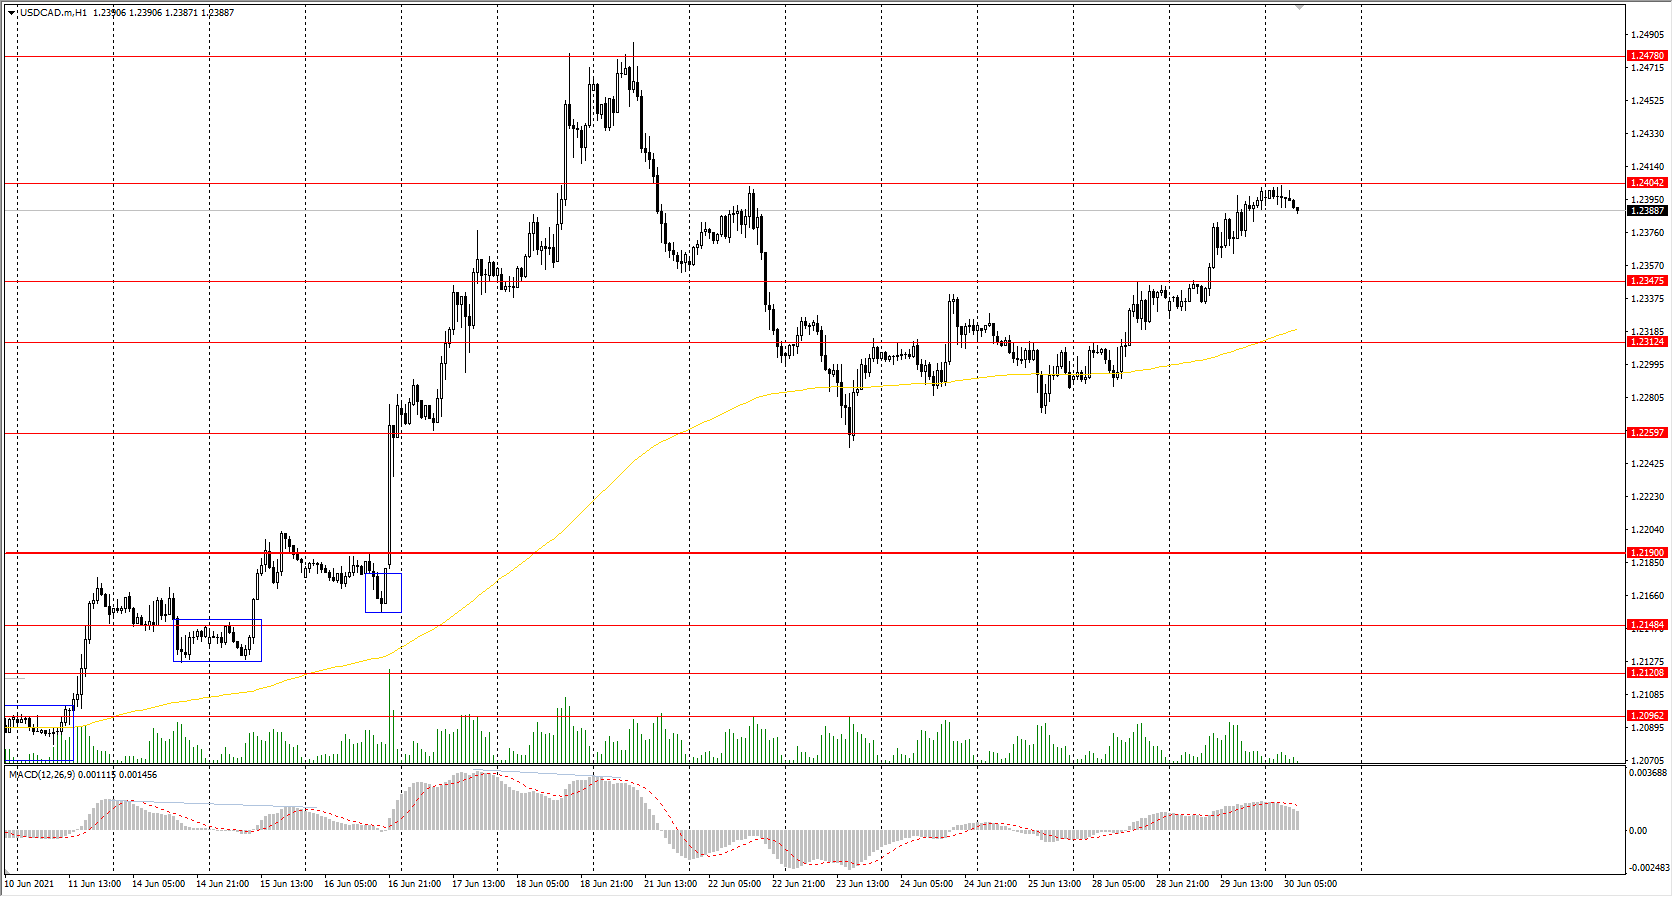
The USD/CAD currency pair is slowly but steadily growing. The Canadian dollar is a commodity currency and correlates with oil prices. Oil prices corrected for the last 2 days, which led to a slight weakening of the Canadian currency. The price has reached the resistance level of 1.2404, so a pullback is possible.
Trading recommendations
Support levels: 1.2347, 1.2312, 1.2251, 1.2190, 1,2148 1.2121, 1.2096
Resistance levels: 1.2404, 1.2478, 1.2519
Technically, the trend remains bullish. The price is trading above the moving average, and the MACD indicator is in the positive zone with no signs of reversal. Under such market conditions, it is best to trade on the lower timeframes. Buyers may look for buy trades from support levels. Traders can look for entry points on intraday timeframes for sell positions, but only with short targets because it is trading against the trend.
Alternative scenario: if the price breaks down through the 1.2190 support level and fixes below, the downtrend is likely to be resumed.
News feed for 2021.06.30:
- Canada GDP (m/m) at 15:30 (GMT+3).


