
- Gold retains sideways move in 4-hour chart
- MACD and RSI look weak
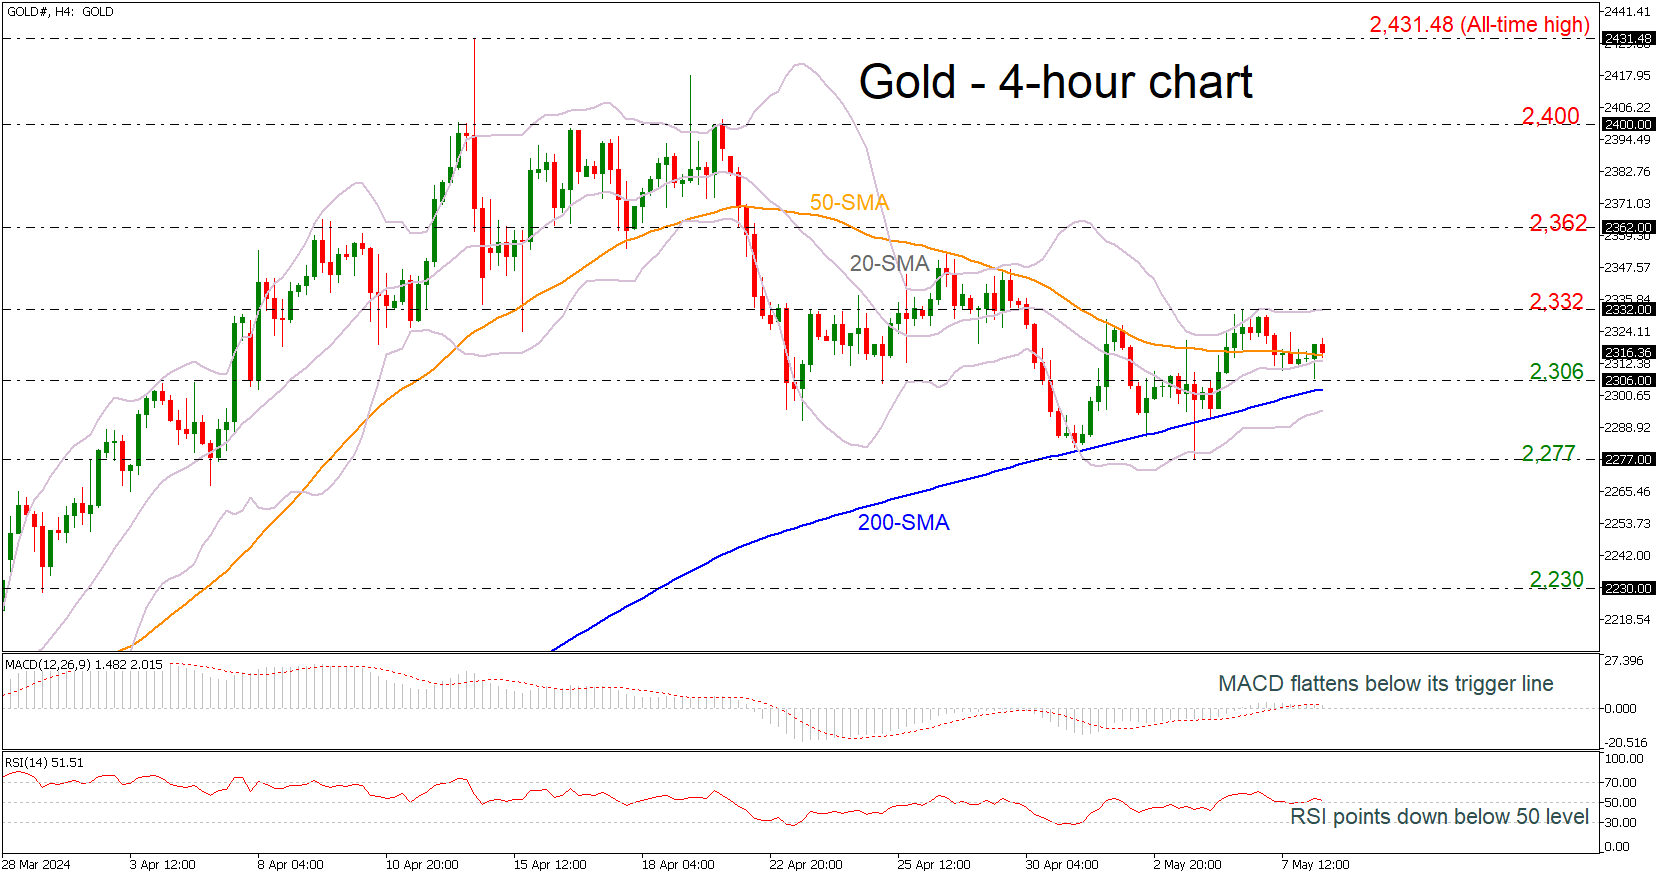
Gold prices are holding near the 50-period simple moving average (SMA) and the mid-level of the Bollinger band, trading within a sideways channel of 2,277-2,332 in the 4-hour chart.
According to technical oscillators, the MACD is losing momentum beneath its trigger line in the positive territory, while the RSI is ticking down, meeting the neutral threshold of 50. Both reflect the weakening momentum in the price.
Upside moves are likely to find resistance at the upper Bollinger band at 2,332. There is also an important resistance level around 2,362, taken from the inside swing low of April 16 ahead of the 2,400 psychological number.
In the event of a downside reversal, the commodity may meet the 2,306 immediate support ahead of the 200-period SMA at 2,302 and the lower Bollinger band at 2,294. Steeper decreases could take the market towards the support line of the consolidation area near 2,277.
Summarizing, the precious metal is failing to improve the bullish structure in the short-term view, although an exit above the upper Bollinger band could endorse an upside tendency.


 and the mid-level of the Bollinger band, trading within a sideways channel of 2,277-2,332 in the 4-hour chart. )