
The EUR/USD currency pair
Technical indicators of the currency pair:
Prev Open: 1.1856
Prev Close: 1.1849
% chg. over the last day: -0.06%
The manufacturing PMI data was published yesterday. There were no surprises, no significant changes compared to the previous month. The economic climate in Europe is improving; the only question is whether Europe manages to avoid outbreaks of the new strain of Coronavirus, Delta, or not.
Trading recommendations
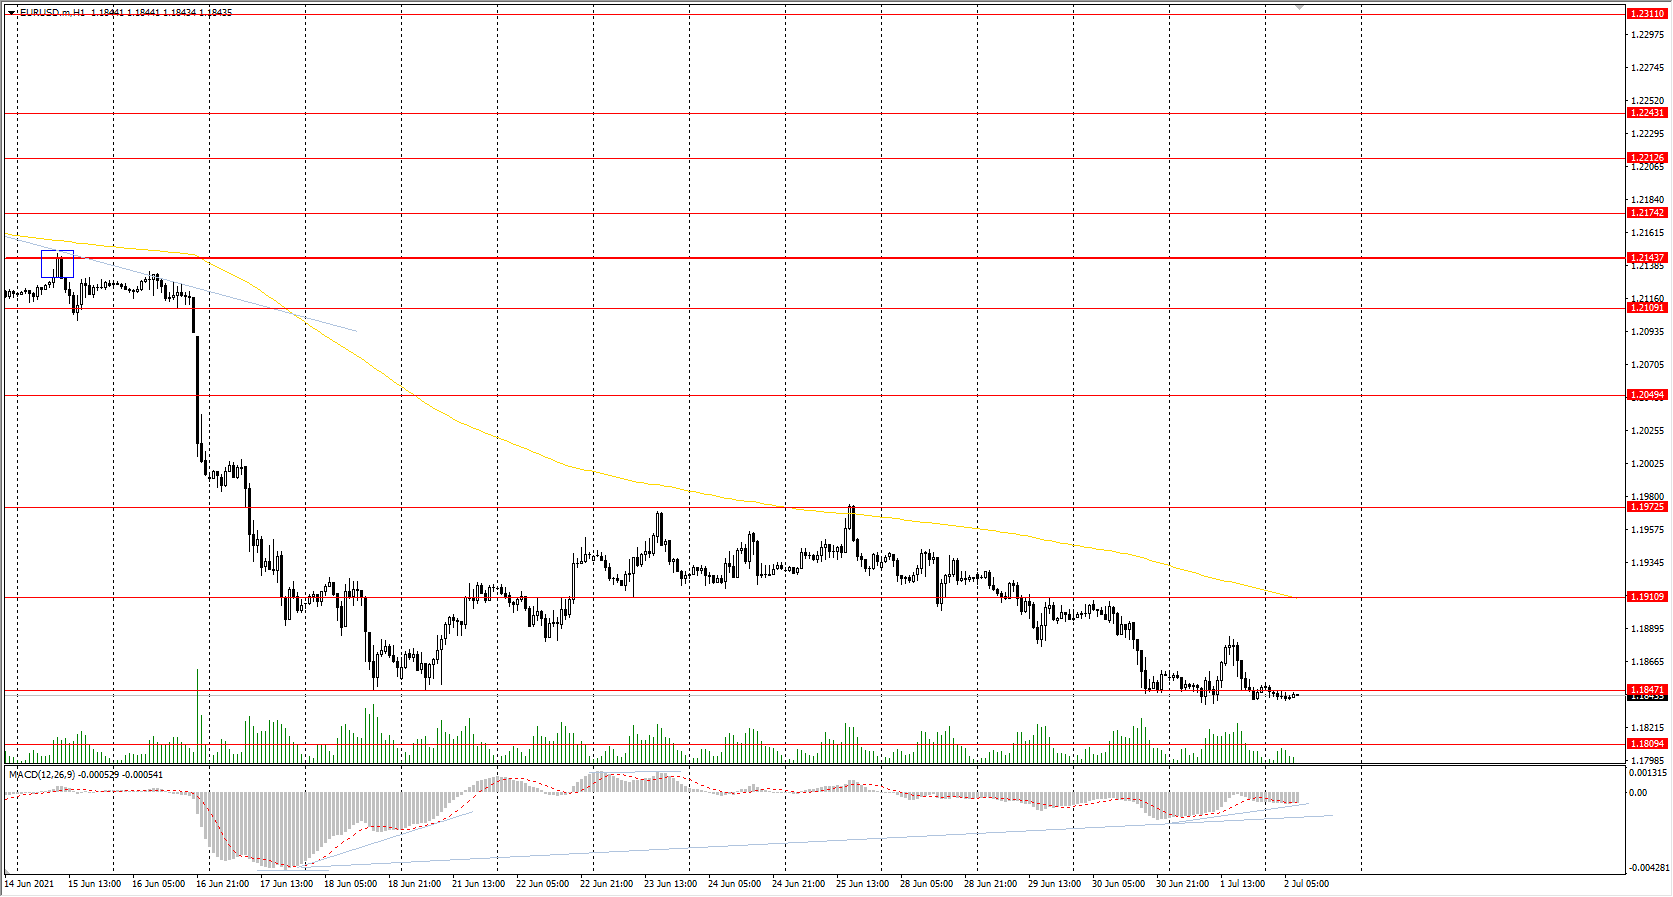
Support levels: 1.1847, 1.1809
Resistance levels: 1.1911, 1.1973, 1.2002, 1.2050, 1.2109, 1.2144, 1.2174, 1.2212
The trend is still bearish. The price is traded near the support level of 1.1847. There is still no initiative from buyers. The first signs of divergence have appeared on the MACD indicator, on several timeframes, so the downside potential is limited. Under such market conditions, traders are better to look for both sell trades from the resistance levels and buy trades from the support levels, but only on intraday timeframes.
Alternative scenario: if the price breaks out through the 1.2144 resistance level and fixes above, the general uptrend is likely to resume.
News feed for 2021.07.02:
- ECB President Christine Lagarde Speaks at 15:30 (GMT+3);
- US Nonfarm Payrolls (m/m) at 15:30 (GMT+3);
- US Unemployment Rate (m/m) at 15:30 (GMT+3).
The GBP/USD currency pair
Technical indicators of the currency pair:
Prev Open: 1.3826
Prev Close: 1.3762
% chg. over the last day: -0.46%
In the United Kingdom, the growth rate of the Manufacturing PMI index is slowing down. Coronavirus restrictions continue to have a strong impact on economic indicators. The situation is still not improving significantly, so many economists believe that British Prime Minister Boris Johnson may postpone the opening of the economy for another month.
Trading recommendations
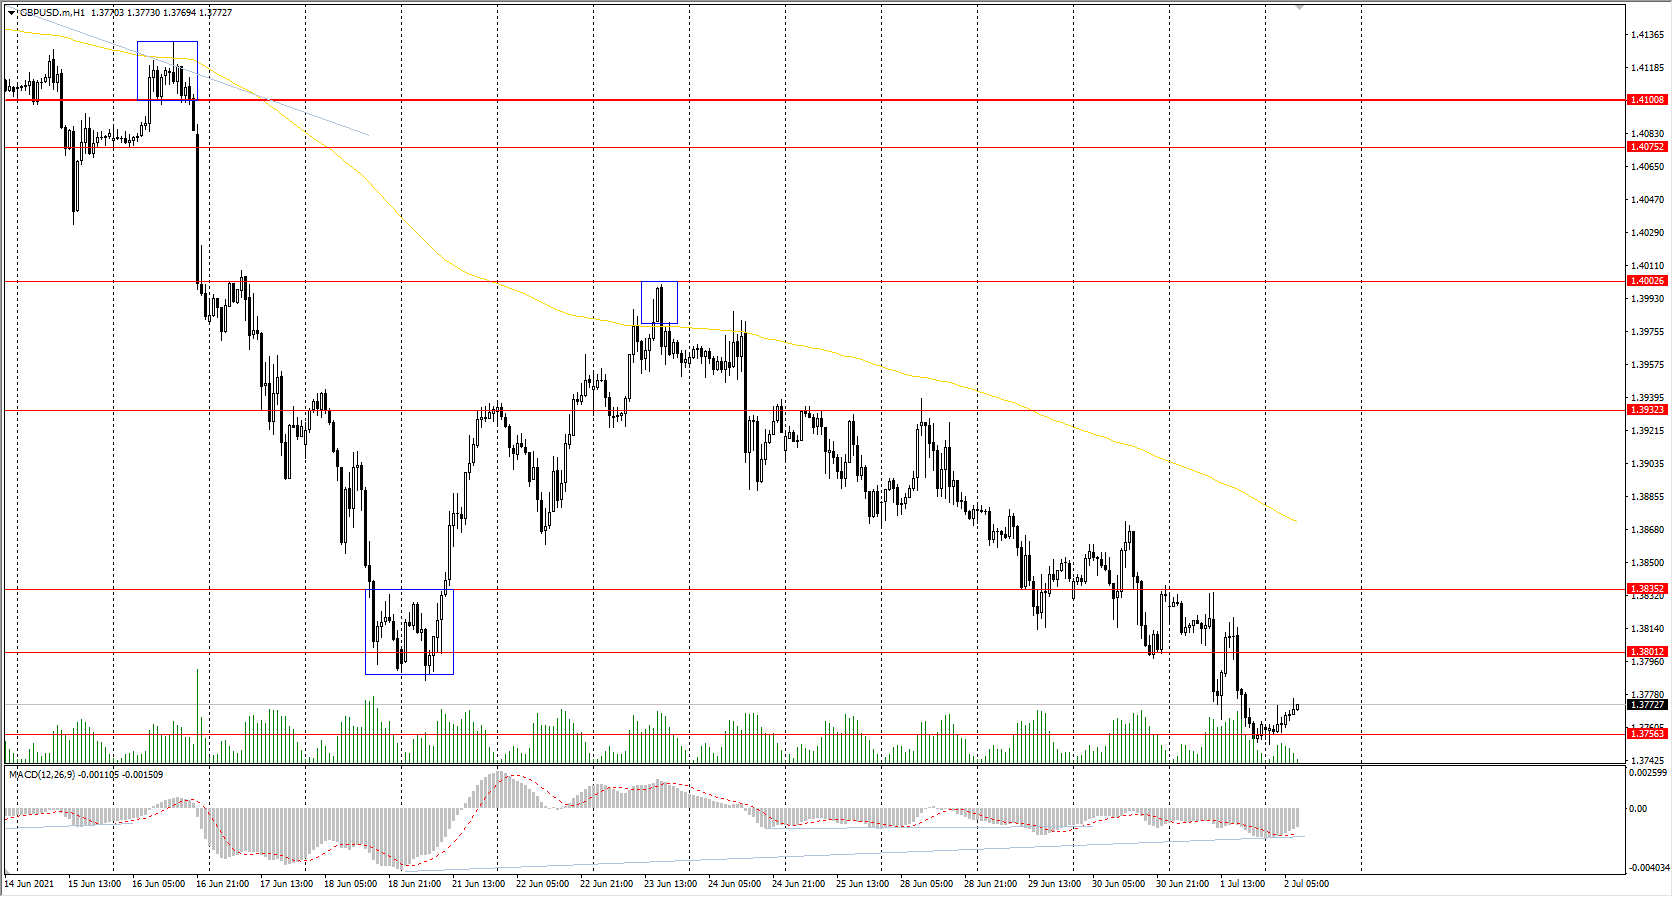
Support levels: 1.3767
Resistance levels: 1.3801, 1.3931, 1.4002, 1.4075, 1.4101, 1.4138, 1.4191
The GBP/USD trend is bearish on the H1 timeframe. The price is trading below the moving average, while the MACD indicator is in the negative zone, but it shows signs of reversal. Under such market conditions, traders are better to look for both sell trades from the resistance levels and buy trades from the support levels on the intraday timeframes.
Alternative scenario: if the price breaks out through the 1.4101 resistance level and consolidates above, the bearish scenario is likely to be canceled.
News feed for 2021.07.02:
- US Nonfarm Payrolls (m/m) at 15:30 (GMT+3)
- US Unemployment Rate (m/m) at 15:30 (GMT+3).
The USD/JPY currency pair
Technical indicators of the currency pair:
Prev Open: 111.10
Prev Close: 111.52
% chg. over the last day: +0.38%
The USD/JPY currency pair continues to grow steadily. The price has reached a three-month high, and there are all preconditions for further growth up to the weekly resistance level of 112.18. There is a high direct correlation between USD/JPY and the US stock indices now.
Trading recommendations
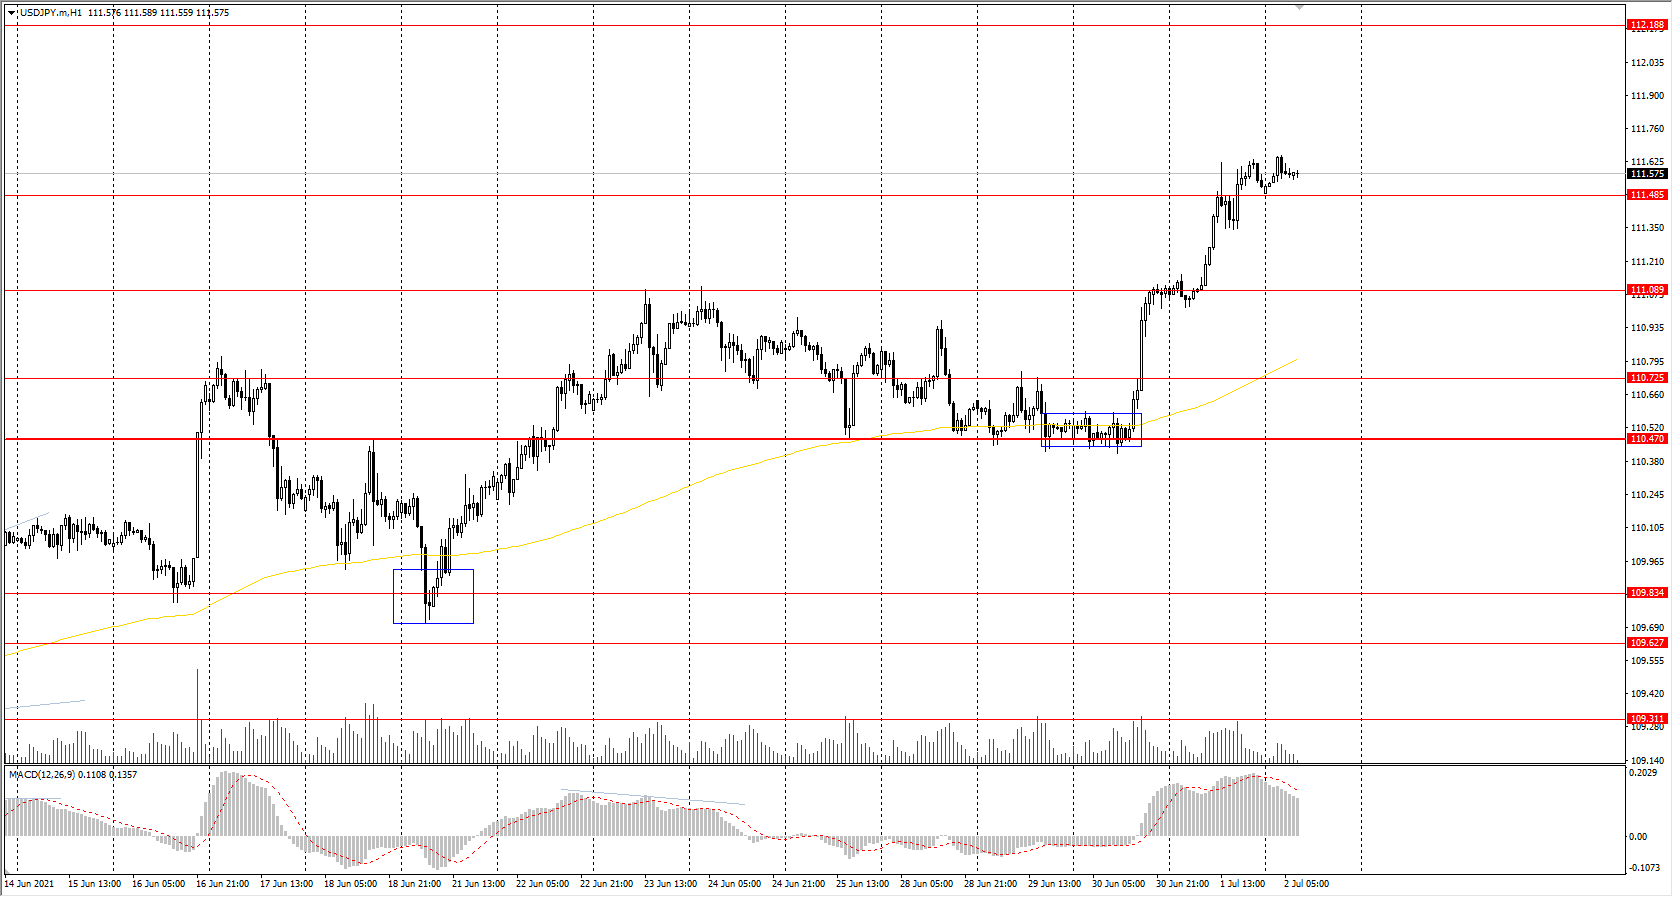
Support levels: 111.09, 111.48, 110.73, 110.47, 109.83, 109.62, 109.31
Resistance levels: 112.18
The trend remains bullish. The price is trading above the moving average. The MACD indicator is in the overbought zone, but there are first signs of divergence. Under such market conditions, traders are better to look for buy trades from support levels, but after a slight downward correction. The price has deviated strongly from the moving average and reached resistance levels, so sell positions can be considered too, but only on intraday timeframes.
Alternative scenario: if the price falls below 109.83, the general downtrend is likely to resume.
News feed for 2021.07.02:
- US Nonfarm Payrolls (m/m) at 15:30 (GMT+3);
- US Unemployment Rate (m/m) at 15:30 (GMT+3).
The USD/CAD currency pair
Technical indicators of the currency pair:
Prev Open: 1.2395
Prev Close: 1.2436
% chg. over the last day: +0.33%
The USD/CAD currency pair increased by 0.33% by the end of the day. The USD/CAD exchange rate is highly dependent on two factors: the dollar index and the oil quotes. And as long as the dollar index is rising, the price of USD/CAD will follow it. But as soon as the growth of the dollar stops on the background of rising oil prices, the USD/CAD quotes will go down sharply.
Trading recommendations
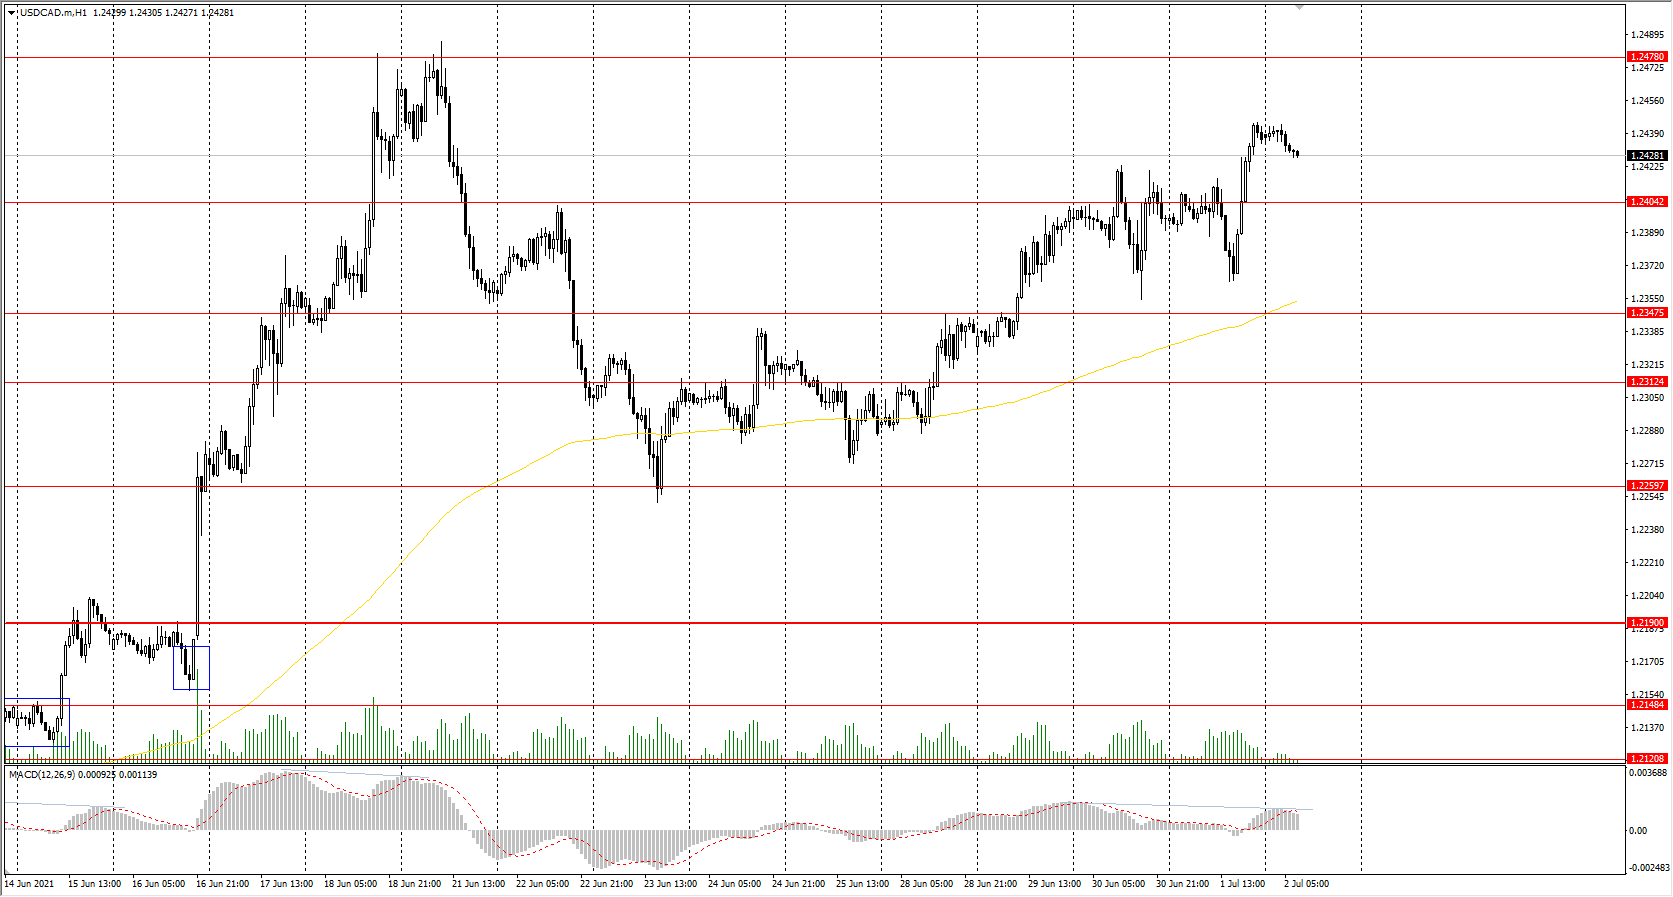
Support levels: 1.2404, 1.2347, 1.2312, 1.2251, 1.2190, 1,2148 1.2121, 1.2096
Resistance levels: 1.2478, 1.2519
Technically, the trend remains bullish. The price is trading above the moving average, and the MACD indicator is in the positive zone, but there are the first signs of divergence. Under such market conditions, it is best to trade on the lower timeframes. Buyers may look for buy trades from support levels. Traders can look for entry points on intraday timeframes for sell positions, but only with short targets because it is trading against the trend.
Alternative scenario: if the price breaks down through the 1.2190 support level and fixes below, the downtrend is likely to be resumed.
News feed for 2021.07.02:
- US Nonfarm Payrolls (m/m) at 15:30 (GMT+3);
- US Unemployment Rate (m/m) at 15:30 (GMT+3);
- Canada Manufacturing PMI (m/m) at 16:30 (GMT+3).


