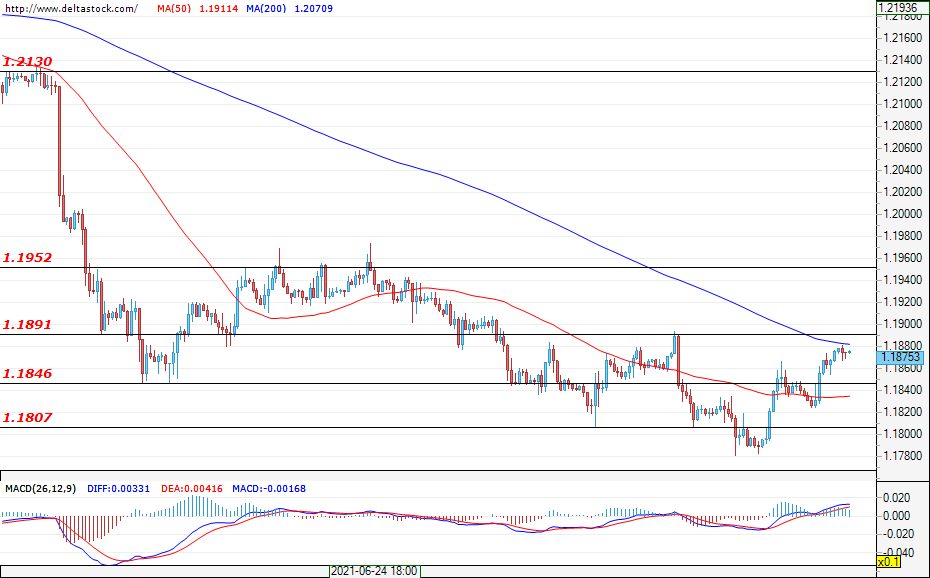
EUR/USD
Current level – 1.1875
During the last trading session for the previous week, the currency pair managed to breach and stay above the resistance level of 1.1846. At the start of the new week, the forecasts are for the pair to test and violate the next resistance level of 1.1891, which could pave the way towards the main resistance at 1.1952. In the negative direction, the first support level lies at 1.1800. This week, investors’ attention will be focused on the data on the initial jobless claims for the U.S. (Thursday; 12:30 GMT) and the CPI for the EU (Friday; 09:00 GMT).
| Resistance | Support | ||
| intraday | intraweek | intraday | intraweek |
| 1.1890 | 1.1950 | 1.1800 | 1.1750 |
| 1.1950 | 1.2130 | 1.1750 | 1.1716 |
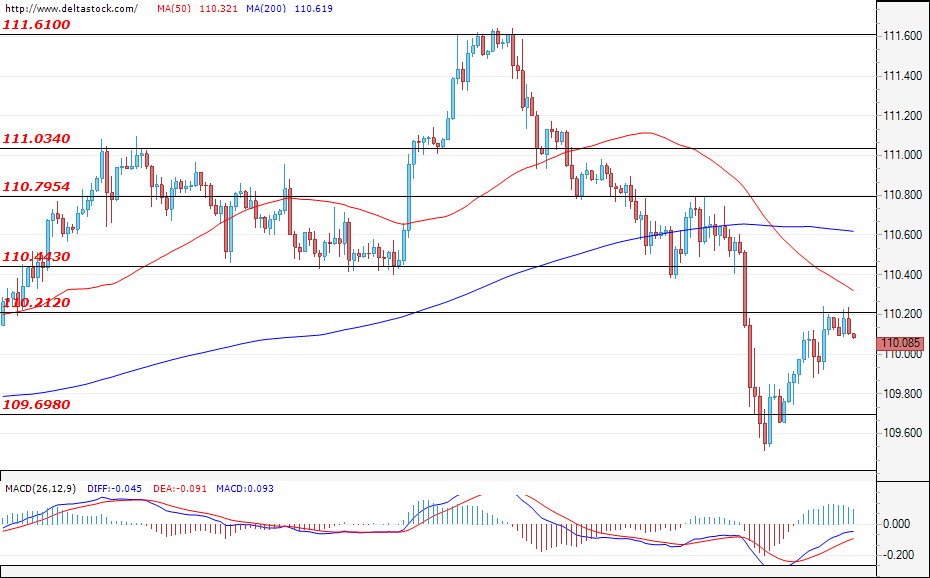
USD/JPY
Current level – 110.08
Following the strong sell-off, the currency pair found support at the level of 109.70 at the end of last week and, at the time of writing the analysis, it is found in a corrective phase. The expectations are for the pair to test the resistance level of 110.21. If the test turns out to be successful, then the next resistance level of 110.44 would probably get tested as well. In the negative direction, the first support is found at the previously mentioned level of 109.70.
| Resistance | Support | ||
| intraday | intraweek | intraday | intraweek |
| 110.21 | 110.79 | 109.70 | 108.50 |
| 110.44 | 111.03 | 109.00 | 107.50 |
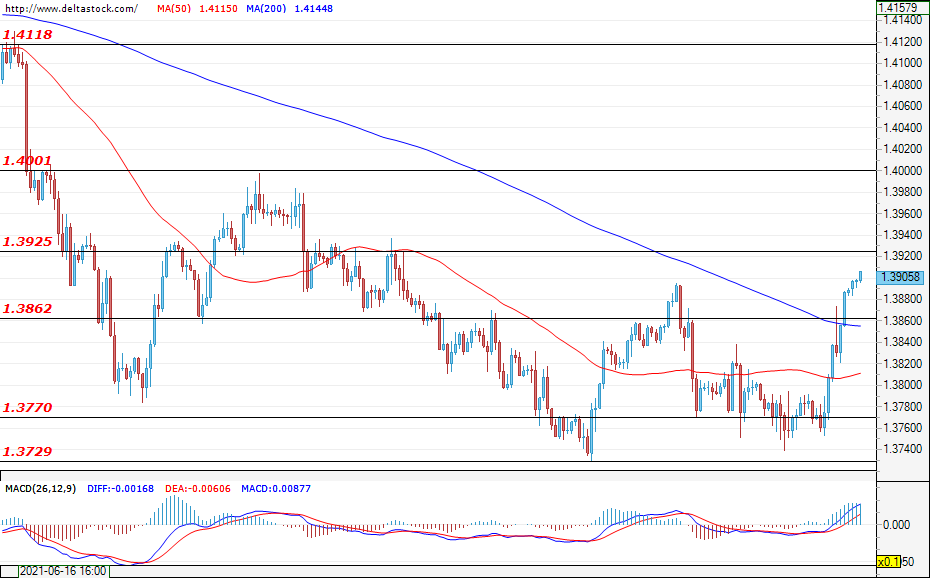
GBP/USD
Current level – 1.3905
At the end of last week, the currency pair violated the resistance level of 1.3862 and, at the time of writing, it is headed towards a test of the next resistance level of 1.3925. If the bulls fail to gain enough momentum, then it is possible for the pair to enter a consolidation phase. In the negative direction, the former resistance level of 1.3862 is now acting as a support. This week, investors’ attention will be focused on the data on the CPI for the UK (Wednesday; 06:00 GMT) and on the Claimant count employment change, again for the UK (Thursday; 06:00 GMT).
| Resistance | Support | ||
| intraday | intraweek | intraday | intraweek |
| 1.3925 | 1.4000 | 1.3860 | 1.3660 |
| 1.4000 | 1.4118 | 1.3770 | 1.3610 |