
In this technical blog, we’re going to take a quick look at the Elliott Wave charts of OIL Futures ( $CL_F), published in the member’s area of the website. As our members know, we’ve been calling rally in the commodity due to impulsive bullish sequences. We recommended members avoid selling in any proposed pull back and keep buying the dips in 3,7,11 swings. Recently OIL made a pullback that has unfolded as Elliott Wave Zig Zag pattern. In the further text, we are going to explain the Elliott Wave Pattern and trading strategy.
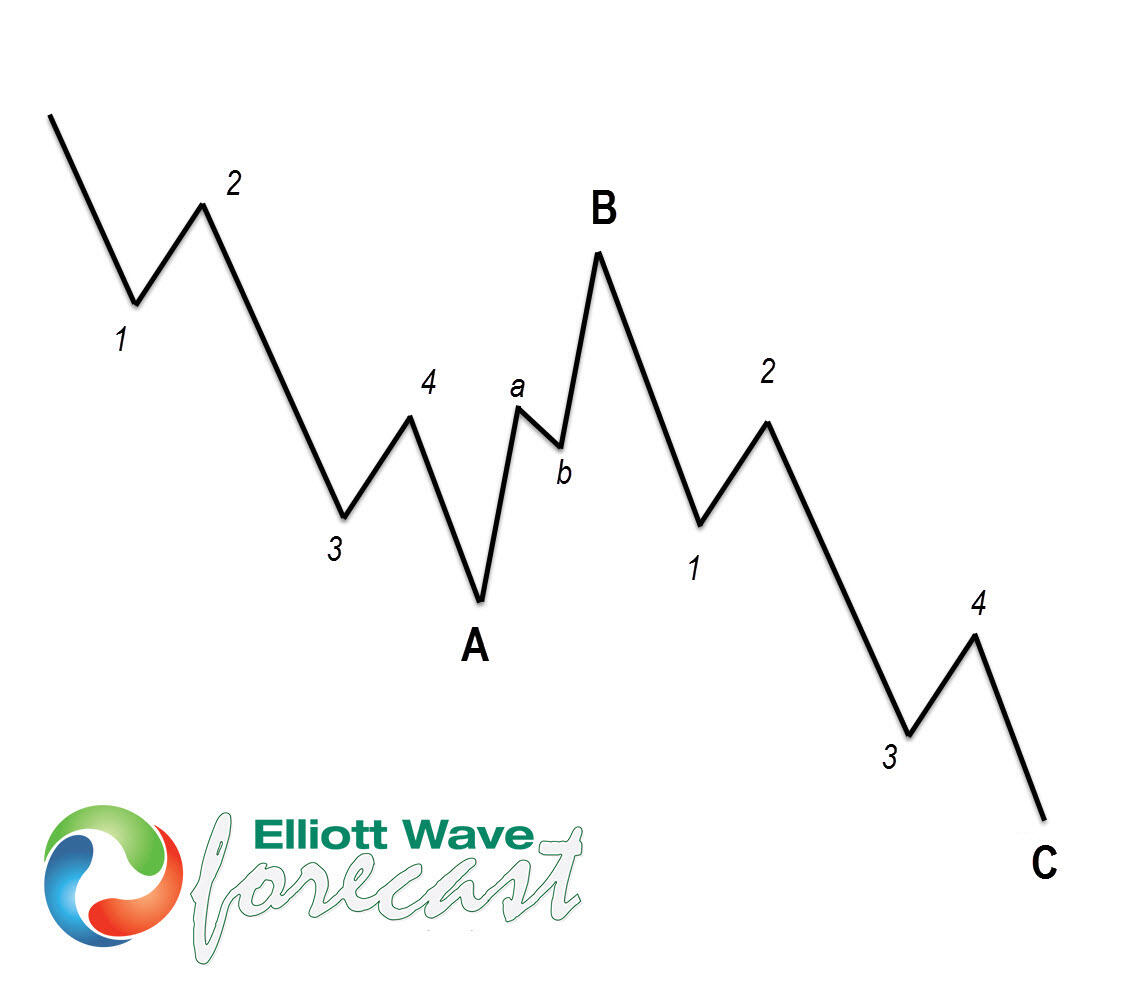
Before we take a look at the real market example, let’s explain Elliott Wave Zigzag.
Elliott Wave Zigzag is the most popular corrective pattern in Elliott Wave theory. It’s made of 3 swings which have a 5-3-5 inner structures. Inner swings are labeled as A,B,C where A =5 waves, B=3 waves and C=5 waves. That means A and C can be either impulsive waves or diagonals. (Leading Diagonal in case of wave A or Ending in case of wave C) . Waves A and C must meet all conditions of being 5 wave structures, such as: having RSI divergence between wave subdivisions, ideal Fibonacci extensions, and ideal retracements.
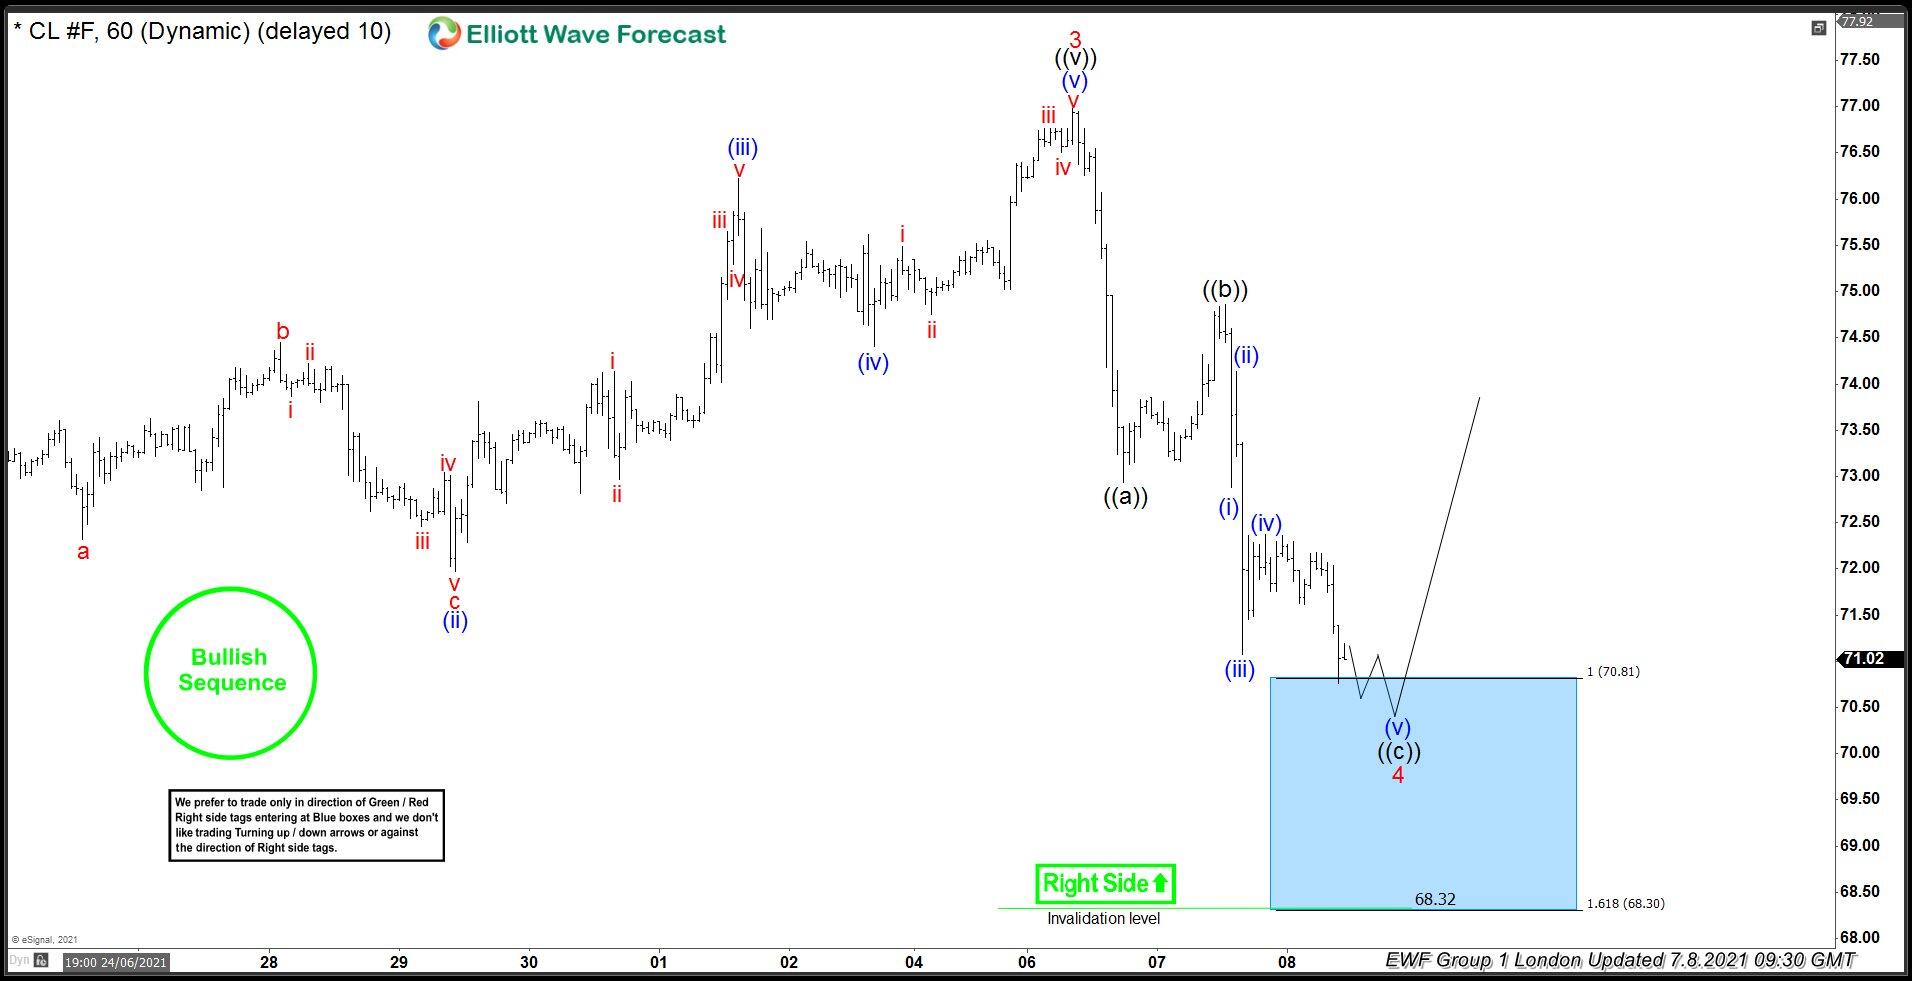
Oil Elliott Wave 1 hour chart 7.8.2021
Current view suggests the commodity is doing 4 red correction that is unfolding as Elliott Wave Zig Zag Pattern. The first leg ((a)) was a very sharp decline, if we downgrade it we can see clear 5 waves.
Then we got clear 3 waves bounce in ((b)), after which we got 5 waves down in ((c)). The price has already reached extremes from the peak. Equal legs ((a))-((b)) is marked as the blue box on the chart: 70.81-68.3 which is entry area for the buyers. As the main trend is bullish we expect buyers to appear for 3 waves bounce at least. Once bounce reaches 50 Fibs against the ((b)) black high, we will make long position risk-free ( put SL at BE) As our members know, Blue Boxes are no enemy areas, giving us an 85% chance to get a bounce.
Oil Elliott Wave 1 hour chart 7.12.2021
Buyers appeared right at the equal legs area and we got a decent reaction. Members who took long trades should have made positions risk-free. Current view suggests 4 red pull back is done at the 70.79 low. Short-term cycle from the mentioned low, looks completed as 5 waves rally- ((i)) black. After 3 waves pullback in ((ii)) , we expect to see further strength in commodity toward new highs ideally. If the price breaks 70.79 deeper corrections would be in progress, as 7 swings pattern which should ideally provide us with new trading opportunities.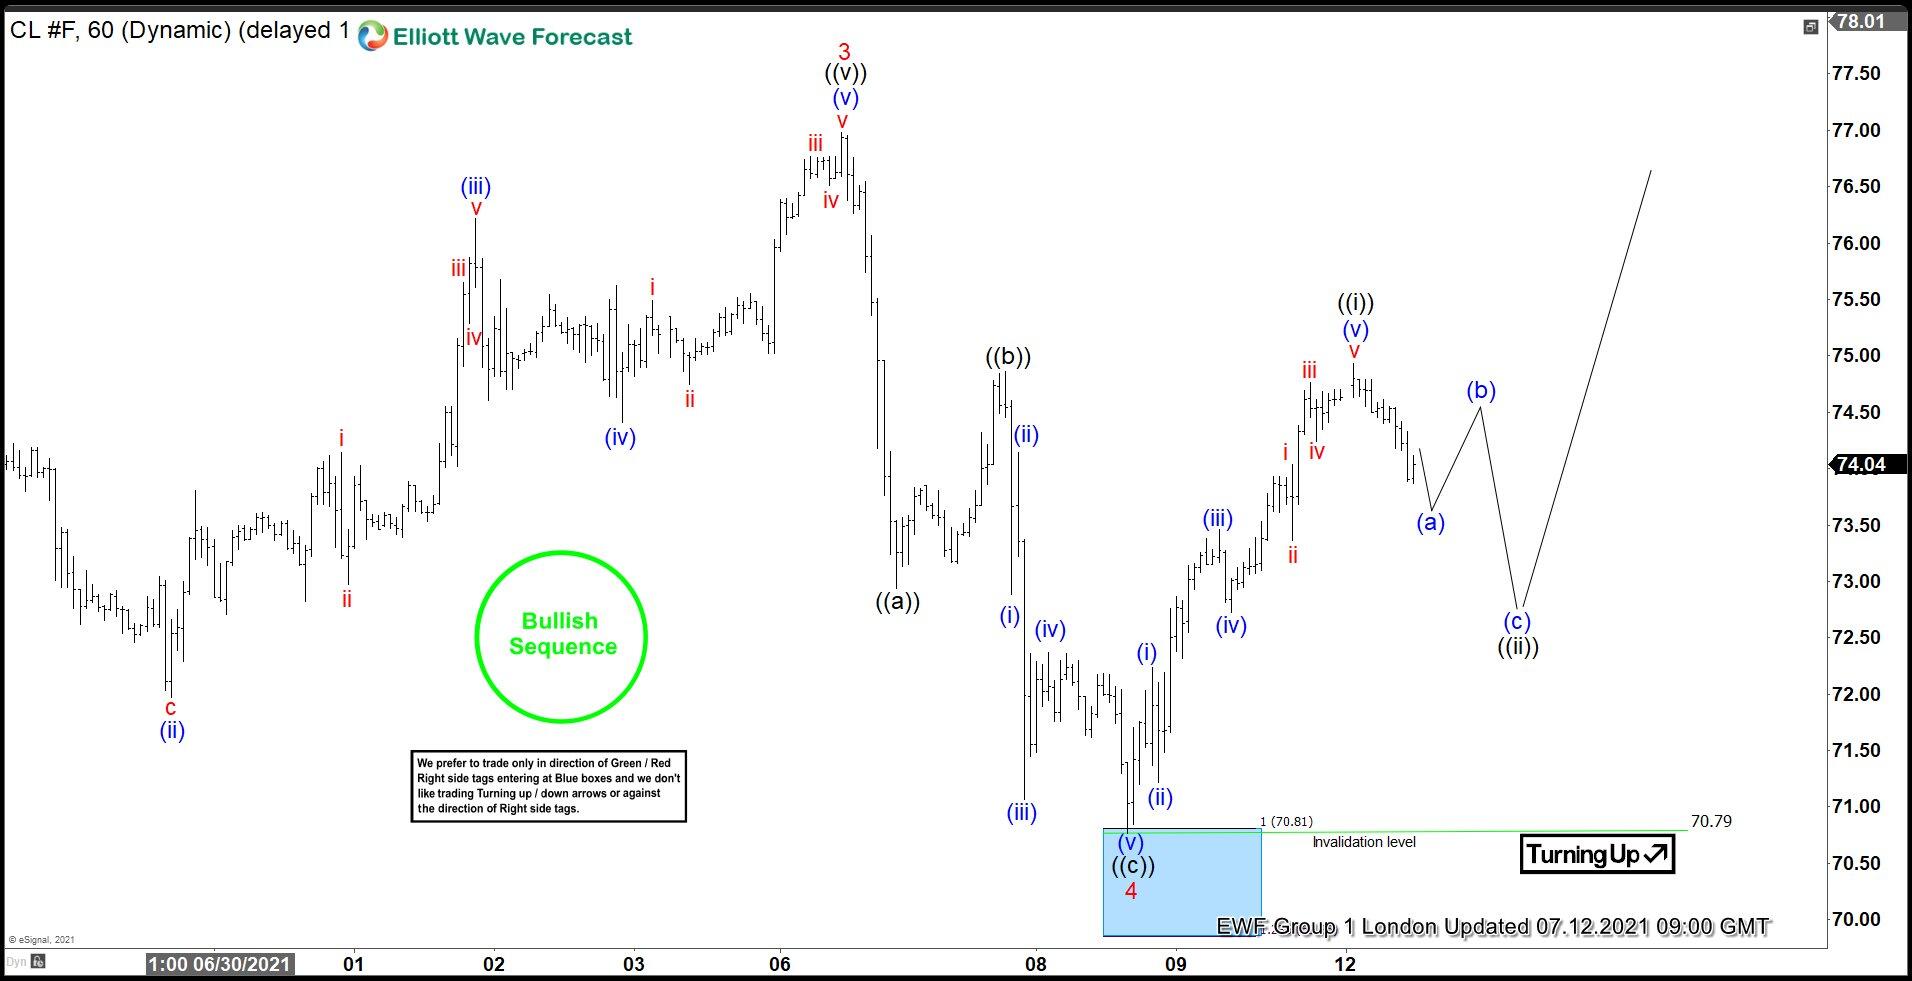


