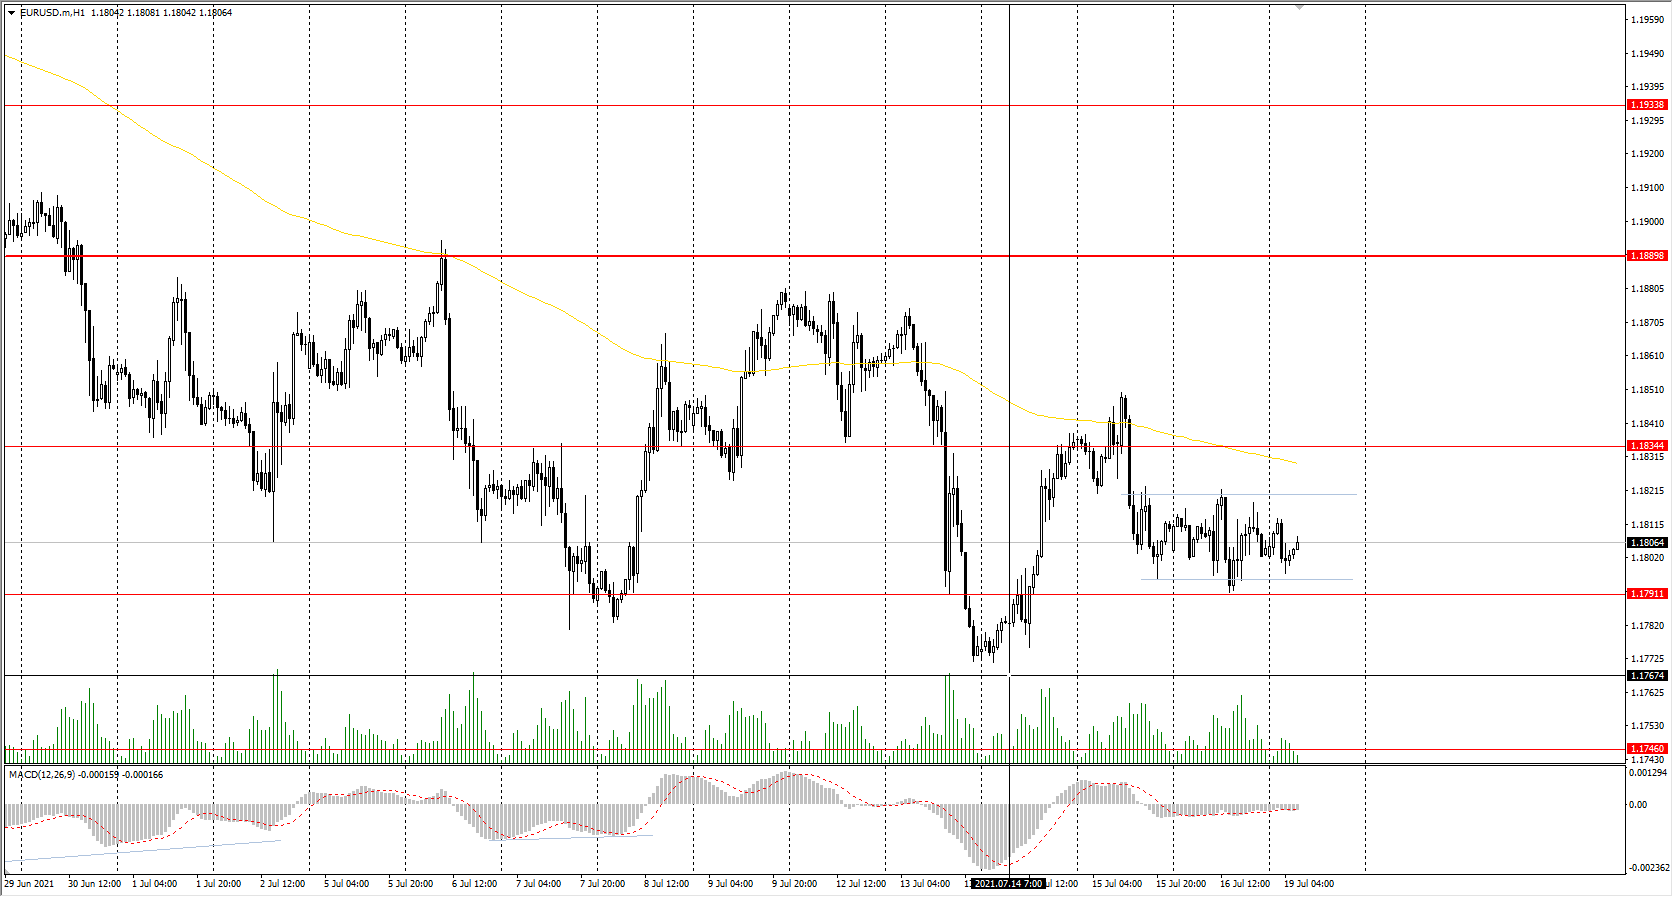
The EUR/USD currency pair
Technical indicators of the currency pair:
Prev Open: 1.1804
Prev Close: 1.1804
% chg. over the last day: 0.00%
The consumer price index in the European Union remained unchanged in June, and it is a good factor for THE growth of the EUR/USD currency pair since, unlike the US, there is no acceleration of inflation in Europe.
Trading recommendations
Support levels: 1.1791, 1.1746, 1.1609
Resistance levels: 1.1834, 1.1889, 1.1934, 1.1969
The trend is still bearish. The price is trading in a narrow price range for the second day. The MACD indicator is inactive. Under such market conditions, it is better to consider intraday trading. For sell positions, traders should wait for a pullback to the resistance level. Entries for long positions can be found on support levels, but with short targets since this kind of trading will be against the trend.
Alternative scenario: if the price breaks through the 1.1889 resistance level and fixes above, the general uptrend is likely to be resumed.
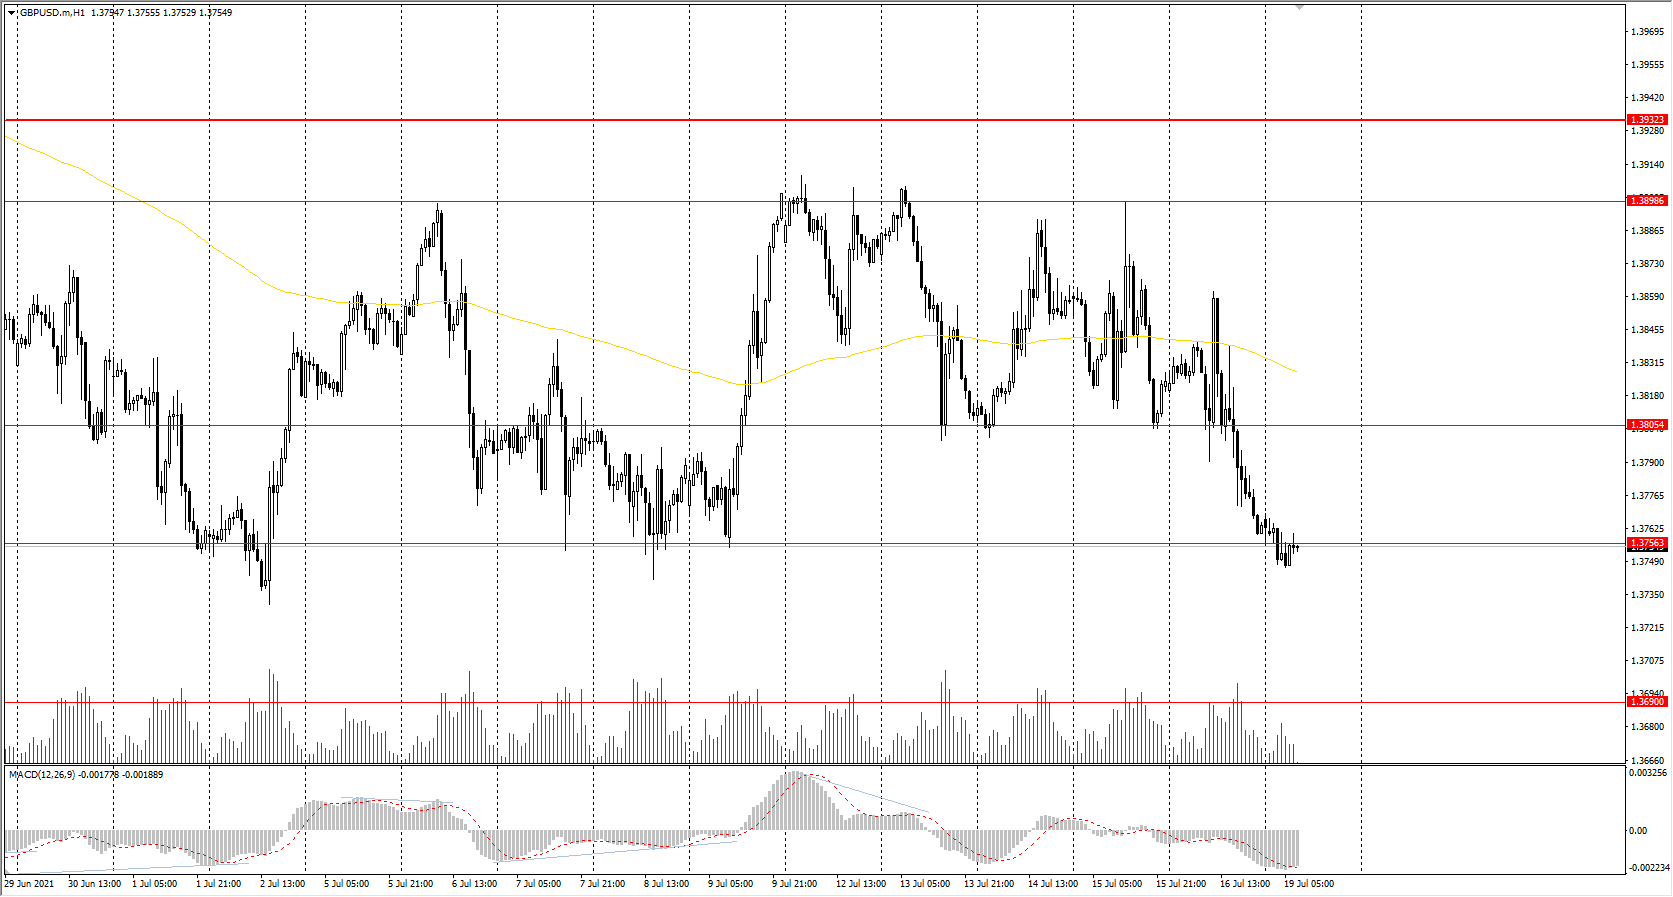
The GBP/USD currency pair
Technical indicators of the currency pair:
Prev Open: 1.3820
Prev Close: 1.3764
% chg. over the last day: -0.40%
The GBP/USD currency pair fell by 0.4% on Friday. Now the price is trading in a wide range with the borders of 1.3756-1.3899. England removes most of its restrictions this week, so there are no fundamental reasons for the British pound to decrease, but technically everything points to the fact that the fall will continue.
Trading recommendations
Support levels: 1.3756, 1.3690
Resistance levels: 1.3805, 1.3899, 1.3923, 1.4002, 1.4075, 1.4101, 1.4138, 1.4191
The trend of the GBP/USD currency pair is bearish on the H1 timeframe. The MACD indicator went into the negative zone with no signs of reversal. Under such market conditions, it is better to consider intraday trading. For sell positions, traders should wait for a pullback to the resistance level. Entries for long positions can be found on support levels.
Alternative scenario: if the price breaks through the 1.3922 resistance level and consolidates above, the bearish scenario is likely to be canceled.
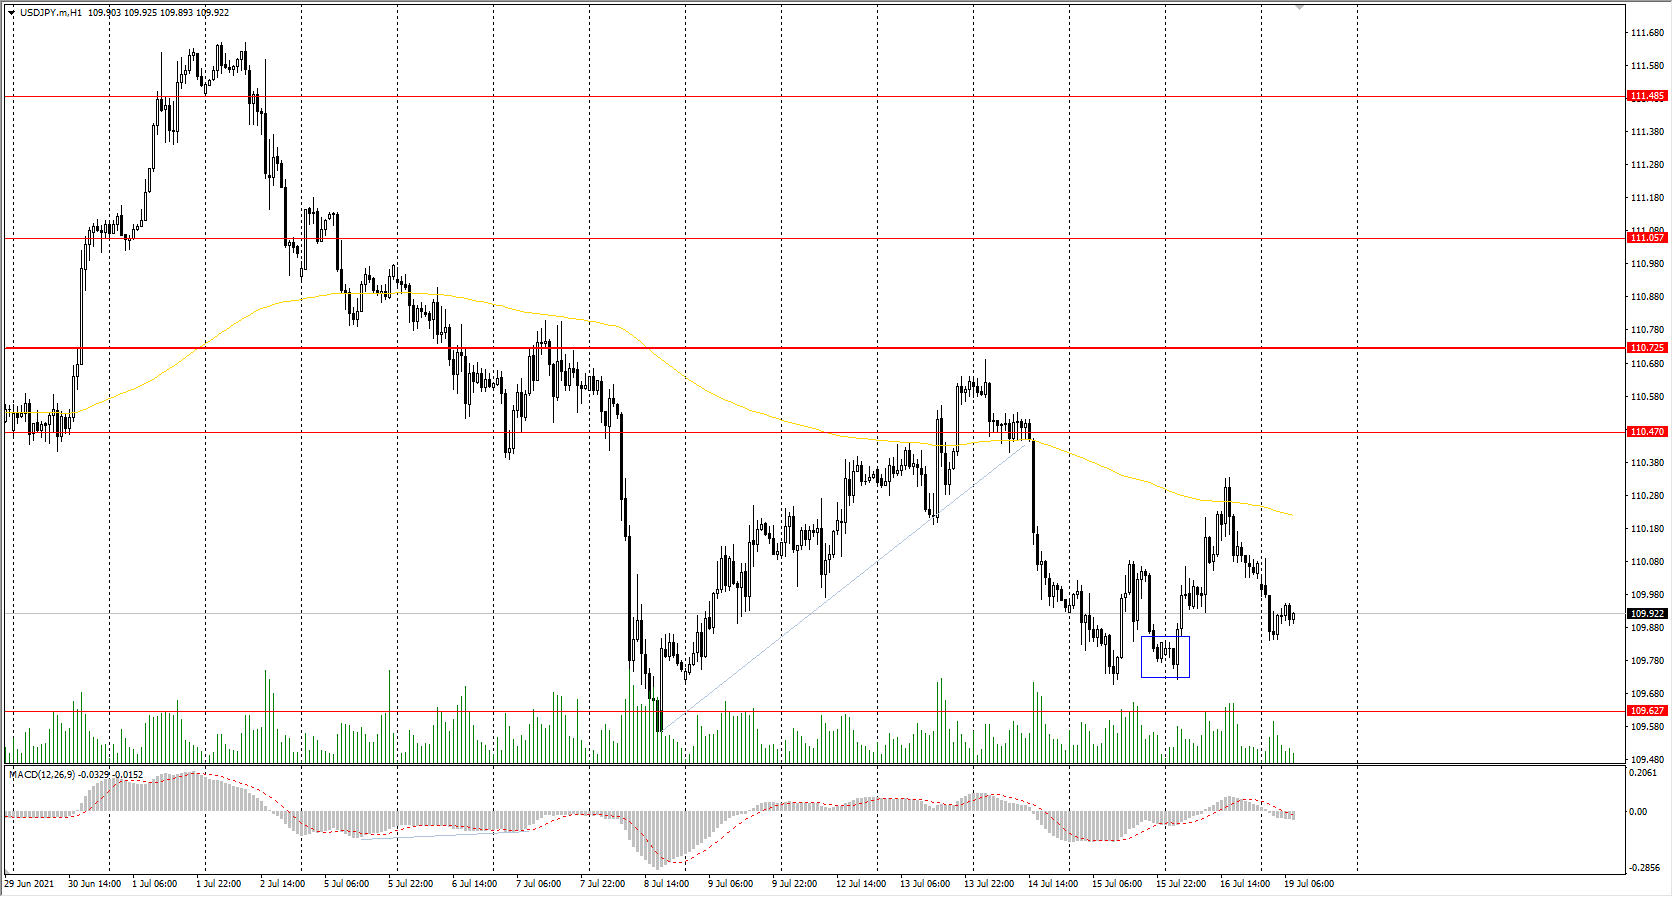
The USD/JPY currency pair
Technical indicators of the currency pair:
Prev Open: 109.80
Prev Close: 110.07
% chg. over the last day: +0.24%
The Bank of Japan reviewed its forecasts for consumer inflation on Friday. It expects the inflation to be at 0.6% (previous value 0.1%) now. The upward change in the forecast is caused by two factors: rising energy prices and uncertainty about the spread of the Delta strain of coronavirus, which could have a negative impact on both domestic and foreign economies.
Trading recommendations
Support levels: 109.63, 109.31
Resistance levels: 110.47, 110.73, 111.06, 111.48, 110.73, 112.18
From the point of view of technical analysis, the situation has not changed. There is a downward trend on the H1 timeframe, as the price is still trading below the priority change level and below the moving average. The MACD indicator has become inactive. Under such market conditions, traders are better to look for sell positions from the resistance levels on intraday timeframes. Buy positions should be considered from support levels, but only with short targets.
Alternative scenario: if the price rises above 110.73, the uptrend is likely to be resumed.
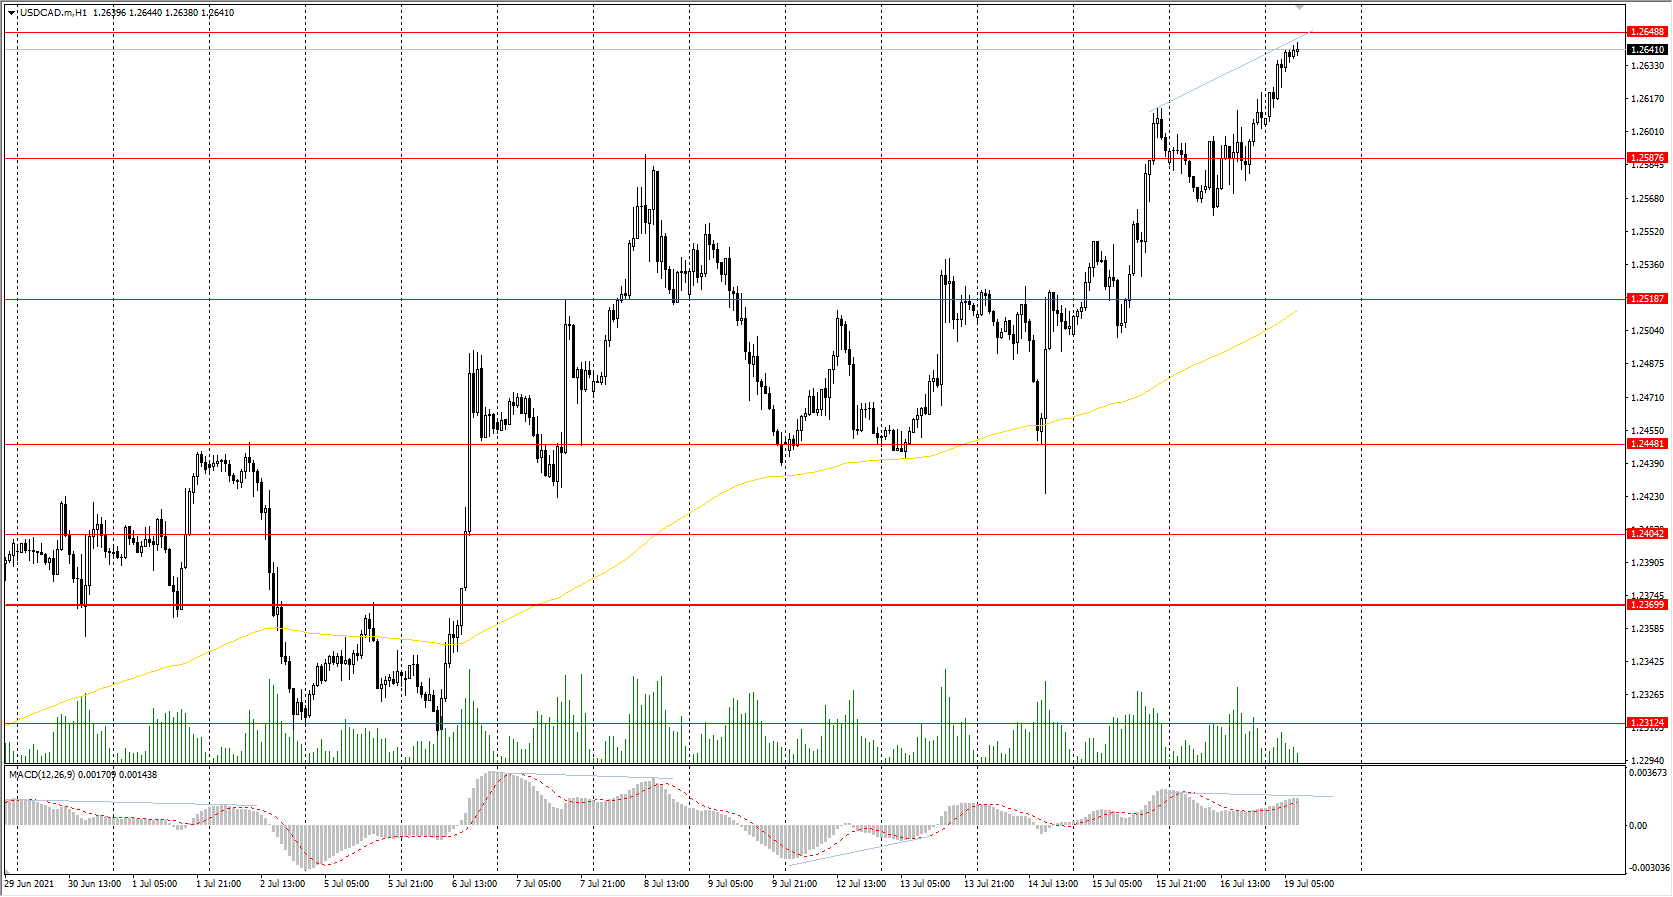
The USD/CAD currency pair
Technical indicators of the currency pair:
Prev Open: 1.2586
Prev Close: 1.2608
% chg. over the last day: +0.17%
The USD/CAD currency pair added another 0.17% on Friday. The growth was caused by two factors: the dollar index and oil prices. The dollar index is slowly growing, while oil prices are falling, which negatively affects the CAD.
Trading recommendations
Support levels: 1.2587, 1.2519, 1.2448, 1.2404, 1.2347, 1.2312, 1.2260, 1.2190
Resistance levels: 1.2649
Technically, the trend remains bullish. The price is growing, and there isn’t significant resistance from the sellers. The MACD indicator is in the positive zone, but there are already the first signs of reversal in the form of divergence. Under such market conditions, it is better to consider intraday trading. You should look for buy positions from the support levels after a small pullback, as resistance levels are ahead and the price is quite strongly deviated from the midline. Sell positions can be found from the resistance levels, but be very careful, as it will be trading against the main trend.
Alternative scenario: if the price breaks through the 1.2370 support level and fixes below, the downtrend is likely to be resumed.