Technical analysis
The CADJPY pair has remained above its trend defining 200-day moving average and the RSI indicator is recovering from oversold conditions.
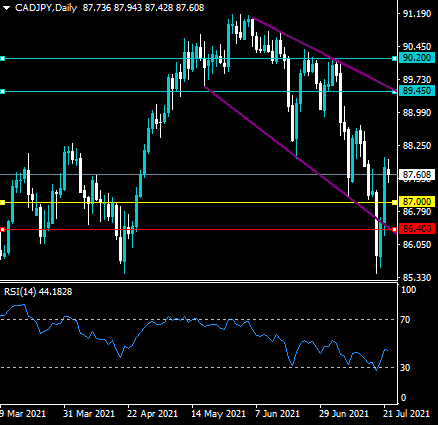
The daily time frame shows that the CADJPY pair has moved back inside a large broadening descending wedge pattern. These patterns are typically considered to be bullish reversal patterns.
What the possible outcomes are
In our most likely scenario, the CADJPY pair test back towards the top of mentioned descending broadening wedge pattern, around the 1.8945 resistance level.
Alternatively, the CADJPY pair may correct back towards back towards the bottom of the wedge pattern one final time before attempting to break above the 1.8945 resistance level.
Key levels
Support 1.8700 1.8640
Resistance 1.8945 1.9020