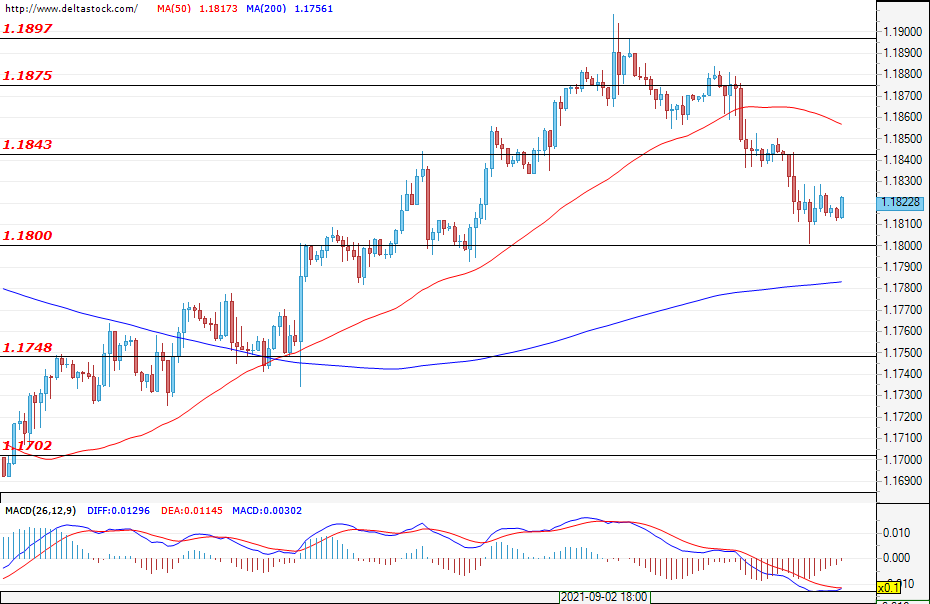
EUR/USD
Current level – 1.1822
In the case of the single currency, the development of a complex correction is observed, which currently remains limited above the support at around 1.1800. If this zone holds, buyers are likely to re-enter the market, with the main target being at around 1.1897. The first daily resistance for the bulls is the area at around 1.1843. Expectations remain positive, with the market likely to go through a range phase before resuming its uptrend move. Today, traders are awaiting the ECB’s decision on interest rates (11:45 GMT) and the following press conference (12:30 GMT). In case the bulls are left disappointed, the support at 1.1800 may get breached and the trend could reverse.
| Resistance | Support | ||
| intraday | intraweek | intraday | intraweek |
| 1.1843 | 1.1900 | 1.1800 | 1.1700 |
| 1.1875 | 1.1950 | 1.1748 | 1.1700 |
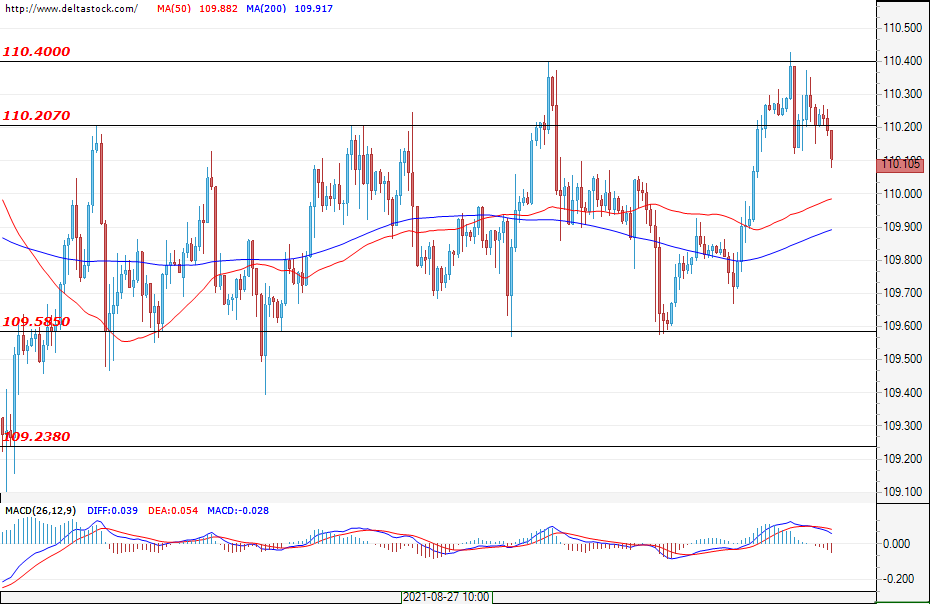
USD/JPY
Current level – 110.10
The pair returned to the range between the support at 109.58 and the resistance at 110.20. The resistance at 110.40 proved again to be a serious obstacle for the bulls. A second failed breach could encourage the bears to slam prices down to the support at 109.58. If they manage to breach this zone, deeper declines can be expected towards 108.00. At the moment, the pair’s direction remains unclear, and it is expected to be more defined in the event of a confirmed breach of either zone.
| Resistance | Support | ||
| intraday | intraweek | intraday | intraweek |
| 110.20 | 110.78 | 109.58 | 109.23 |
| 110.40 | 111.00 | 109.58 | 108.74 |
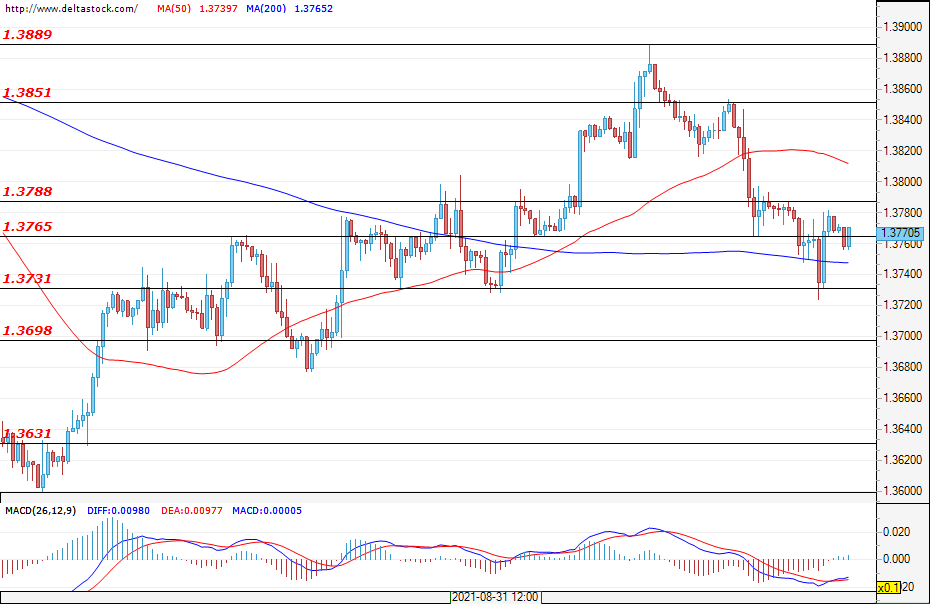
GBP/USD
Current level – 1.3770
The Cable is in a pullback phase, the key support around 1.3730 was tested, and the entry of buyers confirmed the level. Expectations remain positive – for the resumption of the rally, as it is possible that the market will enter a range phase. The first resistance for the bulls is 1.3788, and their goal in resuming the trend would be the peak at around 1.3851.
| Resistance | Support | ||
| intraday | intraweek | intraday | intraweek |
| 1.3788 | 1.3890 | 1.3730 | 1.3630 |
| 1.3850 | 1.4000 | 1.3700 | 1.3550 |