
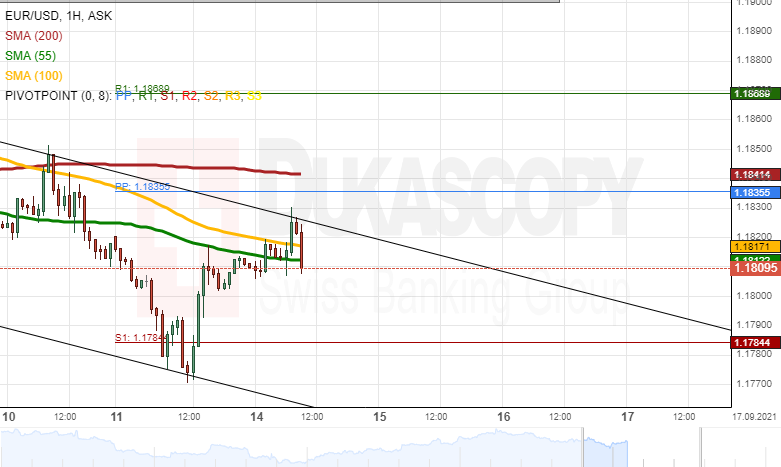
On Tuesday, Dukascopy Analytics spotted a channel down pattern on the EUR/USD hourly candle chart. The pattern appears to have guided the pair down since the September 3 bounce off from the resistance of the 1.1900 level. During Tuesday’s morning trading hours, the rate was testing the resistance of the pattern near 1.1830.
If the rate bounced off the resistance line, it would most likely look for support first in the 55 and 100-hour simple moving averages near 1.1815. Afterwards, the rate could find support in the weekly S1 simple pivot point. However, take into account that the pivot point failed to provide support during Monday’s trading.
On the other hand, a breaking of the resistance line could result in the rate testing the combined resistance of the weekly simple pivot point and the 200-hour simple moving averages at 1.1836 and 1.1840. Above these levels, the weekly R1 simple pivot point stands at 1.1869.


