
A note on lower timeframe confirming price action…
Waiting for lower timeframe confirmation is our main tool to confirm strength within higher timeframe zones, and has really been the key to our trading success. It takes a little time to understand the subtle nuances, however, as each trade is never the same, but once you master the rhythm so to speak, you will be saved from countless unnecessary losing trades. The following is a list of what we look for:
- A break/retest of supply or demand dependent on which way you’re trading.
- A trendline break/retest.
- Buying/selling tails … essentially we look for a cluster of very obvious spikes off of lower timeframe support and resistance levels within the higher timeframe zone.
- Candlestick patterns. We tend to only stick with pin bars and engulfing bars as these have proven to be the most effective.
We typically search for lower-timeframe confirmation between the M15 and H1 timeframes, since most of our higher-timeframe areas begin with the H4. Stops are usually placed 1-3 pips beyond confirming structures.
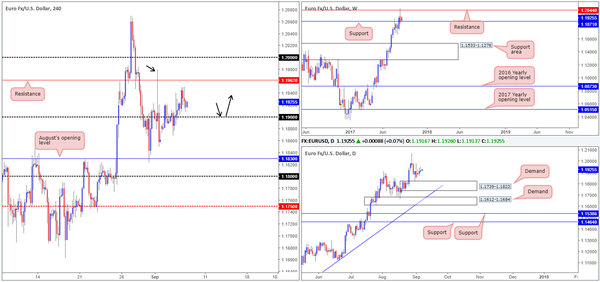
EUR/USD
Amid Wednesday’s trading, the US dollar mildly pared recent losses at weekly support drawn from 11854. As a result of this, the single currency topped at 1.1950 and ended the day closing relatively unchanged ahead of the 1.19 handle.
Looking over to the bigger picture, we can see that the pair is actually trading from a weekly support carved from 1.1871. Not only this, there’s also room seen for the bulls to stretch their legs from here as far north as the weekly resistance plotted at 1.2044. A little lower on the curve, daily price also remains well-bid above demand pegged at 1.1739-1.1823, with the said weekly resistance in place as the next upside target.
Suggestions: As the desk highlighted on Wednesday, despite all three timeframes on the EUR suggesting further buying may take place up to at least H4 resistance at 1.1962, and quite possibly the large psychological boundary 1.20 (H4 consumption wick marked with a black arrow at 1.1979 shows that offers may be weak here), we’re still wary due to where price is trading from on the USDX!
Given the above factors, we would want to see H4 price retest 1.19 as support (see black arrows) and hold firm in the shape of a full, or near-full-bodied bullish candle, before looking to buy this market and targeting 1.1962/1.20.
Data points to consider: EUR Minimum bid rate at 12.45pm, followed closely by the ECB Press conference at 1.30pm. US Unemployment weekly claims at 1.30pm GMT+1.
Levels to watch/live orders:
- Buys: 1.19 region ([waiting for a reasonably sized H4 bullish candle to form – preferably a full, or near-full-bodied candle – is advised] stop loss: ideally beyond the candle’s tail).
- Sells: Flat (stop loss: N/A).
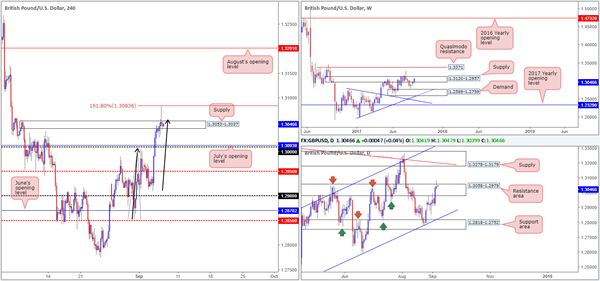
GBP/USD
Beginning with the weekly timeframe this morning, we can see that upward momentum on the British pound has picked up of late, despite being surrounded by a supply registered at 1.3120-1.2957. A decisive close above this area could see price approach the Quasimodo resistance level penciled in at 1.3371. The story on the daily timeframe, however, shows that price chalked up a nice-looking bearish selling wick on Wednesday that pierced through the top edge of a resistance zone coming in at 1.3058-1.2979.
Over on the H4 candles, the unit recently filled our short at 1.3057 and is, as we write, currently trading in the green. As explained in Wednesday’s report, we were looking to sell here due to the AB=CD formation (see black arrows) that completed within the noted higher-timeframe structures. The stop-loss order remains fixed above the 161.8% Fib ext. level at 1.3083 (1.3086).
Suggestions: For those who sold alongside us, we’re currently eyeing the large psychological boundary 1.30 as an initial target.
Data points to consider: US Unemployment weekly claims at 1.30pm GMT+1.
Levels to watch/live orders:
- Buys: Flat (stop loss: N/A).
- Sells: 1.3057 ([live] stop loss: 1.3086).
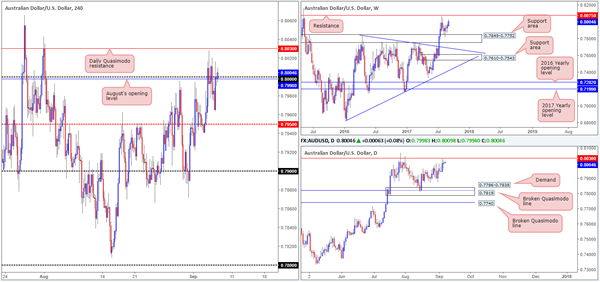
AUD/USD
In spite of the pair ranging around 60 pips, AUD/USD prices are little changed this morning. As a result of this, much of the following report will echo similar thoughts put forward in Wednesday’s report…
As of current price, H4 action remains marginally bid above the large psychological handle 0.80. With 0.80 likely being a sensitive point in this market, let’s see how land lies on the higher timeframes. Since weekly price linked with the support area at 0.7849-0.7752 three weeks ago, the unit has remained reasonably well-bid. The next objective, assuming that price continues to push north, can be seen around resistance drawn from 0.8075. Before weekly action can reach the noted resistance, however, let’s not forget that daily action must first consume the Quasimodo resistance at 0.8030 (recent trade printed an indecision candle).
Suggestions: We would not want to be a seller at 0.80 given the room seen to move higher on the bigger picture. Similarly, we would be uncomfortable buying above 0.80 seeing how close the daily Quasimodo resistance is located. In addition to this, a sell from the daily Quasimodo opens one up to the possibility of being faked up to the weekly resistance at 0.8075. Therefore, the only place of interest right now, in our opinion, is the said weekly resistance level, which happens to stretch as far back as 1997! Whether or not this will turn to be a valid sell zone will depend entirely on how H4 price action responds. Ideally, we’d want a strong bearish candle form from here in the shape of a full, or near-full-bodied formation.
Data points to consider: Australian Retail sales and trade balance figures at 2.30am. US Unemployment weekly claims at 1.30pm GMT+1.
Levels to watch/live orders:
- Buys: Flat (stop loss: N/A).
- Sells: 0.8075 region ([waiting for a reasonably sized H4 bearish candle to form – preferably a full, or near-full-bodied candle – is advised] stop loss: ideally beyond the candle’s wick).
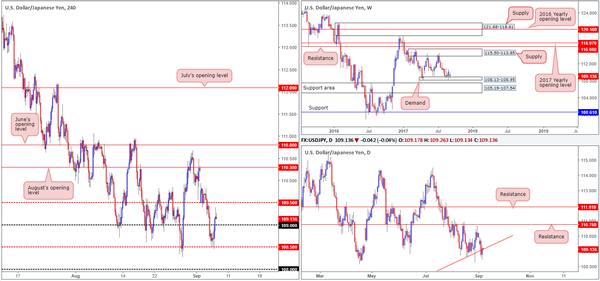
USD/JPY
The USD/JPY corrected sharply higher from the H4 mid-level support at 108.50 during trade on Wednesday, bidding price above the 109 handle into the closing bell. Technically speaking, this likely has something to do with the fact that weekly price is trading from demand at 108.13-108.95, as well as the USDX also bouncing from weekly support at 11854. Also of particular interest is daily price recently closed back above the trendline support extended from the 100.08. The next upside target from this point can be seen at resistance fixed from 110.76.
Suggestions: As long as 109 holds as support, we feel further upside could be on the cards. Would we trade long from this number? It is certainly an option, but we believe it would only be a viable buy zone if, and only if, additional lower-timeframe confirmation is seen (see the top of this report for ideas on how to trade using lower-timeframe action).
Data points to consider: US Unemployment weekly claims at 1.30pm GMT+1.
Levels to watch/live orders:
- Buys: 109 region ([waiting for lower-timeframe confirmation to present itself is advised] stop loss: dependent on where one confirms this number).
- Sells: Flat (stop loss: N/A).
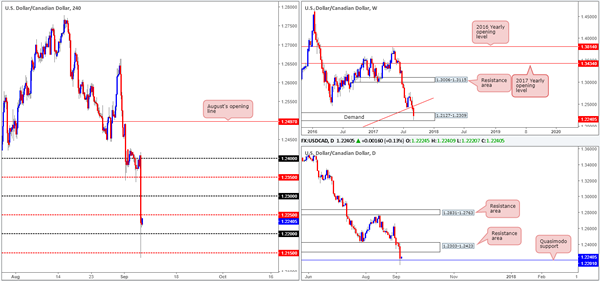
USD/CAD
Going into the early hours of yesterday’s US segment, the Bank of Canada surprised the markets by increasing interest rates by 25bps. The after-effects saw the USD/CAD aggressively tumble over 200 pips lower, dipping below 1.2200 before finding refuge around the H4 mid-level support 1.2150.
Following yesterday’s excitement, the technical landscape shows weekly price sited within the walls of a demand area coming in at 1.2127-1.2309 drawn from as far back as June 2015. Alongside this, daily price recently hammered its way through 1.2303-1.2423, and shook hands with a Quasimodo support at 1.2201.
Suggestions: Despite weekly and daily price trading from supports, a long on the H4 timeframe is challenging with 1.2250 lurking just ahead. A H4 close above this number would likely confirm buying up to the 1.23 mark and also further confirm strength from the higher-timeframe supports. However, there’s one caveat here! The 1.23 handle converges with the underside of the recently broken support area (now acting resistance zone). Therefore, even if one manages to buy this market above 1.2250, there will likely be less than 40 pips of room to play with before a major target comes into view. And considering that the underlying trend on this pair is firmly pointing south, this would be a challenging long, in our humble opinion. As such, remaining flat until more conducive price action presents itself is the route we have chosen to take.
Data points to consider: US Unemployment weekly claims at 1.30pm. Canadian Building permits at 1.30pm, followed by Crude oil inventories at 4pm GMT+1.
Levels to watch/live orders:
- Buys: Flat (stop loss: N/A).
- Sells: Flat (stop loss: N/A).
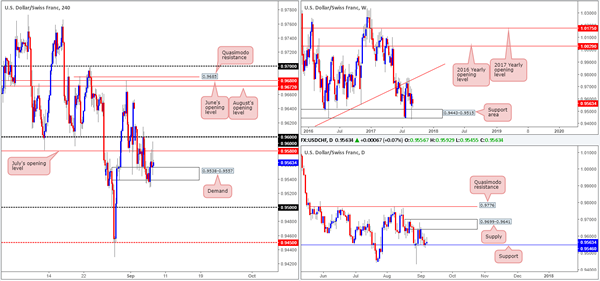
USD/CHF
Along similar lines to its inversely correlated cousin the EUR/USD, the Swissy also ended Wednesday’s session relatively unchanged. The bounce from H4 demand at 0.9538-0.9557, as you can see, failed to gain much upside trajectory as July’s opening level at 0.9580 was heavily offered.
With H4 bids/offers trading even at the moment, let’s take a peek at what the higher timeframes are up to. Weekly flow remains loitering above a support area coming in at 0.9443-0.9515, while down on the daily timeframe the candles are currently bolstered by support at 0.9546.
With upside slightly favored according to daily structure, a H4 close above 0.96 would ideally need to be seen before longs could be considered. Having said that though, even with this price action it would still be a challenging market to buy since there’s a nearby daily supply positioned at 0.9699-0.9641!
Suggestions: Owing to the above notes, there’s very little to hang our hat on at this time. Therefore, remaining on the sidelines appears the safer route for now.
Data points to consider: US Unemployment weekly claims at 1.30pm GMT+1.
Levels to watch/live orders:
- Buys: Flat (stop loss: N/A).
- Sells: Flat (stop loss: N/A).
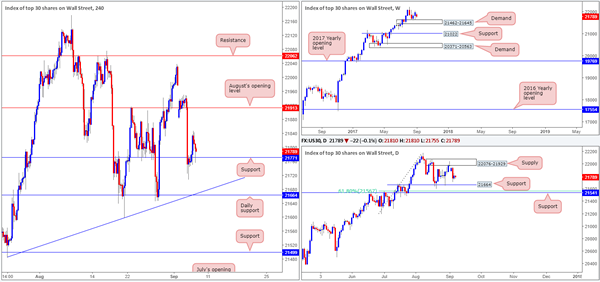
DOW 30
Leaving daily support at 21664 unchallenged, the H4 candles managed to reclaim the 21771 mark and later retest the number as support. With weekly buyers seen holding above demand at 21462-21645, this support could maintain a presence in this market and eventually drag the index up to August’s opening level at 21913. This is, of course, if daily sellers don’t flood the market to connect with the aforementioned daily support.
Our suggestions: Given that the US equity market is still entrenched within an incredibly strong uptrend, this could – coupled with weekly demand and the current H4 support – potentially force prices higher today. However, we would only consider a long position here if price crosses swords with the daily support mentioned above at 21664. Not only because of it converging with a H4 trendline support taken from the low 21484, but also because this will bring daily bulls into the picture as well as weekly and H4 bulls.
Data points to consider: US Unemployment weekly claims at 1.30pm GMT+1.
Levels to watch/live orders:
- Buys: 21664 region ([waiting for a reasonably sized H4 bullish candle to form – preferably a full, or near-full-bodied candle – is advised] stop loss: ideally beyond the candle’s tail).
- Sells: Flat (stop loss: N/A).
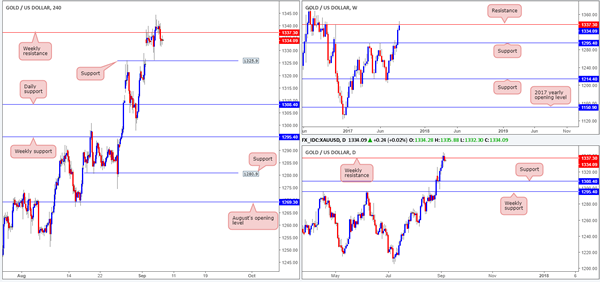
GOLD
Gold prices dipped amid yesterday’s US segment, consequently dragging the H4 candles back below weekly resistance at 1337.3. For those who read Wednesday’s report you may recall that we said if a H4 candle closes below weekly resistance at 1337.3, this, to us, would be considered a bearish signal, and one worth trading back down to daily support at 1308.4. With that in mind, our desk has taken a small short position at 1334.6 with a stop-loss order positioned at 1341.2.
Our suggestions: The ultimate goal for the current trade is the daily support mentioned above at 1308.4. We remain relatively confident in our trading idea, simply because the US dollar is trading from weekly support at 11854. A dollar advance usually translates into a declining gold market. However, when/if a H4 close prints beyond H4 support at 1325.9, this could be used as a respectable trigger to reduce risk to breakeven.
Levels to watch/live orders:
- Buys: Flat (stop loss: N/A).
- Sells: 1334.6 ([live] stop loss: 1341.2).


