
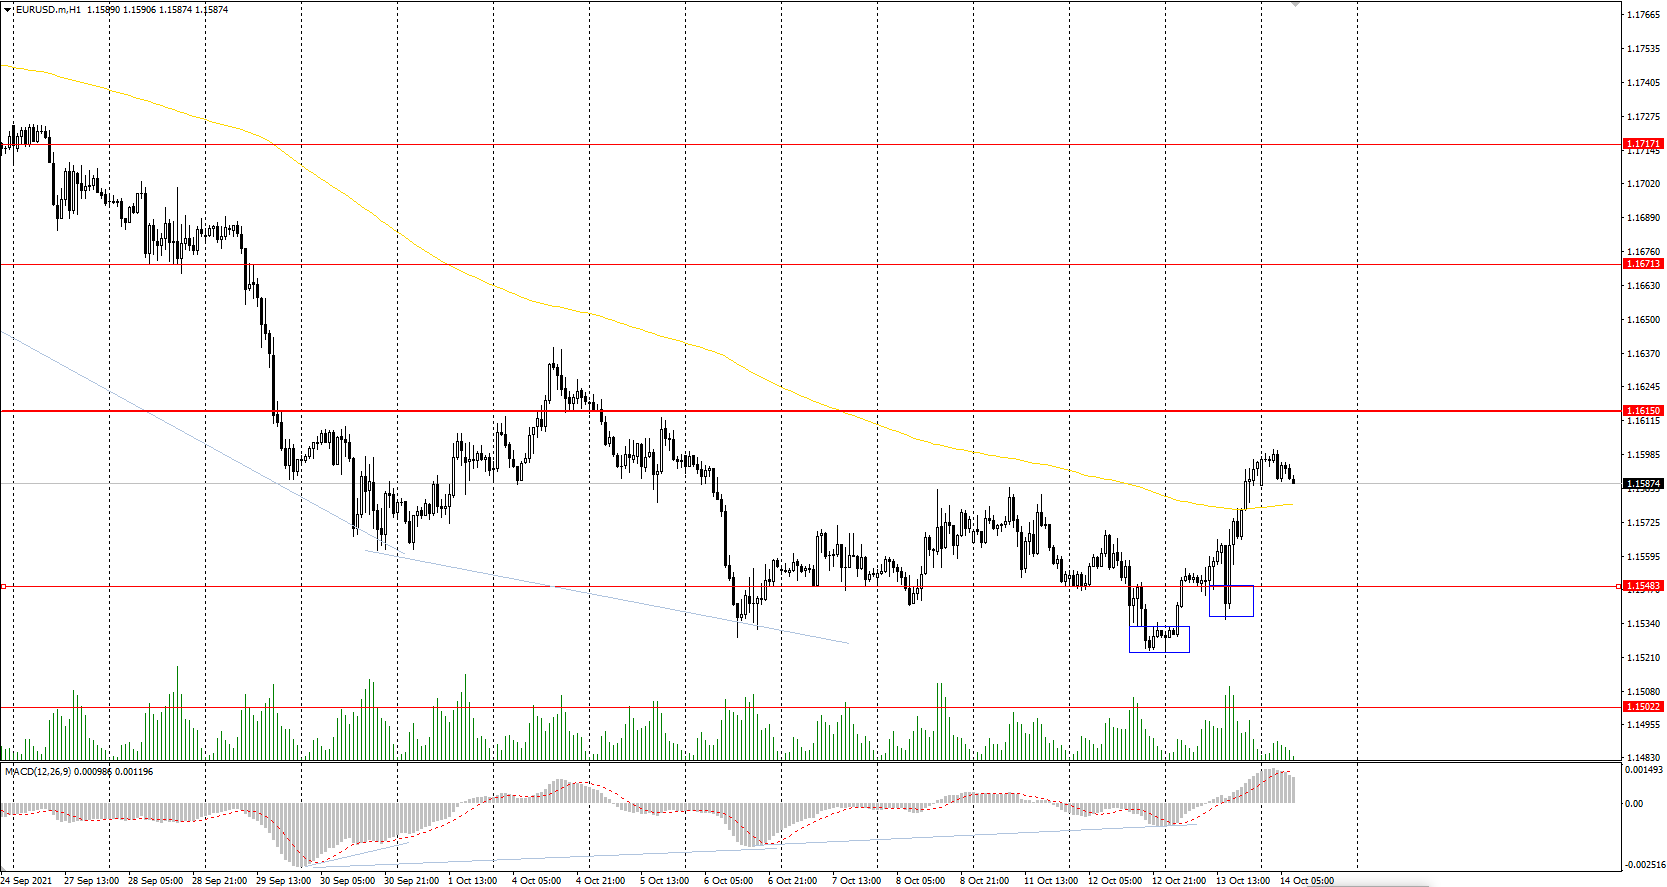
The EUR/USD currency pair
Technical indicators of the currency pair:
Prev Open: 1.1530
Prev Close: 1.1596
% chg. over the last day: +0.57%
Inflation in Germany remains above 4%, which is the highest level since December 1993. This is mainly due to high energy and food prices. German economic institutions lowered their growth forecast for 2021 to 2.4% from the previous forecast of 3.7%.
Trading recommendations
Support levels: 1.1548, 1.1502, 1.1453
Resistance levels: 1.1615, 1.1671, 1.1717, 1.1772, 1.1802, 1.1835
From the technical point of view, the EUR/USD trend is bearish. The MACD indicator has become positive. Under such market conditions, traders can look for Sell deals from the resistance levels near the moving average. Buy trades should be considered only from the support levels or from the buyers’ initiative zone.
Alternative scenario: if the price breaks out through the 1.1615 resistance level and fixes above, the mid-term uptrend is more likely to resume.
News feed for 2021.10.14:
- US Producer Price Index (m/m) at 15:30 (GMT+3);
- US Initial Jobless Claims (w/w) at 15:30 (GMT+3);
- US FOMC Member Bostic’s Speech at 17:00 (GMT+3);
- US FOMC Member Barkin’s Speech at 20:00 (GMT+3).
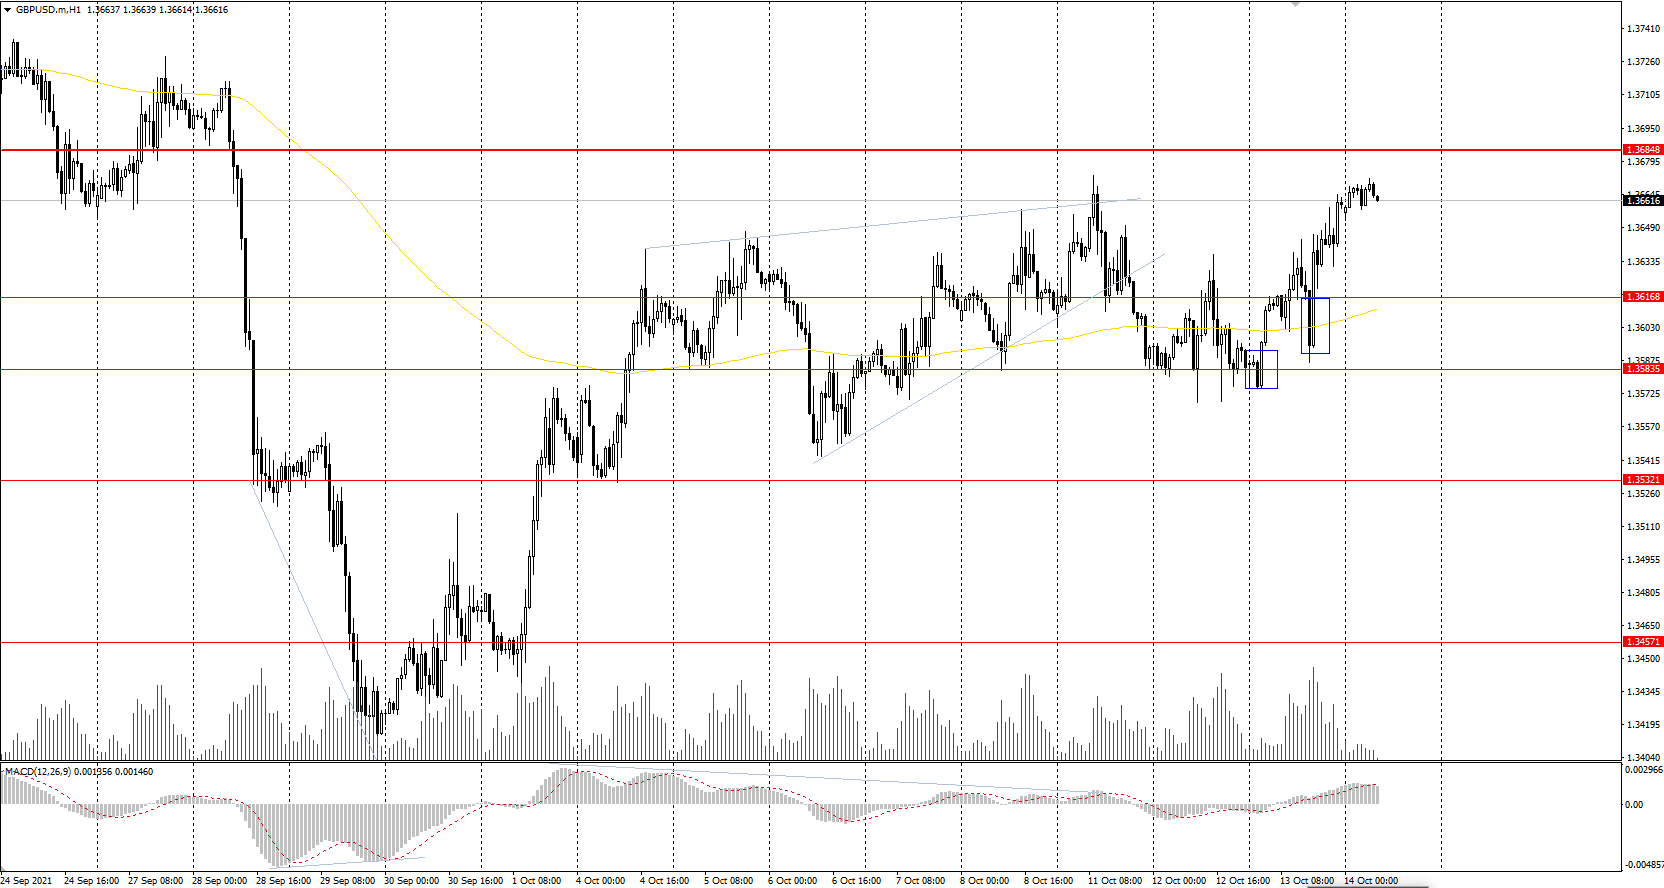
The GBP/USD currency pair
Technical indicators of the currency pair:
Prev Open: 1.3586
Prev Close: 1.3660
% chg. over the last day: +0.54%
UK actual GDP for the month increased by 0.4% (forecast 0.5%, previous 0.1%). Industrial and manufacturing productions also increased slightly, compared to the previous month.
Trading recommendations
Support levels: 1.3617, 1.3584, 1.3532, 1.3457, 1.3360, 1.3282
Resistance levels: 1.3685, 1.3759, 1.3812, 1.3886
On the hourly time frame, the GBP/USD trend is bearish. However, the British currency looks more confident than the euro due to its direct correlation with oil prices and approaching the priority change level on the current timeframe. The MACD has become positive. Buy trades should be considered only within the day and only from the initiative zone of the buyers. It is better to look for sell deals from the nearest resistance levels, but after an additional confirmation in the form of a sellers’ initiative, because the buyers’ pressure is higher now.
Alternative scenario: if the price breaks through the 1.3685 resistance level and consolidates above, the bullish scenario is likely to resume.
The USD/JPY currency pair
Technical indicators of the currency pair:
Prev Open: 113.58
Prev Close: 113.24
% chg. over the last day: -0.30%
The Japanese currency has weakened nearly 4% against the dollar over the past three weeks.However, there are signs that this might just be the start of a much bigger decline in the future as the Bank of Japan is not going to take any action on monetary policy yet while the Fed prepares to cut its QE program.
Trading recommendations
Support levels: 113.25, 112.19, 111.53, 110.99, 110.65, 109.95, 109.63
Resistance levels: 113.66, 114.40
The main trend of the USD/JPY currency pair is bullish. The Japanese yen is rapidly declining against the US dollar. The MACD indicator has become inactive. Under such market conditions, it’s better to look for buy positions from the support levels near the moving average, since the price has deviated greatly from the average line. Sell positions should be considered only throughout the day from the resistance levels, given there is sellers’ initiative.
Alternative scenario: if the price falls below 111.53, the uptrend is likely to be broken.

News feed for 2021.10.14:
- Japan Industrial Production (m/m) at 07:30 (GMT+3).
The USD/CAD currency pair
Technical indicators of the currency pair:
Prev Open: 1.2460
Prev Close: 1.2441
% chg. over the last day: -0.15%
The Canadian dollar is a commodity currency, so USD/CAD is highly dependent on the dynamics of the dollar index and oil prices. At the end of yesterday the dollar index sharply decreased on the news on inflation in the US, while oil prices remained unchanged. As a result, the price of the USD/CAD currency pair declined due to the weakness of the US currency.
Trading recommendations
Support levels: 1.2425
Resistance levels: 1.2518, 1.2565, 1.2628, 1.2729, 1.2774, 1.2891
From the technical point of view, the trend of the USD/CAD currency pair is bearish. But now the price is trading in a corridor which turns into a narrowing triangle pattern. The MACD indicator has become inactive, but there are signs of divergence on higher time frames. Under such market conditions, it is better to search for sell deals from the resistance levels near the moving average, as the price has strongly deviated from the average values. Buy trades should be considered only on lower time frames from the support levels, if there is the buyer’s initiative after the price breakout the triangle upwards.
Alternative scenario: if the price breaks out through the 1.2565 resistance level and fixes above, the uptrend will likely resume.

News feed for 2021.10.14:
- US Crude Oil Reserves (w/w) at 18:00 (GMT+3).


