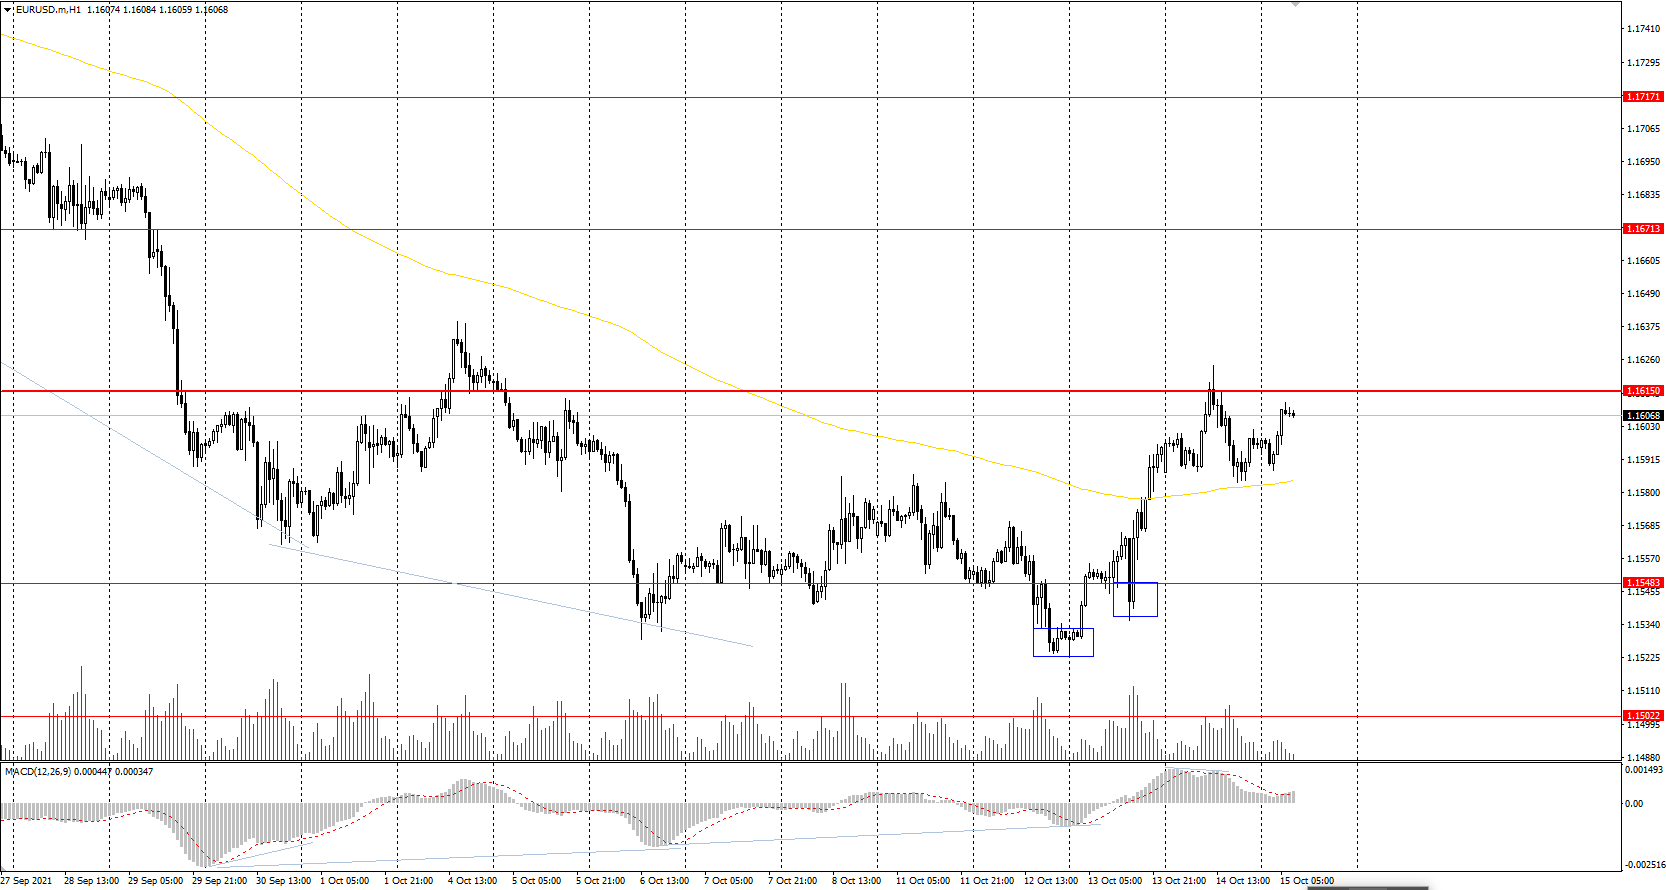
The EUR/USD currency pair
Technical indicators of the currency pair:
Prev Open: 1.1587
Prev Close: 1.1597
% chg. over the last day: +0.08%
German economic institutions believe the German economy will reach normal industrial capacity by 2022. The German economy is expected to grow for 2.4% in 2021 and for 4.8% in 2022. ECB spokesman Ren claims that the Eurozone’s economic recovery is getting stronger and more resilient, but the ECB will maintain stimulus for some time.
Trading recommendations
Support levels: 1.1548, 1.1502, 1.1453
Resistance levels: 1.1615, 1.1671, 1.1717, 1.1772, 1.1802, 1.1835
From the technical point of view, the EUR/USD trend is bearish. The MACD indicator has become positive. Under such market conditions, it is better to look for Sell deals from the priority change level, however it should be noted that the pressure of buyers is increasing. Buy trades should be considered only from the support levels or from the buyers’ initiative areas.
Alternative scenario: if the price breaks out through the 1.1615 resistance level and fixes above, the mid-term uptrend will more likely resume.
News feed for 2021.10.15:
- US Retail Sales (m/m) at 15:30 (GMT+3);
- US Empire State Manufacturing Index (m/m) at 15:30 (GMT+3);
- US Michigan Consumer Sentiment (m/m) at 17:00 (GMT+3);
- US FOMC Member Williams Speech at 19:20 (GMT+3).
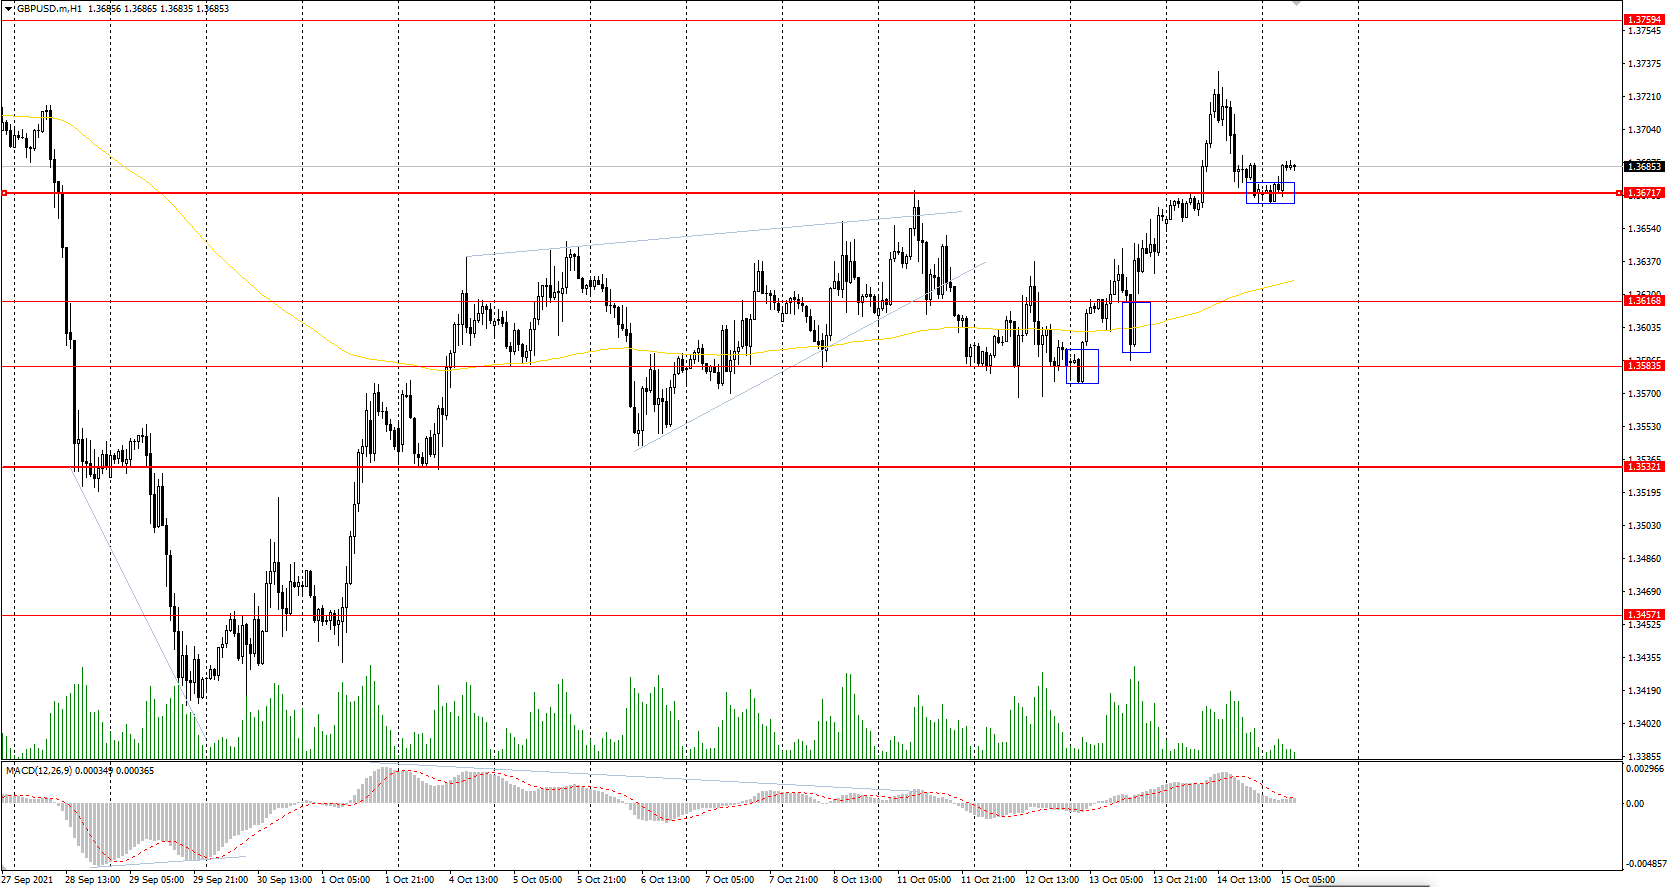
The GBP/USD currency pair
Technical indicators of the currency pair:
Prev Open: 1.3656
Prev Close: 1.3674
% chg. over the last day: +0.13%
Bank of England spokeswoman Mann said yesterday that the supply chain may last longer, but the Bank of England expects the demand to shift toward the services. The UK financial markets expect the QE program to be reduced at the end of December.
Trading recommendations
Support levels: 1.3671, 1.3617, 1.3584, 1.3532, 1.3457, 1.3360, 1.3282
Resistance levels: 1.3759, 1.3812, 1.3886
On the hourly time frame, the GBP/USD trend has changed to bullish. The British currency is strengthening due to the direct correlation with oil prices. The MACD indicator has become inactive. Buy trades should be considered only within the day and only from the initiative zone of the buyers. It is better to look for sell deals from the resistance levels, but after an additional confirmation in the form of a sellers’ initiative, as the buyers’ pressure is higher right now.
Alternative scenario: if the price breaks down through the 1.3532 support level and consolidates below, the bullish scenario is more likely to be broken.
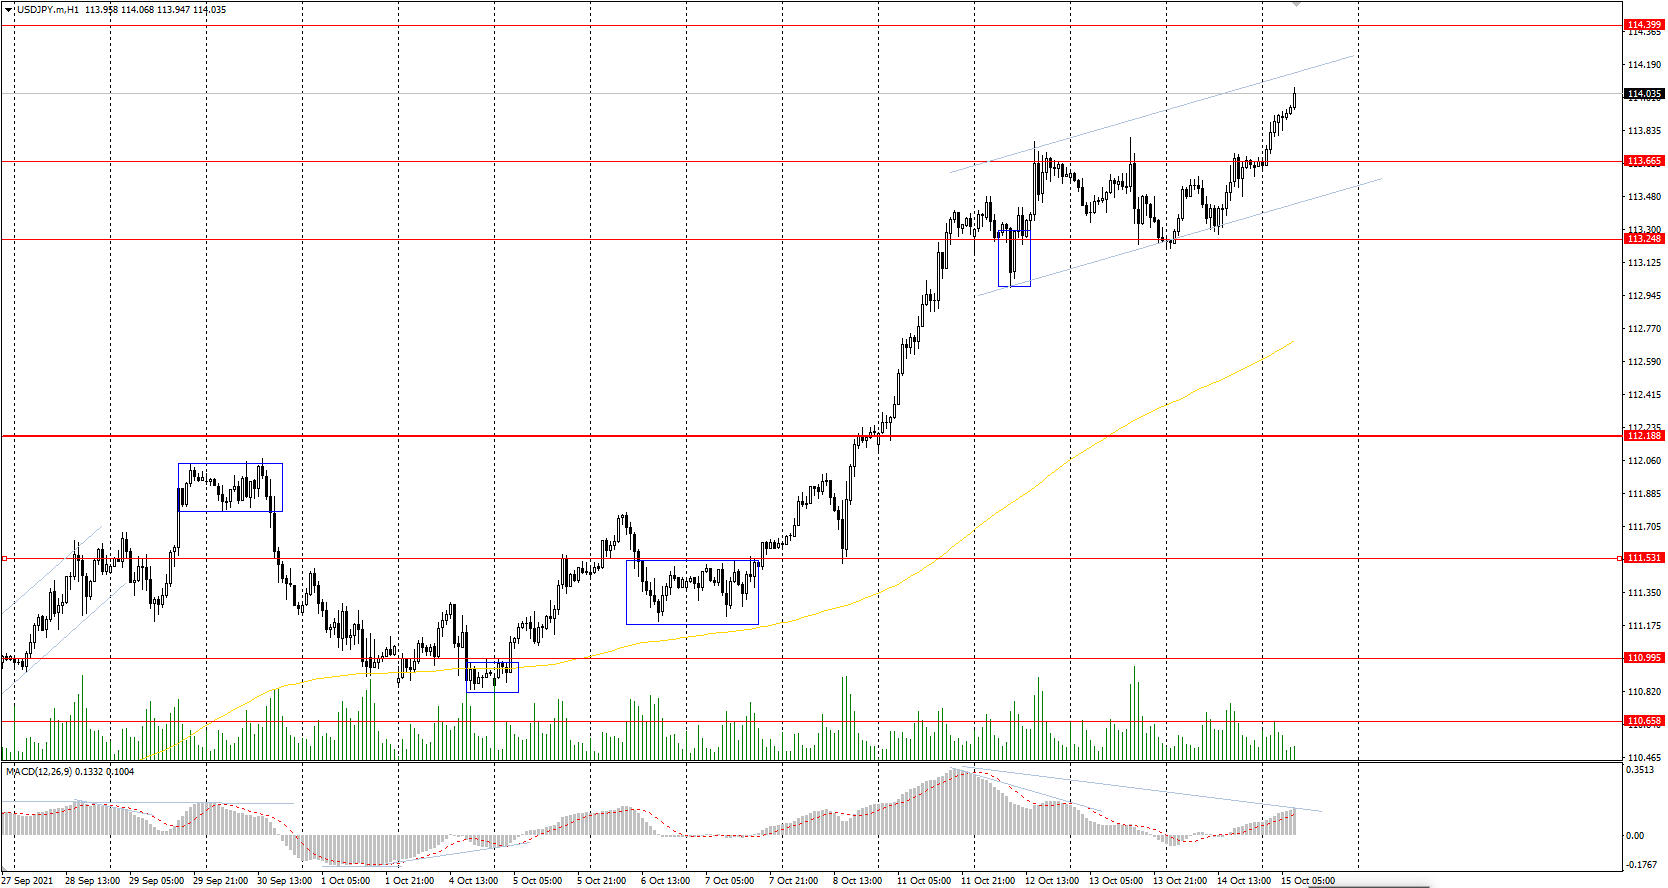
The USD/JPY currency pair
Technical indicators of the currency pair:
Prev Open: 113.24
Prev Close: 113.67
% chg. over the last day: +0.38%
Bank of Japan spokesman Noguchi claimed that monetary policy easing is not an option for Japan at least until the end of the year. The Japanese Yen will correlate with the US Dollar at most now.
Trading recommendations
Support levels: 113.66, 113.25, 112.19, 111.53, 110.99, 110.65, 109.95, 109.63
Resistance levels: 114.40
The main trend of the USD/JPY currency pair is bullish. The Japanese yen is rapidly declining against the US dollar. The MACD indicator is in the positive zone, but on higher time frames there is a divergence, which means that growth is limited and the correction should be expected to take place in the nearest future. Under such market conditions, it’s better to look for buy positions from the support levels near the moving average, since the price has deviated greatly from the average line. Sell positions should be considered only throughout the day from the resistance levels, given that there is sellers’ initiative.
Alternative scenario: if the price falls below 112.19, the uptrend is more likely to be broken.
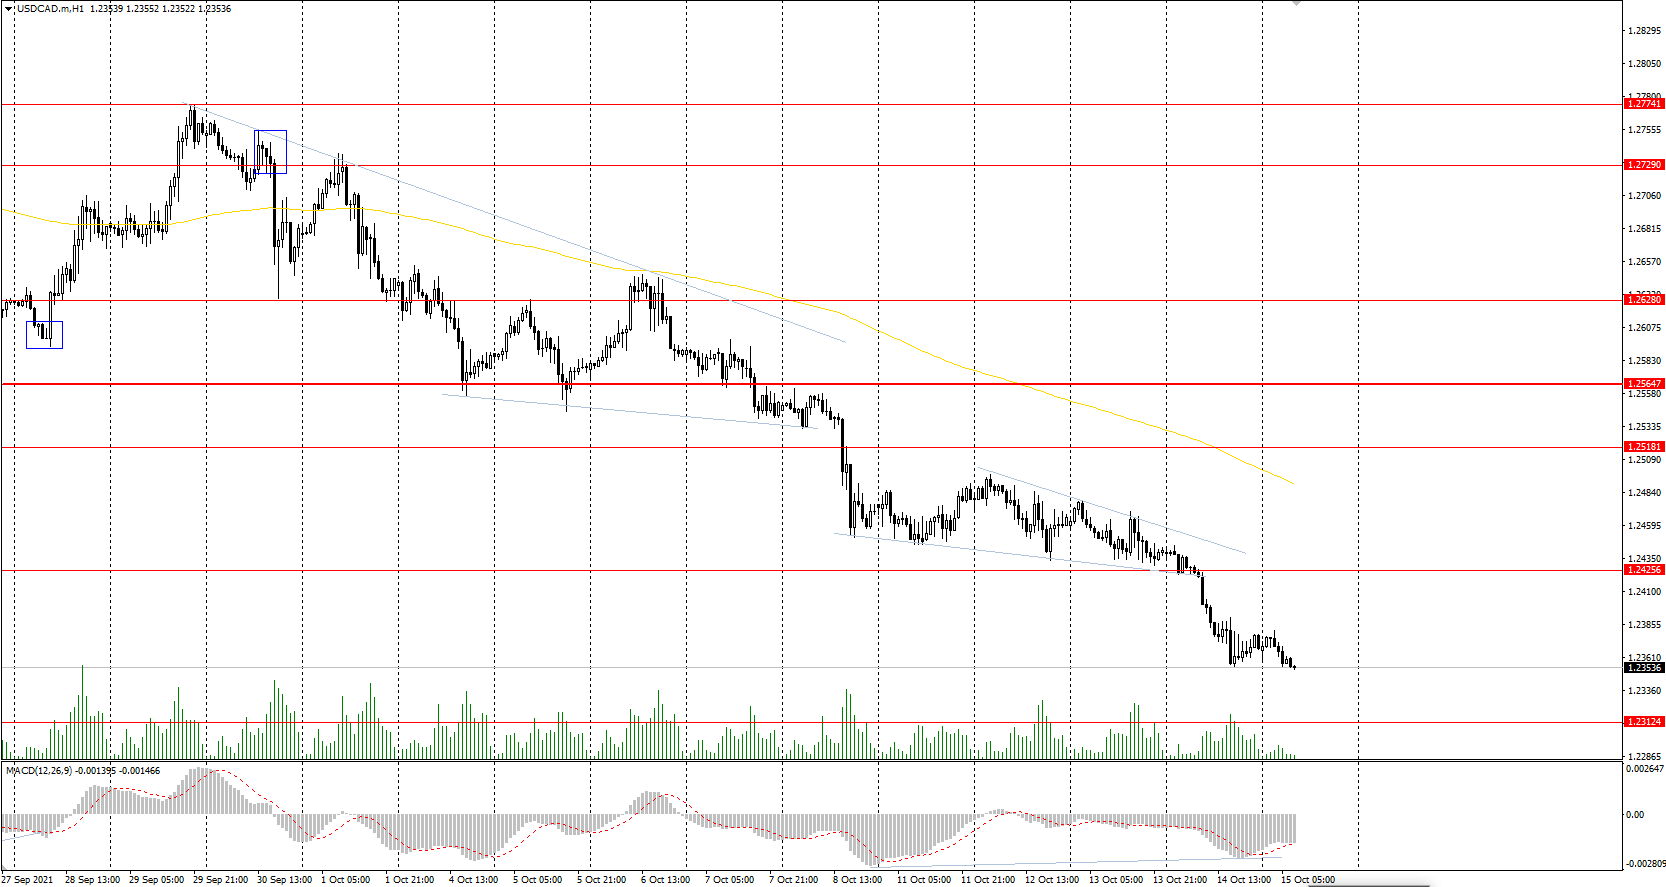
The USD/CAD currency pair
Technical indicators of the currency pair:
Prev Open: 1.2440
Prev Close: 1.2368
% chg. over the last day: -0.58%
The Canadian dollar is a commodity currency, so the USD/CAD currency pair is highly dependent on the dynamics of the dollar index and oil prices. The dollar index continues to decline, while oil prices slowly grow. As a result, the USD/CAD currency pair is declining due to US currency weakening.
Trading recommendations
Support levels: 1.2312
Resistance levels: 1.2425 1.2518, 1.2565, 1.2628, 1.2729, 1.2774
From the technical point of view, the trend of the USD/CAD currency pair is bearish. The narrowing triangle pattern turned out to be bearish. The MACD indicator has become negative, but there are still signs of divergence on higher time frames. Under such market conditions, it is better to look for sell deals from the resistance levels near the triangle pattern. Buy trades should be considered only on lower time frames from the support levels if there is the buyer’s initiative.
Alternative scenario: if the price breaks out through the 1.2565 resistance level and fixes above, the uptrend will more likely to resume.