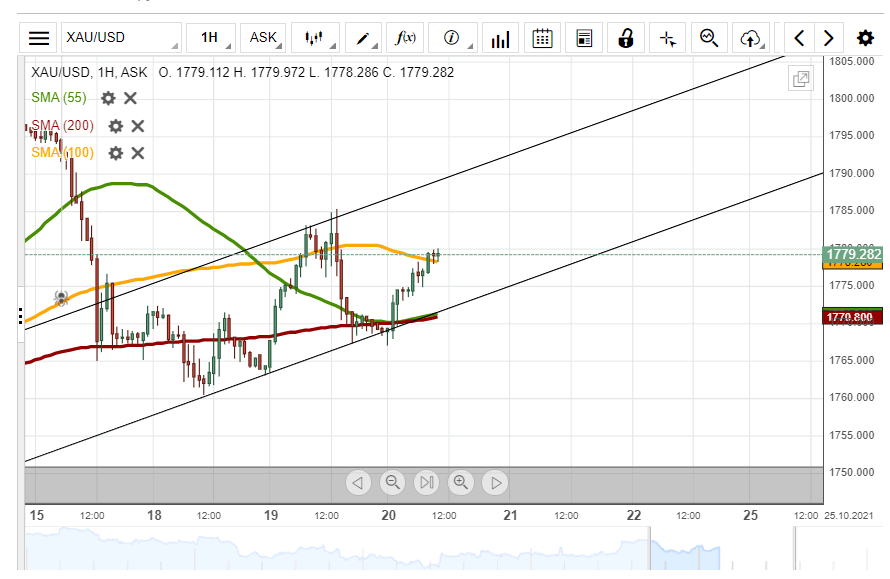
The sharp recovery of the yellow metal’s price turned into a sharp decline, as the price touched the 1,785.00 level. The following decline ended at GMT midnight to Wednesday. During these recent moves a channel up pattern was revealed. The pattern can be drawn by connecting the October 18, 19 and 20 low levels and setting the parallel line at the Tuesday’s high levels.
Meanwhile, note that it was already revealed on Monday that the bullion’s price is ignoring the support and resistance of the 55, 100 and 200-hour simple moving averages despite the SMAs impacting the price throughout history.
On Wednesday. in the near term future, the metal’s price was expected to continue to surge in the borders of the channel up pattern. Potential resistance to the price could be provided by the 1,780.00, 1,785.00 and 1,790.00 levels. Above these levels, the pair is more likely going to encounter the resistance line of the channel pattern.
Meanwhile, a decline of the metal could find support in the 1,775.00 mark before reaching the lower trend line of the channel up pattern. In addition, note that the previously ignored 55 and 200-hour simple moving averages were located at the trend line near 1,770.00.