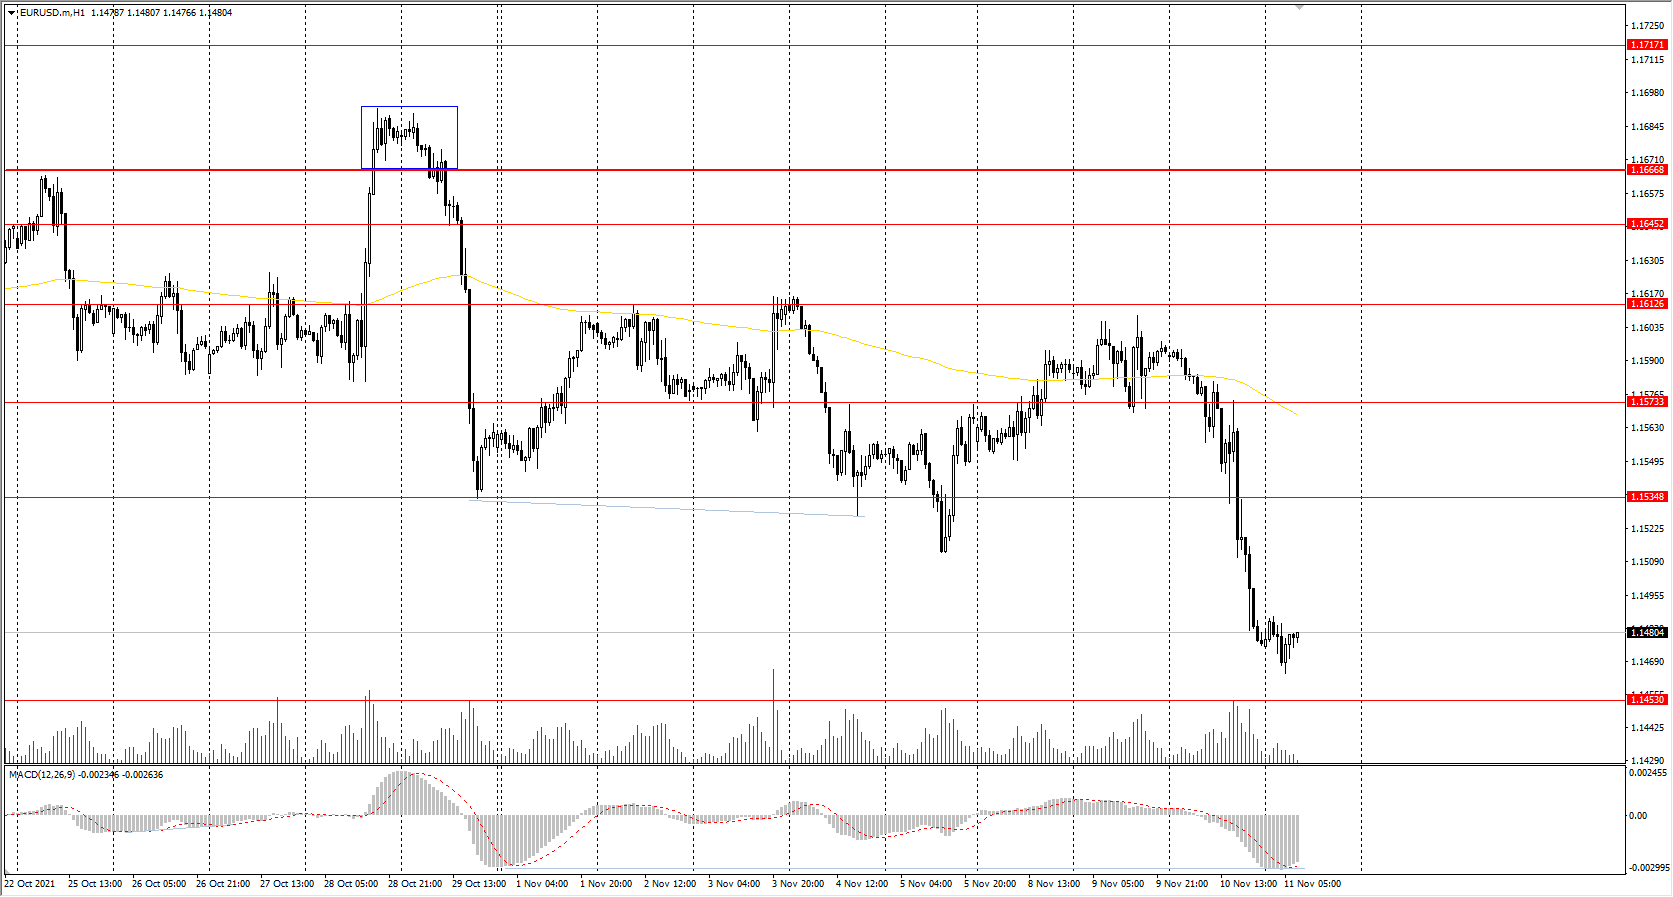
The EUR/USD currency pair
Technical indicators of the currency pair:
Prev Open: 1.1592
Prev Close: 1.1476
% chg. over the last day: -1.16%
The consumer price index in Germany increased to 4.6% in annual terms. And with a sharp rise in inflation in the US, the dollar index sharply increased, which had a negative impact on the European currency. It’s a bank holiday in the United States today, which will allow the market to calm down a bit, and the volatility in the American session will sharply decrease.
Trading recommendations
Support levels: 1.1453
Resistance levels: 1.1535, 1.1573, 1.1613, 1.1645, 1.1667, 1.1717, 1.1772
From the technical point of view, the EUR/USD on the hour time frame is bearish. The MACD indicator has become negative, but there is a divergence on the higher time frames. Under such market conditions, traders should consider sell positions from the resistance levels near the moving average, as the price has deviated strongly from the averages. Buy trades should be considered only from the support levels of the higher timeframe, given the buyer’s initiative.
Alternative scenario: if the price breaks out through the 1.1573 resistance level and fixes above, the mid-term uptrend will likely resume.
News feed for 2021.11.11:
- ECB Economic Forecasts at 12:00 (GMT+2).
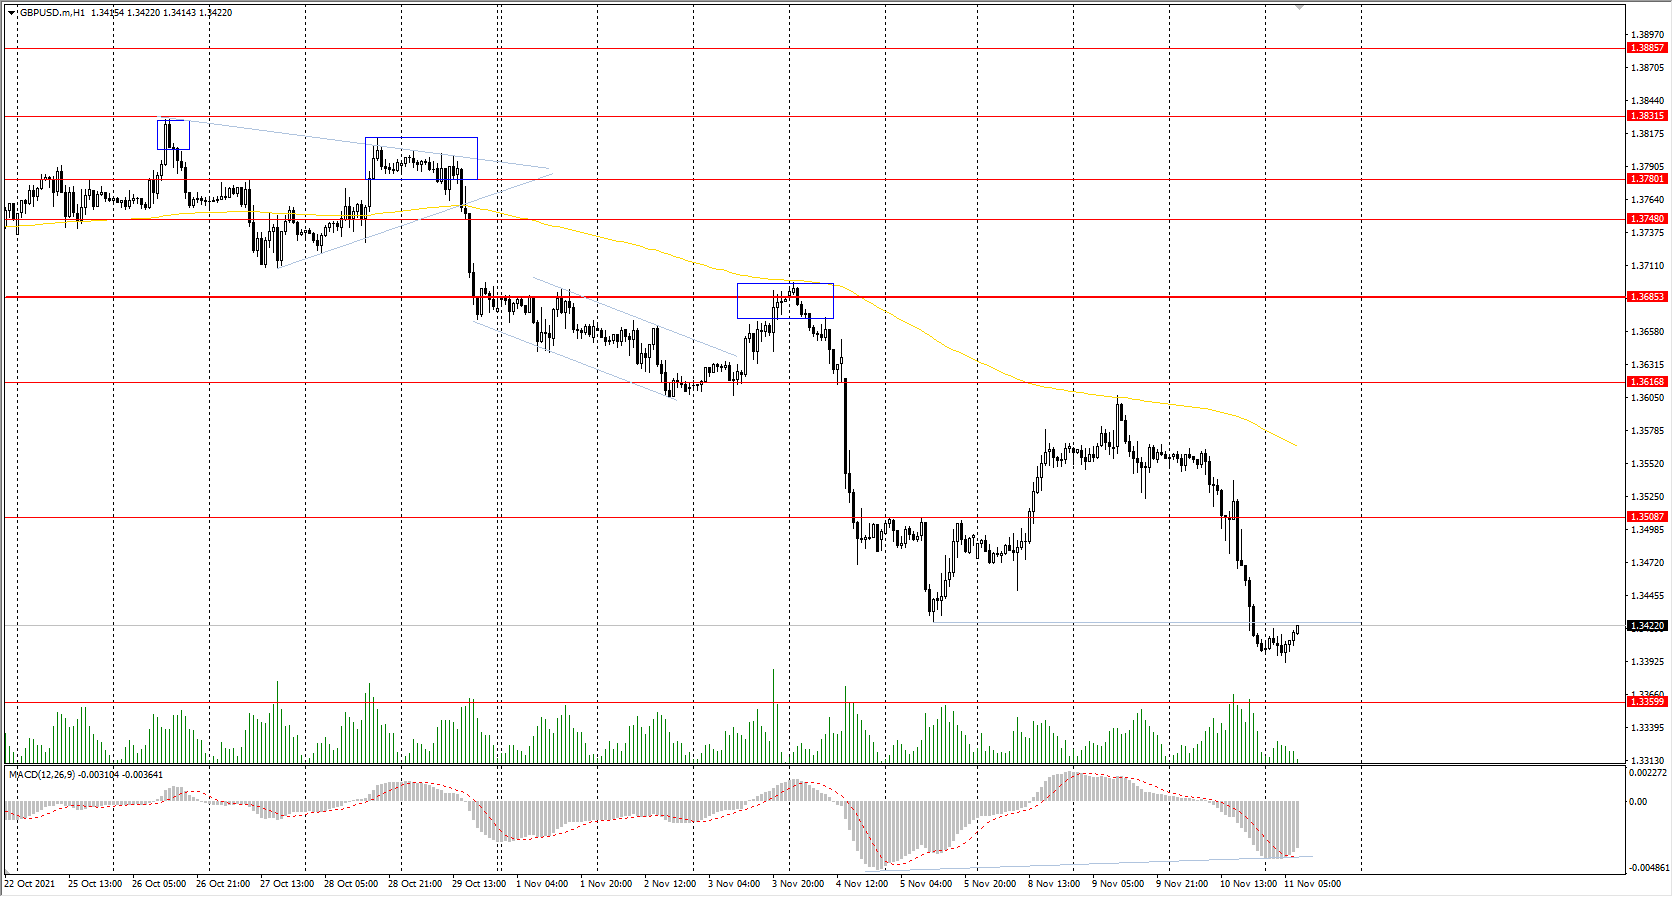
The GBP/USD currency pair
Technical indicators of the currency pair:
Prev Open: 1.3556
Prev Close: 1.3402
% chg. over the last day: -1.14%
According to Uswitch, more than half of UK households will be unable to pay their winter energy bills and are at risk to have their heating turned off. The fuel supply crisis and high gas prices have hit consumers hard. The Bank of England’s borrowing data shows a surge in consumer lending. All of this suggests that consumer inflation will continue to rise through the winter. And this is a serious reason for the Bank of England to raise interest rates.
Trading recommendations
Support levels: 1.3360
Resistance levels: 1.3508, 1.3616, 1.3685, 1.3748, 1.3780, 1.3831, 1.3886
On the hourly time frame, the trend on GBP/USD is bearish. The MACD indicator has become negative, but there is a divergence on the higher time frames. Under such market conditions, traders should consider sell positions from the resistance levels near the moving average, as the price has deviated strongly from the averages. Buy trades should be considered only from the support levels of the higher timeframe, given the buyer’s initiative.
Alternative scenario: if the price breaks out through the 1.3617 resistance level and consolidates above, the bullish scenario will likely resume.
News feed for 2021.11.11:
- UK GDP (q/q) at 09:00 (GMT+2);
- UK Industrial Production (m/m) at 09:00 (GMT+2);
- UK Manufacturing Production (m/m) at 09:00 (GMT+2).
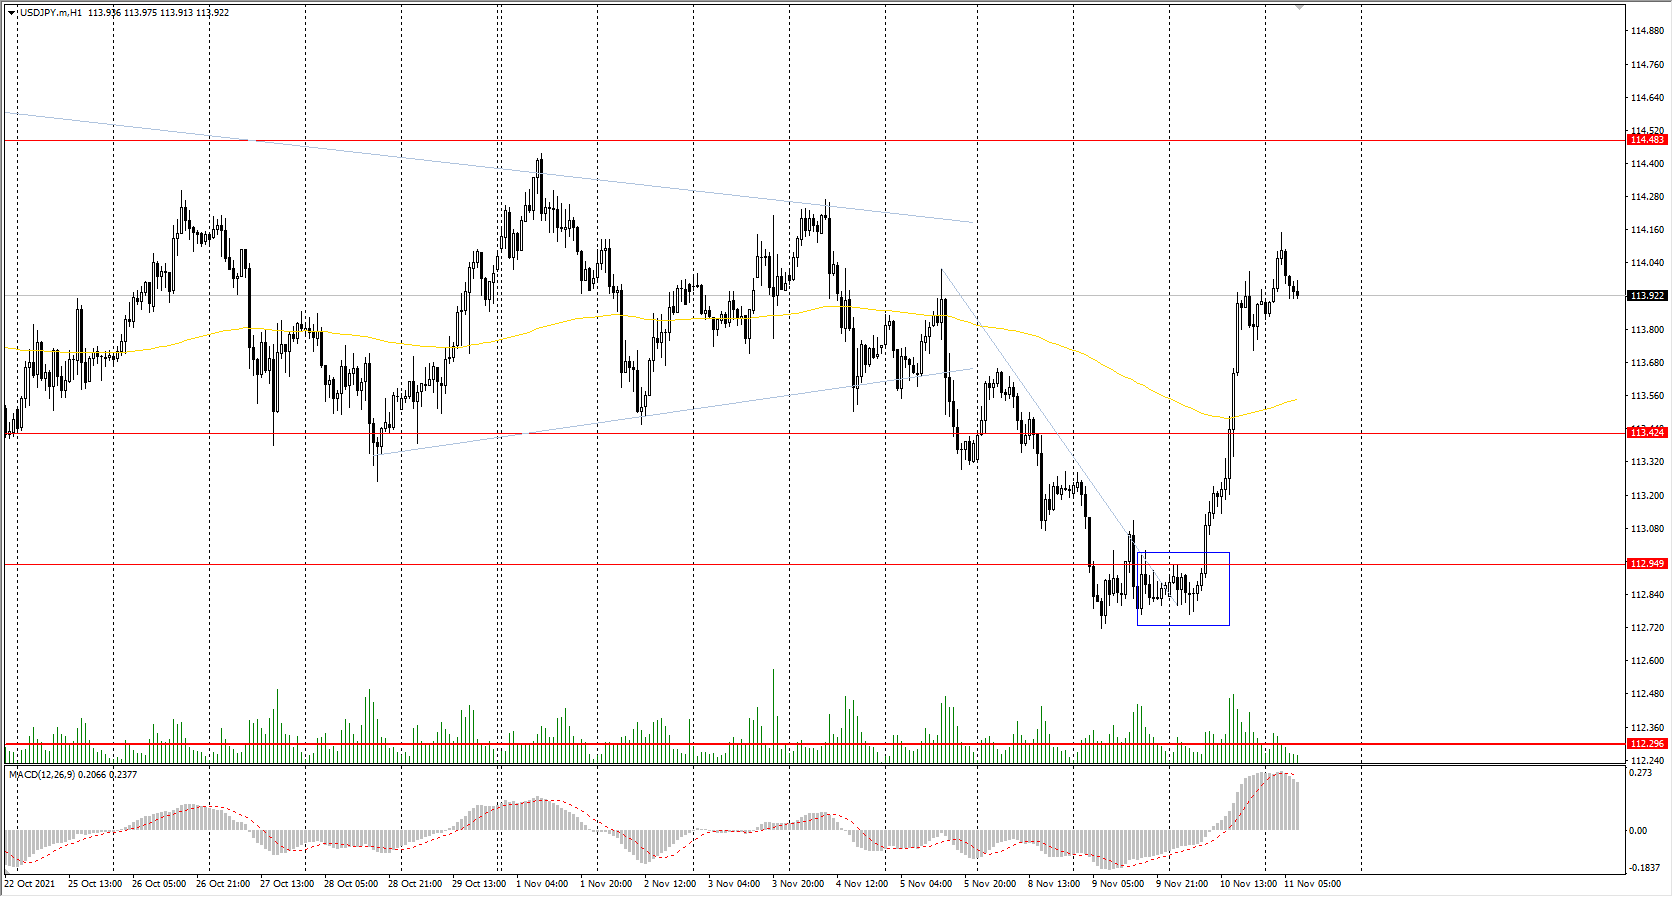
The USD/JPY currency pair
Technical indicators of the currency pair:
Prev Open: 112.83
Prev Close: 113.90
% chg. over the last day: +0.95%
At the moment, there are no fundamental reasons for the USDJPY quotes to go down in the mid-term. It’s caused by that the Bank of Japan has kept its monetary policy soft until the end of the year. In addition, the Fed has been already cutting QE and is likely to accelerate cuts due to a sharp rise in inflation.
Trading recommendations
Support levels: 113.42, 112.95, 112.30, 111.53, 110.99, 110.65
Resistance levels: 114.48, 115.15
The global trend on the USD/JPY currency pair is bullish. The local trend has also changed to upward. Under such market conditions, it’s better to look for buy positions from the buyers’ initiative zone around the moving average. Sell positions should be considered from the resistance levels of higher time frames, given there is sellers’ initiative.
Alternative scenario: if the price falls below 112.30, the uptrend will likely be broken.
News feed for 2021.11.11:
- Japan Industrial Production (m/m) at 04:00 (GMT+2).
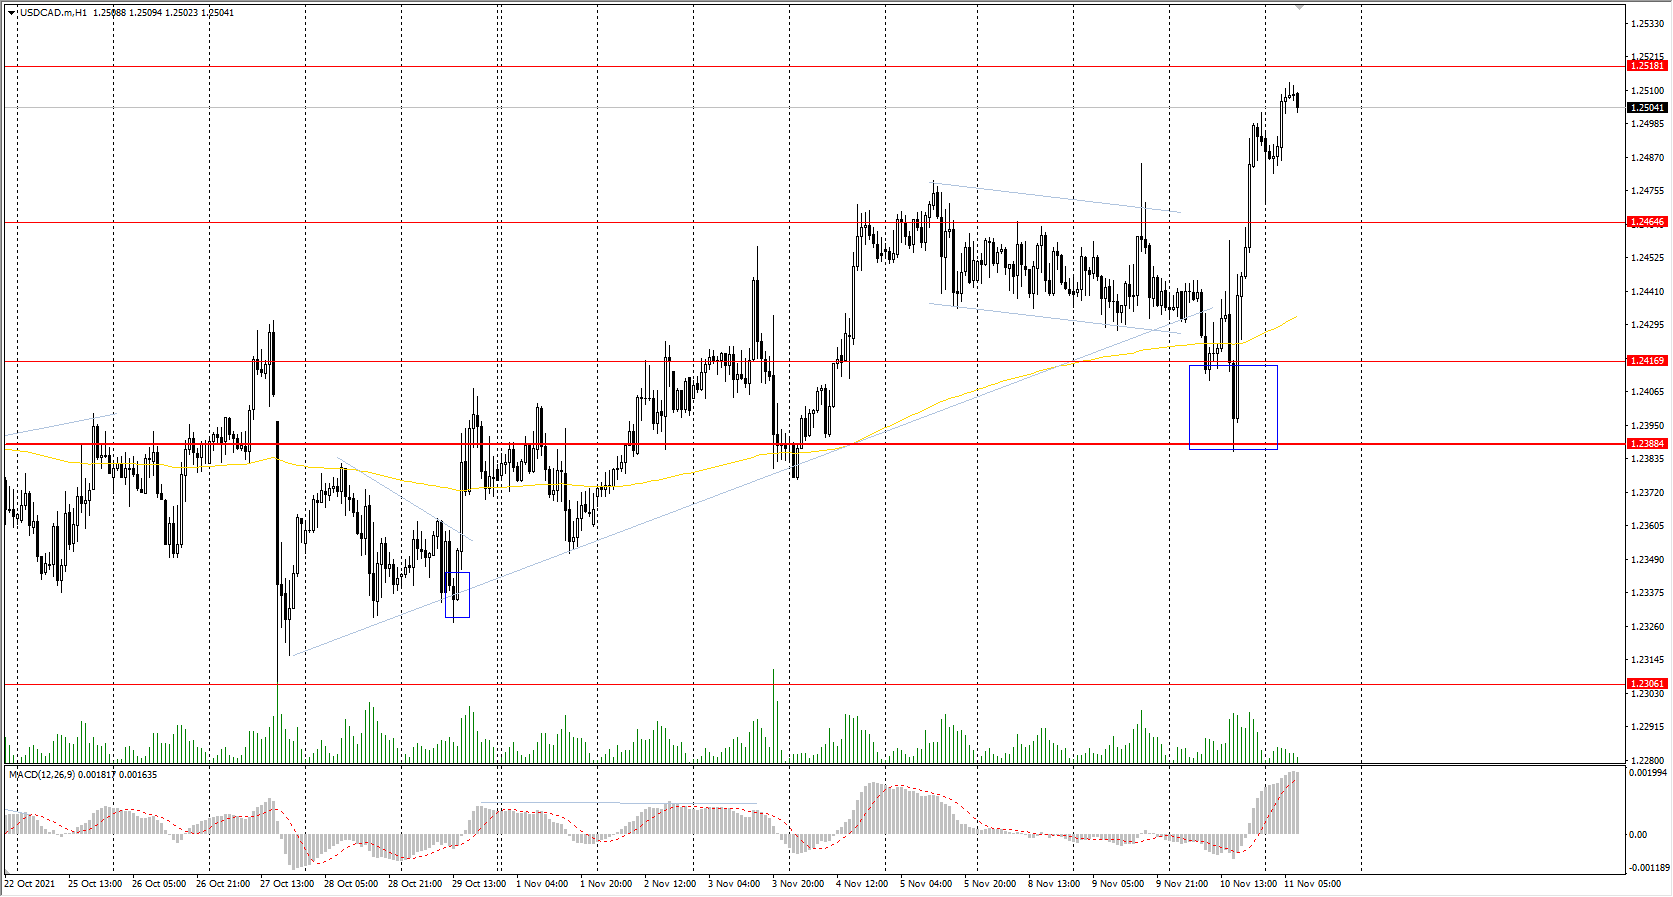
The USD/CAD currency pair
Technical indicators of the currency pair:
Prev Open: 1.2436
Prev Close: 1.2493
% chg. over the last day: +0.46%
The Canadian dollar is a commodity currency, so the USD/CAD currency pair highly depends on the dynamics of the dollar index and oil prices. Yesterday, the dollar index sharply increased against the background of the inflation growth in the USA, which led to the sharp growth of USD/CAD quotes. In the medium term, only a sharp increase in oil prices or an increase in interest rates by the Bank of Canada can neutralize the growth of USD/CAD quotes.
Trading recommendations
Support levels: 1.2465, 1.2417, 1.2388, 1.2306, 1.2260
Resistance levels: 1.2518, 1.2565, 1.2628, 1.2729, 1.2774
From a technical point of view, the trend of the USD/CAD currency is bullish. The MACD indicator has become positive, with no signs of reversal. Under such market conditions, it is better to look for buy trades from the support levels, given there is the buyers’ initiative. Sell deals should be considered from the resistance levels of the higher time frame.
Alternative scenario: if the price breaks down through the 1.2388 support level and fixes below, the downtrend will likely resume.