
A note on lower timeframe confirming price action…
Waiting for lower timeframe confirmation is our main tool to confirm strength within higher timeframe zones, and has really been the key to our trading success. It takes a little time to understand the subtle nuances, however, as each trade is never the same, but once you master the rhythm so to speak, you will be saved from countless unnecessary losing trades. The following is a list of what we look for:
- A break/retest of supply or demand dependent on which way you’re trading.
- A trendline break/retest.
- Buying/selling tails … essentially we look for a cluster of very obvious spikes off of lower timeframe support and resistance levels within the higher timeframe zone.
- Candlestick patterns. We tend to only stick with pin bars and engulfing bars as these have proven to be the most effective.
We typically search for lower-timeframe confirmation between the M15 and H1 timeframes, since most of our higher-timeframe areas begin with the H4. Stops are usually placed 1-3 pips beyond confirming structures.
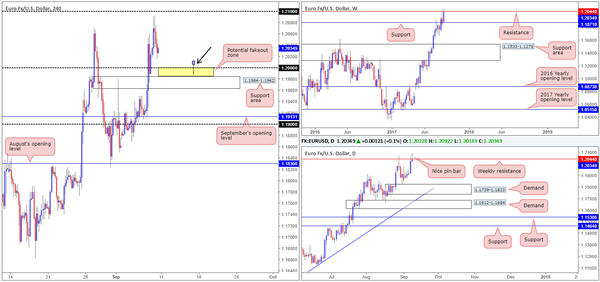
EUR/USD
Weekly gain/loss: + 173 pips
Weekly closing price: 1.2034
Over the course of last week’s trading, the single currency maintained a bullish posture from weekly support pegged at 1.1871. Rallying close to 200 pips on the week, the move chalked up a fresh high of 1.2092 and revisited weekly resistance at 1.2044. Interestingly, the weekly USDX chart shows price violated support at 11854 and now looks poised to press its way down to support marked at 11687 (converges with a long-term trendline support taken from the low 9322). Should this come to fruition, this could lead to the EUR breaking through the current weekly resistance and pushing as far north as the weekly broken Quasimodo line at 1.2287 (the next upside target – not seen on the screen).
Turning our attention to the daily candles, Friday’s movement formed a tasty-looking bearish selling wick that pierced through the current weekly resistance. Although the EUR is trending with a reasonably strong upside bias right now, this candlestick formation has likely garnered some attention. Over on the USDX daily chart, we can see that the unit also touched gloves with a daily channel support extended from the low 12352, but failed to produce much of a bullish buying tail. A selloff from current price (EUR) could see the major retest demand printed at 1.1739-1.1823.
A quick recap of Friday’s trading on the H4 chart shows price topped at 1.2092 during the early hours of Europe, and ended the day in negative territory. To the downside, the next area of interest is the large psychological barrier 1.20, followed closely by a support area positioned at 1.1984-1.1962. In between these two structures, we’ve shaded the area in yellow to represent a potential fakeout zone. Why? Well, psychological numbers have a tendency to be whipsawed (a fakeout), and the yellow area is likely where you’ll see this occur should it happen. A quick glance at the USDX H4 chart, nevertheless, sees price trading from resistance at 11787 with room to stretch as far down at 11728: a H4 Quasimodo support level not seen on the screen. Therefore, there’s a chance we may see EUR H4 bulls come into the fray before connecting with 1.20.
Suggestions: So, let’s run through what we have here:
Weekly resistance at 1.2044 – strong uptrend.
Daily pin bar at weekly resistance.
H4 nearing 1.20 – possible fakeout into a H4 support area at 1.1984-1.1962.
Technically speaking, this is a rather difficult market to trade. No matter which direction one chooses there’s a downside! A long from 1.20 would have you buying in line with the current trend, but at the same time buying into weekly resistance. A sell on other hand is, at least in our view, countertrend, but in line with weekly structure and the daily pin bar.
Personally, given the strength of the uptrend and the lack of selling pressure seen from the noted weekly resistance, we would consider a long from 1.20 if, and only if, a H4 pin bar pierced into the fakeout zone, as drawn on the chart.
Data points to consider: No high-impacting news events scheduled for release today.
Levels to watch/live orders:
- Buys: 1.20 region ([looking for H4 price to fakeout through this number and close higher] stop loss: ideally below the fakeout candle’s low).
- Sells: Flat (stop loss: N/A).
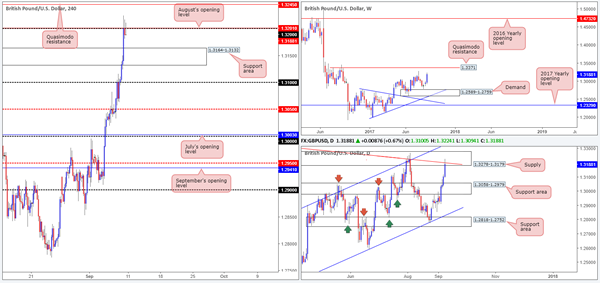
GBP/USD:
Weekly gain/loss: + 277 pips
Weekly closing price: 1.3188
With the USDX steam rolling its way through support at 11854 last week, the British pound just as aggressively rallied north. Downside on the USDX looks reasonably free for price to challenge support logged in at 11687, as does the GBP up to the weekly Quasimodo resistance level at 1.3371.
From Tuesday onwards last week a collection of daily bullish candles took shape, breaking through a resistance area at 1.3058-1.2979 and testing supply penciled in at 1.3278-1.3179 by the week’s end. Although this supply boasts a nice-looking trendline resistance taken from the high 1.3480, directly above you’ll notice that there’s also a channel resistance stretched from the high 1.2903. Something else that may be of interest is the USDX daily candles recently connected with a channel support extended from the low 12352.
Friday’s better-than-expected UK manufacturing production figures, coupled with a robust decline in the US dollar, sent the GBP soaring higher amid the London morning session. As you can see, the H4 resistance area at 1.3164-1.3132 was easily cleared, and it was only once the H4 candles struck 1.32 did the unit begin to mildly pare gains.
Suggestions: In essence, the nuts and bolts of this pair can be summed up as follows:
Weekly – room to move higher to 1.3371.
Daily – at supply with converging trendline resistance, channel resistance seen lurking above.
H4 – Bearish wicks printed from 1.32, possible move down to 1.3164-1.3132.
To sell, one has the 1.32 handle, daily supply and trendline resistance in favor. Despite this, against you there’s the possibility weekly price could move higher, as well as the next downside target on the H4 timeframe being positioned less than 30 pips away (1.3164-1.3132). This, for us at least, is not sufficient enough to warrant a short right now. Unfortunately, the same goes for longs. Yes, we may have weekly flow on our side, but buying into daily supply and psychological resistance is not really a trade we’d label high probability.
Data points to consider: No high-impacting news events scheduled for release today.
Levels to watch/live orders:
- Buys: Flat (stop loss: N/A).
- Sells: Flat (stop loss: N/A).
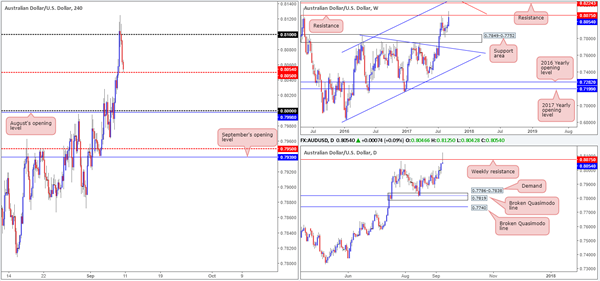
AUD/USD
Weekly gain/loss: + 91 pips
Weekly closing price: 0.8054
Since weekly price shook hands with the support area at 0.7849-0.7752 five weeks back, the commodity-driven currency has maintained a reasonably bullish posture. With the USDX seen selling off and breaking through a key support at 11854 last week, this propelled the Aussie up to resistance drawn from 0.8075.
A closer look at price action on the daily timeframe shows that Friday’s trade chalked up a nice-looking bearish pin bar (similar to that on the EUR/USD) from the noted weekly resistance. Also prominent is the USDX daily candles recently linked with a channel support drawn from the low 12352. To our way of seeing things, downside (AUD) looks relatively cramped on the daily scale with little clear demand seen until we revisit the 0.7786-0.7838 area.
Looking at Friday’s trade on the H4 timeframe, the 0.81 handle suffered multiple attacks in early trading, but managed to hold ground and eventually push lower. The move, as can be seen on the chart, brought price into contact with mid-level support at 0.8050 by the close.
Suggestions: With weekly resistance at 0.8075 now in the picture, watch for H4 buyers to be taken out at 0.8050 today. A decisive H4 close beyond this number – coupled with a retest and a reasonably sized H4 bearish candle in the shape of a full, or near-full-bodied formation – would be enough for our desk to initiate a short trade, targeting the key 0.80 level/August’s opening line at 0.7998 as an initial take-profit base.
Data points to consider: No high-impacting news events scheduled for release today.
Levels to watch/live orders:
- Buys: Flat (stop loss: N/A).
- Sells: Watch for H4 price to engulf 0.8050 and then look to trade any retest seen thereafter ([waiting for a H4 bearish candle – preferably a full-bodied candle – to form following the retest is advised] stop loss: ideally beyond the candle’s wick).
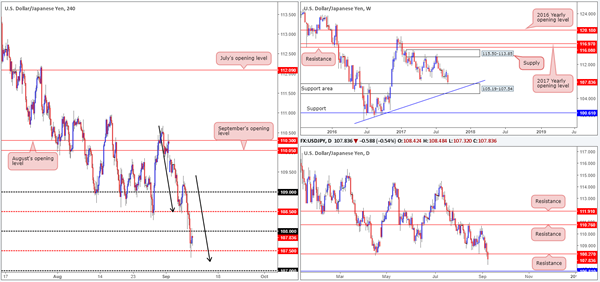
USD/JPY:
Weekly gain/loss: – 239 pips
Weekly closing price: 107.83
The USD/JPY shredded almost 250 pips of value amid trade last week, bringing weekly price down to the top edge of a support area formed at 105.19-107.54. Although we believe the pair is likely to find a bottom here with it having been a relatively strong barrier since 2014, there’s a chance the unit may dig a little deeper since USDX weekly action shows room to decline down to support at 11687 (converges with a long-term trendline support taken from the low 9322). Daily movement, however, ended the week crossing below support at 108.27 (now acting resistance), possibly opening up downside to support at 106.81.
Reviewing Friday’s movement on the H4 timeframe shows that the 108 handle was wiped out, leaving price free to greet mid-level support at 107.50, and greet it did. The bounce from 107.50 bid price back up to 108, which, as you can see, held firm as resistance during the later hours of NY. The other key thing to note here is the AB=CD formation (black arrows) that completes around the 107.25 mark.
Suggestions: Given weekly price is trading from a recognized support area and H4 price printed a nice-looking AB=CD approach, this week’s spotlight will firmly be focused on longs. However, as there’s marginal risk of downside to daily support at 106.81, we will need to see H4 price close above 108 before our team looks at buying this market. A retest of 108 as support, followed by a lower-timeframe confirming signal (see the top of this report) would be ideal.
Data points to consider: No high-impacting news events scheduled for release today.
Levels to watch/live orders:
- Buys: Watch for price to engulf 108 and then look to trade any retest seen thereafter ([waiting for a lower-timeframe confirming signal to form following the retest is advised] stop loss: dependent on where one confirms this number).
- Sells: Flat (stop loss: N/A).
USD/CAD:
Weekly gain/loss: – 236 pips
Weekly closing price: 1.2156
After hammering its way through a weekly trendline support etched from the low 0.9633, the USDCAD sustained further losses last week (fourth consecutive losing week) and placed the pair around the top edge of a weekly demand at 1.1919-1.2074. According to the USDX weekly chart though, dollar bulls may struggle here as price shows space to extend down to weekly support at 11687.
While we have seen a small bullish response from the noted weekly demand, daily price shows further upside could be challenging given a nearby broken Quasimodo line at 1.2201. A close above this daily hurdle does not really make things any better either since there’s a neighboring resistance area derived at 1.2303-1.2423.
Interestingly, H4 price ended Friday’s segment printing a full-bodied bullish close above 1.2150. This, technically speaking, has likely confirmed upside strength to the 1.22 handle, which is positioned just one pip below the aforementioned broken daily Quasimodo line.
Suggestions: Drill down to the lower timeframes and wait for a retest of 1.2150 to take place. Should this come to fruition and structure chalks up a lower-timeframe confirming buy signal (see the top of this report for more information), there could be an opportunity to buy this market up to 1.22 as an initial take-profit line. Just make sure you have adequate risk/reward at the first target, since the broken daily Quasimodo line, coupled with a strong down trending market, could eventually force price much lower.
Data points to consider: No high-impacting news events scheduled for release today.
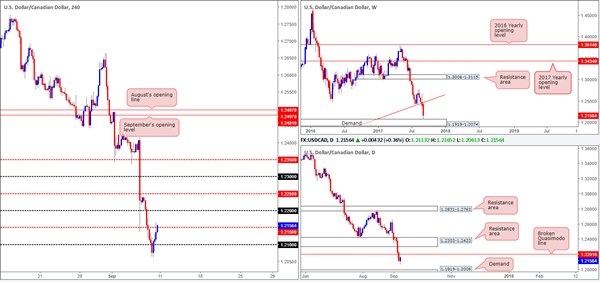
Levels to watch/live orders:
- Buys: 1.2150 region ([waiting for lower-timeframe confirming signal to form from here is advised] stop loss: dependent on where one confirms this number).
- Sells: Flat (stop loss: N/A).
USD/CHF:
Weekly gain/loss: – 202 pips
Weekly closing price: 0.9438
In spite of weekly price marginally closing beyond the walls of a support area at 0.9443-0.9515, this zone, at least in our opinion, is still in the picture. It would need a far more decisive breach before we could conclude that downside is on the cards. However, one still may want to take into account that the USDX weekly candles show support at 11854 was taken out last week, and therefore may promote further selling down to support at 11687.
There’s a similar picture drawn on the daily timeframe, with a slight close being seen below support at 0.9444, which, as you can probably see, does in fact denote the lower edge of the weekly support area. In support of this level, nevertheless, daily USDX price shows the unit trading from a channel support taken from the low 12352.
Moving across to the H4 timeframe, Friday’s closing candle breached the mid-level support at 0.9450 by twelve pips. On this scale, this is a reasonably respectable close, in our view, and therefore could expose the unit to further downside to the 0.94 handle today. Everything considered though, we would not contemplate selling this market at current price, largely due to the bigger picture (see above).
Suggestions: In light of the above notes, we feel laying low and remaining on the sidelines may be the better path to take at this time. There is, according to our trade plan, very little on offer right now.
Data points to consider: No high-impacting news events scheduled for release today.
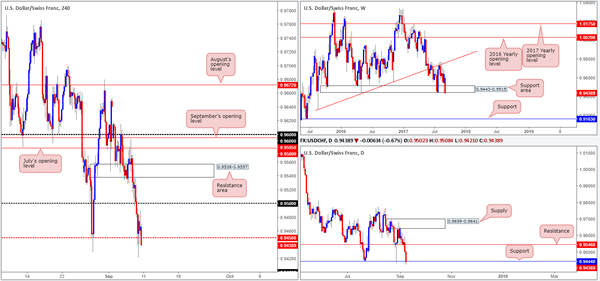
Levels to watch/live orders:
- Buys: Flat (stop loss: N/A).
- Sells: Flat (stop loss: N/A).
DOW 30:
Weekly gain/loss: – 169 points
Weekly closing price: 21808
Recent dealings show US equities remained afloat above weekly demand at 21462-21645 last week, despite ending in the red. With little overhead resistance to contend with on the weekly timeframe, a fresh record high could be achieved this week!
On the other side of the coin, nonetheless, the daily candles show price loitering mid-range between support at 21664 and supply at 22076-21929. Clearly, for weekly bulls to gravitate to fresh highs, offers at this supply need to be consumed beforehand.
Turing our attention to the H4 timeframe, support at 21723 has played a major part in recent trade, with bulls driving price higher from here going into the early hours of US trading on Friday. Providing that the buyers remain in the driving seat here, the next upside target in view can be seen at August’s opening level drawn from 21913.
Suggestions: Given that the index remains entrenched within an incredibly strong uptrend, our bias continues to favor upside. Right now though, there’s little on the table offering a trade. A retest of the H4 support mentioned above at 21273 would be interesting if additional candle confirmation was seen in the form of full, or near-full-bodied candle. Apart from this, we would want to see the index drive above the current daily supply before any long-term buys were considered.
Data points to consider: No high-impacting news events scheduled for release today
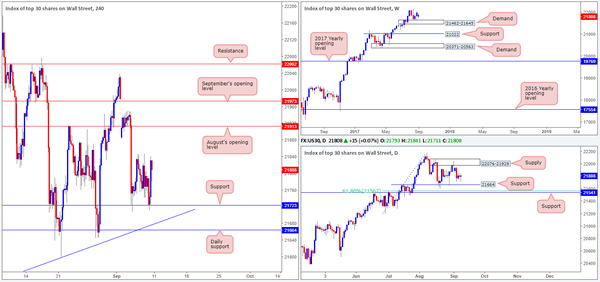
Levels to watch/live orders:
- Buys: 21723 region (waiting for a reasonably sized H4 bullish candle to form – preferably a full, or near-full-bodied candle – is advised] stop loss: ideally beyond the candle’s tail).
- Sells: Flat (stop loss: N/A).
GOLD:
Weekly gain/loss: + $21.4
Weekly closing price: 1346.0
Since early July, the yellow metal has been on a tear! Of late, we’ve seen weekly price drive through offers at resistance drawn from 1337.3 (now acting support), potentially opening up the trapdoor north to resistance visible at 1375.5. Also noteworthy is 1375.5 converges nicely with an AB=CD bearish formation (see black arrow), along with room seen for weekly USDX candles to equally push lower to support at 11687/long-term trendline support taken from the low 9322 (remember gold and the US dollar are typically inversely correlated markets).
Before weekly bulls can shake hands with the aforesaid resistance level, however, daily price will need to chomp through offers sited at supply carved from 1367.3-1354.2. The daily bearish selling wick seen from the area, nonetheless, could bring price down to retest the nearby weekly support mentioned above at 1337.3, before serious buyers step in.
A brief look at recent dealings on the H4 timeframe shows Friday’s action tagging resistance at 1356.2 in early European trading, ending the day with a loss. As USDX H4 candles are now seen retesting resistance at 11787, this could, technically speaking, lift the price of gold higher before we reach the aforementioned weekly support, which on the H4 scale you’ll see ties in closely with the 38.2% Fib support at 1334.8 from 1297.8.
Suggestions: Based on structure, we have absolutely no intention in becoming sellers right now for the following reasons:
Weekly price free to move up to weekly resistance at 1375.5.
Yes, there is a daily supply at 1367.3-1354.2 in play, but let’s also remember that nearby sits a weekly support just beneath it at 1337.3.
H4 USDX is trading from resistance at 11787 – could send the price of gold higher.
We would, however, consider looking at buying from the current weekly support level should price revisit this barrier. We know that by doing so we would effectively be entering long while daily price is selling off from supply, but we feel this may not cause too much of a problem, since the first take-profit target would be the H4 resistance at 1356.2 (essentially the underside of the daily supply).
To be on the safe side though, a trade long from 1337.3 would only be permitted should a reasonably sized H4 bull candle take shape (preferably a full, or near-full-bodied candle). Granted, this will not guarantee a winning trade, but what it will do is show buyer intent from a noted support.
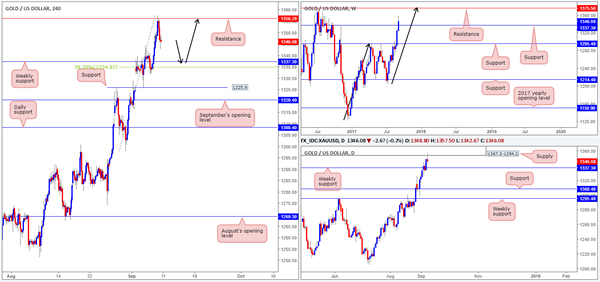
Levels to watch/live orders:
- Buys: 1337.3 region ([waiting for a H4 bullish candle to form is advised] stop loss: ideally beyond the candle tail).
- Sells: Flat (stop loss: N/A).


