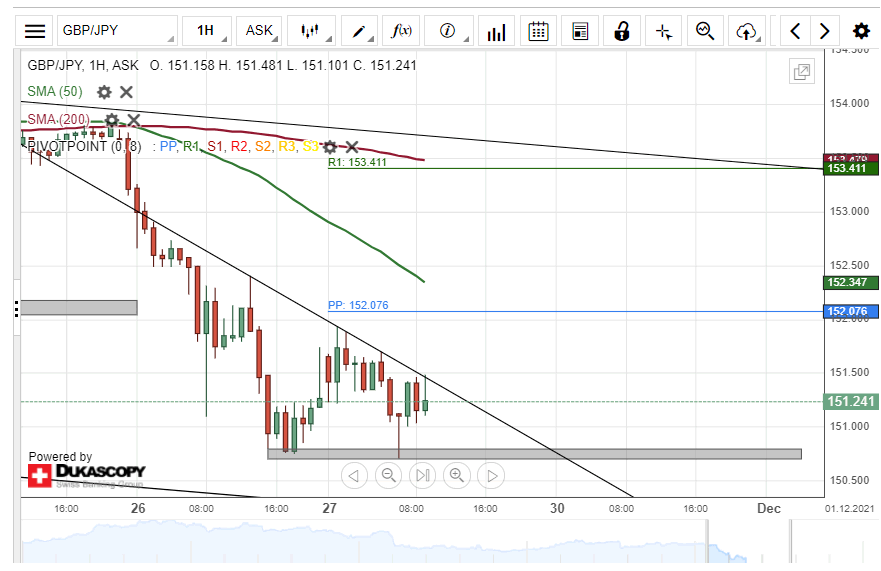
Since Thursday, the GBP/JPY currency exchange rate has been trading in the borders of a descending triangle pattern. Namely, the pair has been trading between a support zone at 150.70/150.80 and the resistance line that connects the Thursday and Friday high levels.
If the pair breaks out of the triangle to the upside, it could aim at the resistance of the 152.00 level, the weekly simple pivot point at 152.08 and the 50-hour simple moving average, which was approaching from above near the 152.30 level. Above these levels, most close by resistance could be found in the 152.50 level.
On the other hand, a break out to the downside might find support in the 150.00 mark and the lower trend line of a larger scale channel down pattern.