EUR/USD
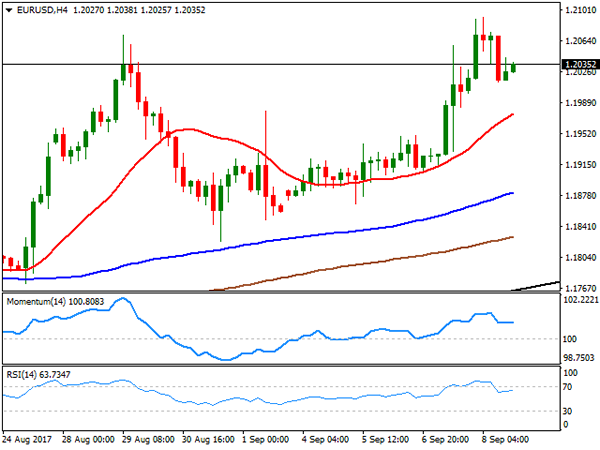
The EUR/USD pair posted its best weekly close for the year, ending at 1.2035, after the ECB’ monetary policy announcement on Thursday fueled demand for the common currency. The Central Bank left rates and the QE program unchanged, but in the press conference, head’s Draghi reckon that they will discuss how to unwind facilities next October. Even if policy makers decide to maintain QE in place until December, a couple of months´ delay doesn’t affect market’s mood towards the EUR, moreover as the greenback was unable to find its footing for one more week. Escalating tensions between the US and North Korea kept it subdued at the beginning of the week, falling further later on the back of soft macroeconomic data exacerbated by the damages produced by Hurricane Harvey last week. Hurricanes and tropical storms hit the US this weekend, and fears on how it would affect the real economy, also weighed on the greenback.
The pair topped at 1.2092 on Friday, retreating in the US afternoon on profit taking ahead of the weekend, but ending up with gains for the day. The bullish potential remains intact for the upcoming days, with investors now eyeing the upcoming Fed´s monetary policy meeting next September 19-20th. In the meantime, the daily chart shows that the 20 DMA has gained upward strength below the current level, whilst technical indicators have eased modestly from overbought readings, far from suggesting upward exhaustion. The long term daily ascendant trend line coming from 1.0603, comes around 1.1780, the level to break to talk about an interim top and a possible trend reversal. Shorter term, and according to the 4 hours chart, the risk is towards the upside, as the price settled well above all of its moving averages, with the shortest currently around 1.1975, and technical indicators having stabilized well into positive territory after correcting overbought conditions.
Support levels: 1.2010 1.1975 1.1940
Resistance levels: 1.2070 1.2105 1.2150
USD/JPY
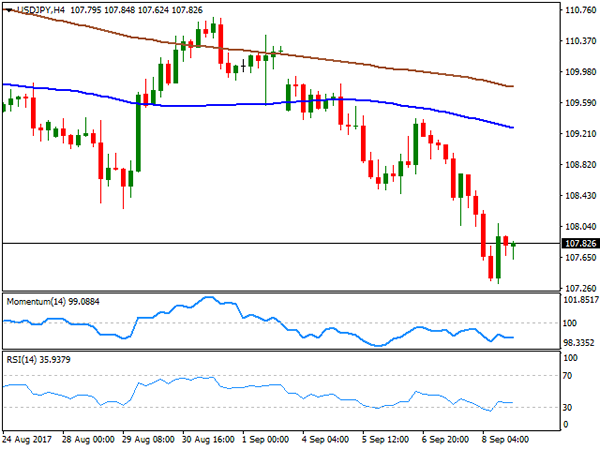
The USD/JPY pair plunged to a fresh 2017 low of 107.31 early Friday, as investors kept dumping the greenback following Thursday’s ECB announcement and rushed towards safety ahead of the storms that hit the US this weekend, and on dovish Fed speakers´ comments. US Treasury yields fell to their lowest since the November election, with the 10-year note benchmark touching 2.02% before ending the week at 2.06%. The yield for the 30-year note ended the week at 2.68%. This week will start with Japan releasing July trade balance and Machinery Orders figures, alongside with industrial data for August. From a technical point of view, the pair has room to extend its decline, having settled below the previous yearly low, and with the daily chart showing that the RSI indicator keeps heading south, around 36, as the 100 and 200 SMAs gain downward strength far above the current level. For the shorter term, the 4 hours chart shows that the price is also well below bearish moving averages, whilst technical indicators settled well into the red, after correcting extreme oversold conditions reached at the beginning of the day, also supporting a new leg lower ahead.
Support levels: 107.65 107.30 106.90
Resistance levels: 108.10 108.45 108.90
GBP/USD
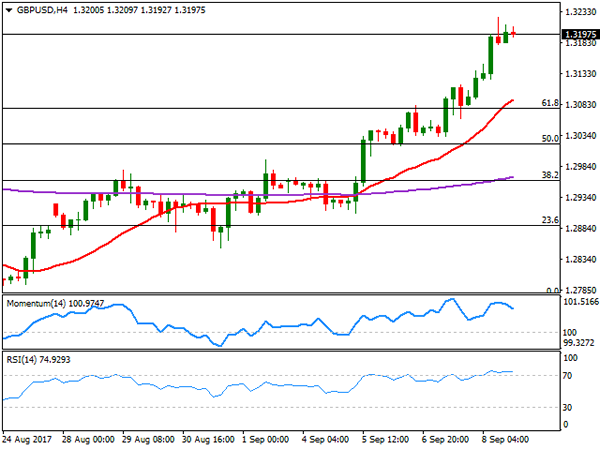
The Pound had its best week in over two months against the greenback, rising up to 1.3223 on Friday to settle around the 1.3200 mark. The UK currency got help from encouraging local data, as industrial production rose by 0.2% in July, while on yearly basis output rose 0.4%. Manufacturing production increased by 0.5% in the month, and by 1.9% when compared to a year earlier, a significant improve for the beginning of the third quarter. Also, the UK’s July goods trade deficit stood at £11.58 billion slightly below the £11.95 deficit expected. Anyway, market’s choice to dump the dollar was the main driver for the GBP/USD pair’s rally. Brexit headlines and the subsequent concerns have been left aside lately, but the lack of progress in negotiations hang over the Pound as a Damocles´ sword, and negative news could see the pair falling as quick as it rose these last few days. For now, the technical picture favors additional advances, as in the daily chart, technical indicators maintain their strong upward momentum, despite being in overbought territory, with a logical bullish target being 1.3266, August monthly high. In the 4 hours chart, the 20 SMA heads north below the current level, having surpassed the 61.8% retracement of the August decline around 1.3080, while technical indicators have lost upward strength, but remain within overbought territory, all of which maintains the risk towards the upside.
Support levels: 1.3180 1.3130 1.3090
Resistance levels: 1.3225 1.3665 1.3300
GOLD
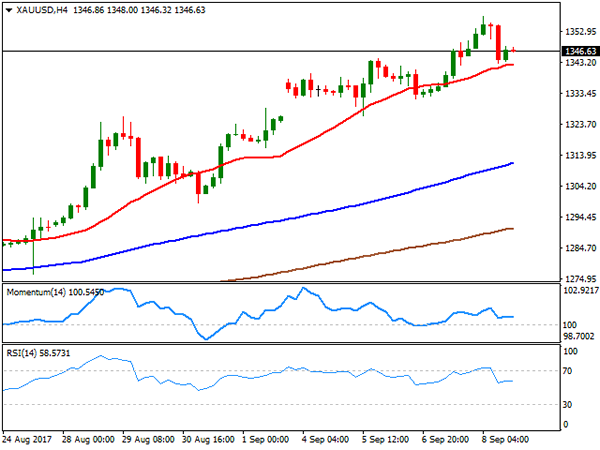
Spot gold closed Friday at $1,346.63 a troy ounce, up for the week, but flat on the day. The bright metal surged to 1,357.49, its highest since July 2017 on dollar’s sell-off, but corrected lower ahead of the close on profit taking. The metal is up for third consecutive week, as geopolitical jitters coupled with US Fed´s speakers dovish comments about the economy and possible upcoming rate hikes. The commodity may be traded with a cautious stance these upcoming days and ahead of Fed’s announcement, but the upside remains favored, as despite some possible relief upward corrections, there are no bases for a dollar’s appreciation. From a technical point of view, the daily chart shows that technical indicators keep hovering within overbought territory, whilst the price is far above a firmly bullish 20 SMA, this last around 1,310.00, all of which supports the ongoing bullish trend. In the 4 hours chart, the price settled above a bullish 20 SMA, this last around 1,342.70, providing an immediate support, while technical indicators stand directionless within positive territory.
Support levels: 1,342.70 1,331.60 1,325.00
Resistance levels: 1,352.55 1,363.40 1,372,90
WTI CRUDE OIL
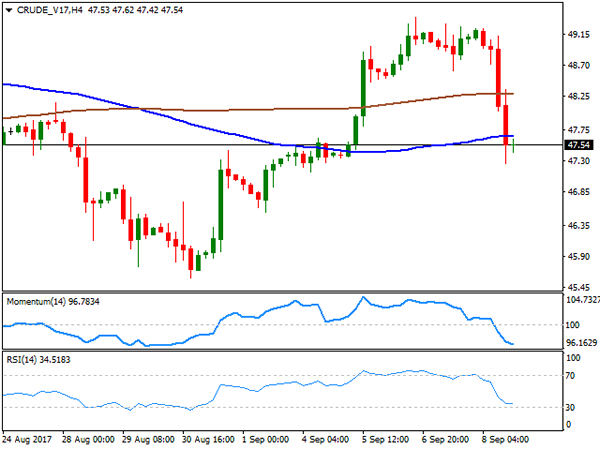
Crude oil prices plummeted on Friday to trim most of their weekly gains, amid news indicating that US refineries are recovering slowly from the destruction caused by Hurricane Harvey. Over 10% of US refinery capacity remained down, ahead of another batch of tropical storms hitting the country this weekend. West Texas Intermediate crude futures ended at $47.54 a barrel, after trading as highs as 49.40 mid-week. Additionally, the Baker Hughes report released on Friday shows that the number of active rigs drilling for oil fell just by 3, down to 756 for the week, somehow indicating that strong pumping will keep the market oversupplied. The daily chart shows that, after repeatedly failing to surpass its 200 DMA, the price plunged straight down to its 100 DMA, whilst technical indicators turned south, entering bearish territory, indicating that further declines are likely on a break below 47.20. In the 4 hours chart the price settled below its 100 and 200 SMAs, whist technical indicators stand near oversold readings, having barely lost their bearish strength, also supporting additional declines ahead.
Support levels: 47.20 46.60 36.10
Resistance levels: 48.10 48.70 49.40
DJIA
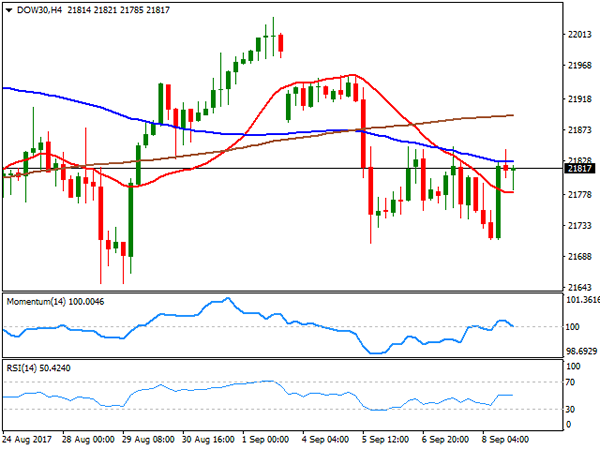
The Dow Jones Industrial Average managed to add 13 points on Friday to settle at 21,797.79, but the Nasdaq Composite and the S&P closed in the red, down to 6,360.19 and 2,461.43 respectively. Appetite for riskier assets among stocks traders was subdued ahead of the upcoming hurricanes that hit the US during the weekend, and fears of another missile test in North Korea. The weekend passed with the first having produced less damage that initially expected and with N. Korea quiet, which could lift market’s sentiment at the beginning of the week. Within the Dow, Travelers led, up 3.98%, followed by Home Depot that added 1.10%. The technology sector was the worst performer, with Apple leading losers , down 1.63%, followed by Wal-Mart that shed 1.55%. The daily chart shows that the index closed right below its 20 DMA for a third consecutive day, while technical indicators aim marginally higher within neutral territory, not enough to confirm further advances but limiting chances of a steeper decline. In the 4 hours chart, the index settled between its 20 and 100 SMAs, while technical indicators turned modestly lower within neutral territory, in line with a longer term perspective.
Support levels: 21,785 21,740 21,707
Resistance levels: 21,845 21,891 21,932
FTSE100
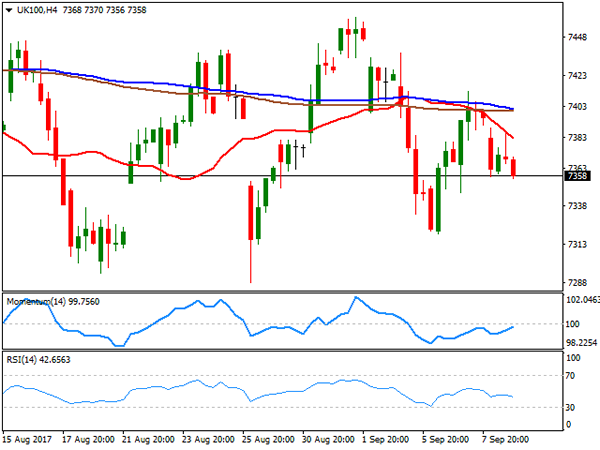
The FTSE 100 closed the week at 7,377.60, down on Friday by 19 points, and almost 1.0% for the week, with plummeting metals’ prices pressuring the mining-related sector. A stronger Pound, which surged to its highest in over a month, added pressure to the Footsie. BHP Billiton led decliners, as oil prices fell sharply, losing 3.77%, followed by Antofagasta that shed 3.72%. Anglo American, Rio Tinto and Fresnillo lost over 3% each. St. James’s Place was the best performer, adding 2.15%, while banks enjoyed a quiet data, with Barclay’s following, up 1.96%. The daily chart shows that the index remains lacking clear directional strength, still hovering around its 20 and 100 DMAs, having settled for the week below them, as technical indicators lost upward strength around their mid-lines. Shorter term, and according to the 4 hours chart, the risk is towards the downside, as the index settled below all of its moving averages, with the 20 SMA accelerating south and currently at offering a dynamic resistance at 7,382, as technical indicators hover within negative territory, with the RSI turning south around 42, anticipating some further slides for this Monday.
Support levels: 7,333 7,288 7,261
Resistance levels: 7,382 7,413 7,444
DAX
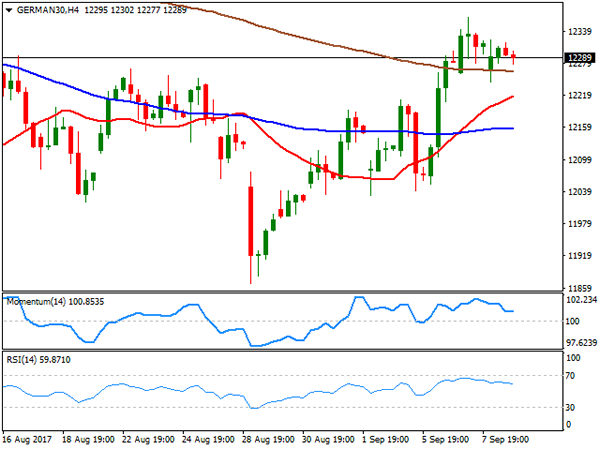
European equities closed little changed on Friday, easing at the end of the session amid fears over another missile test coming from North Korea and the hurricanes affecting the US Atlantic coast. The German DAX closed 7 points higher at 12,304.00, up anyway for the week, compliments to ECB’s positive outlook of the local economy. ThyssenKrupp was the best performer, up 1.67% for the week, followed by Commerzbank, which added 1.04%. ProSiebenSat.1 on the other hand, led decliners, down 1.27%, followed by Bayer that shed 0.90%. From a technical point of view, the daily chart shows that the index maintains a modestly positive stance, trading above its 20 and 200 DMAs, but lacking momentum, as technical indicators head nowhere within positive territory. In the 4 hours chart, the index settled above all of its moving averages, despite having retreated from its weekly high, whilst technical indicators also consolidate within positive territory.
Support levels: 12,241 12,207 12,166
Resistance levels: 12,301 12,342 12,383