
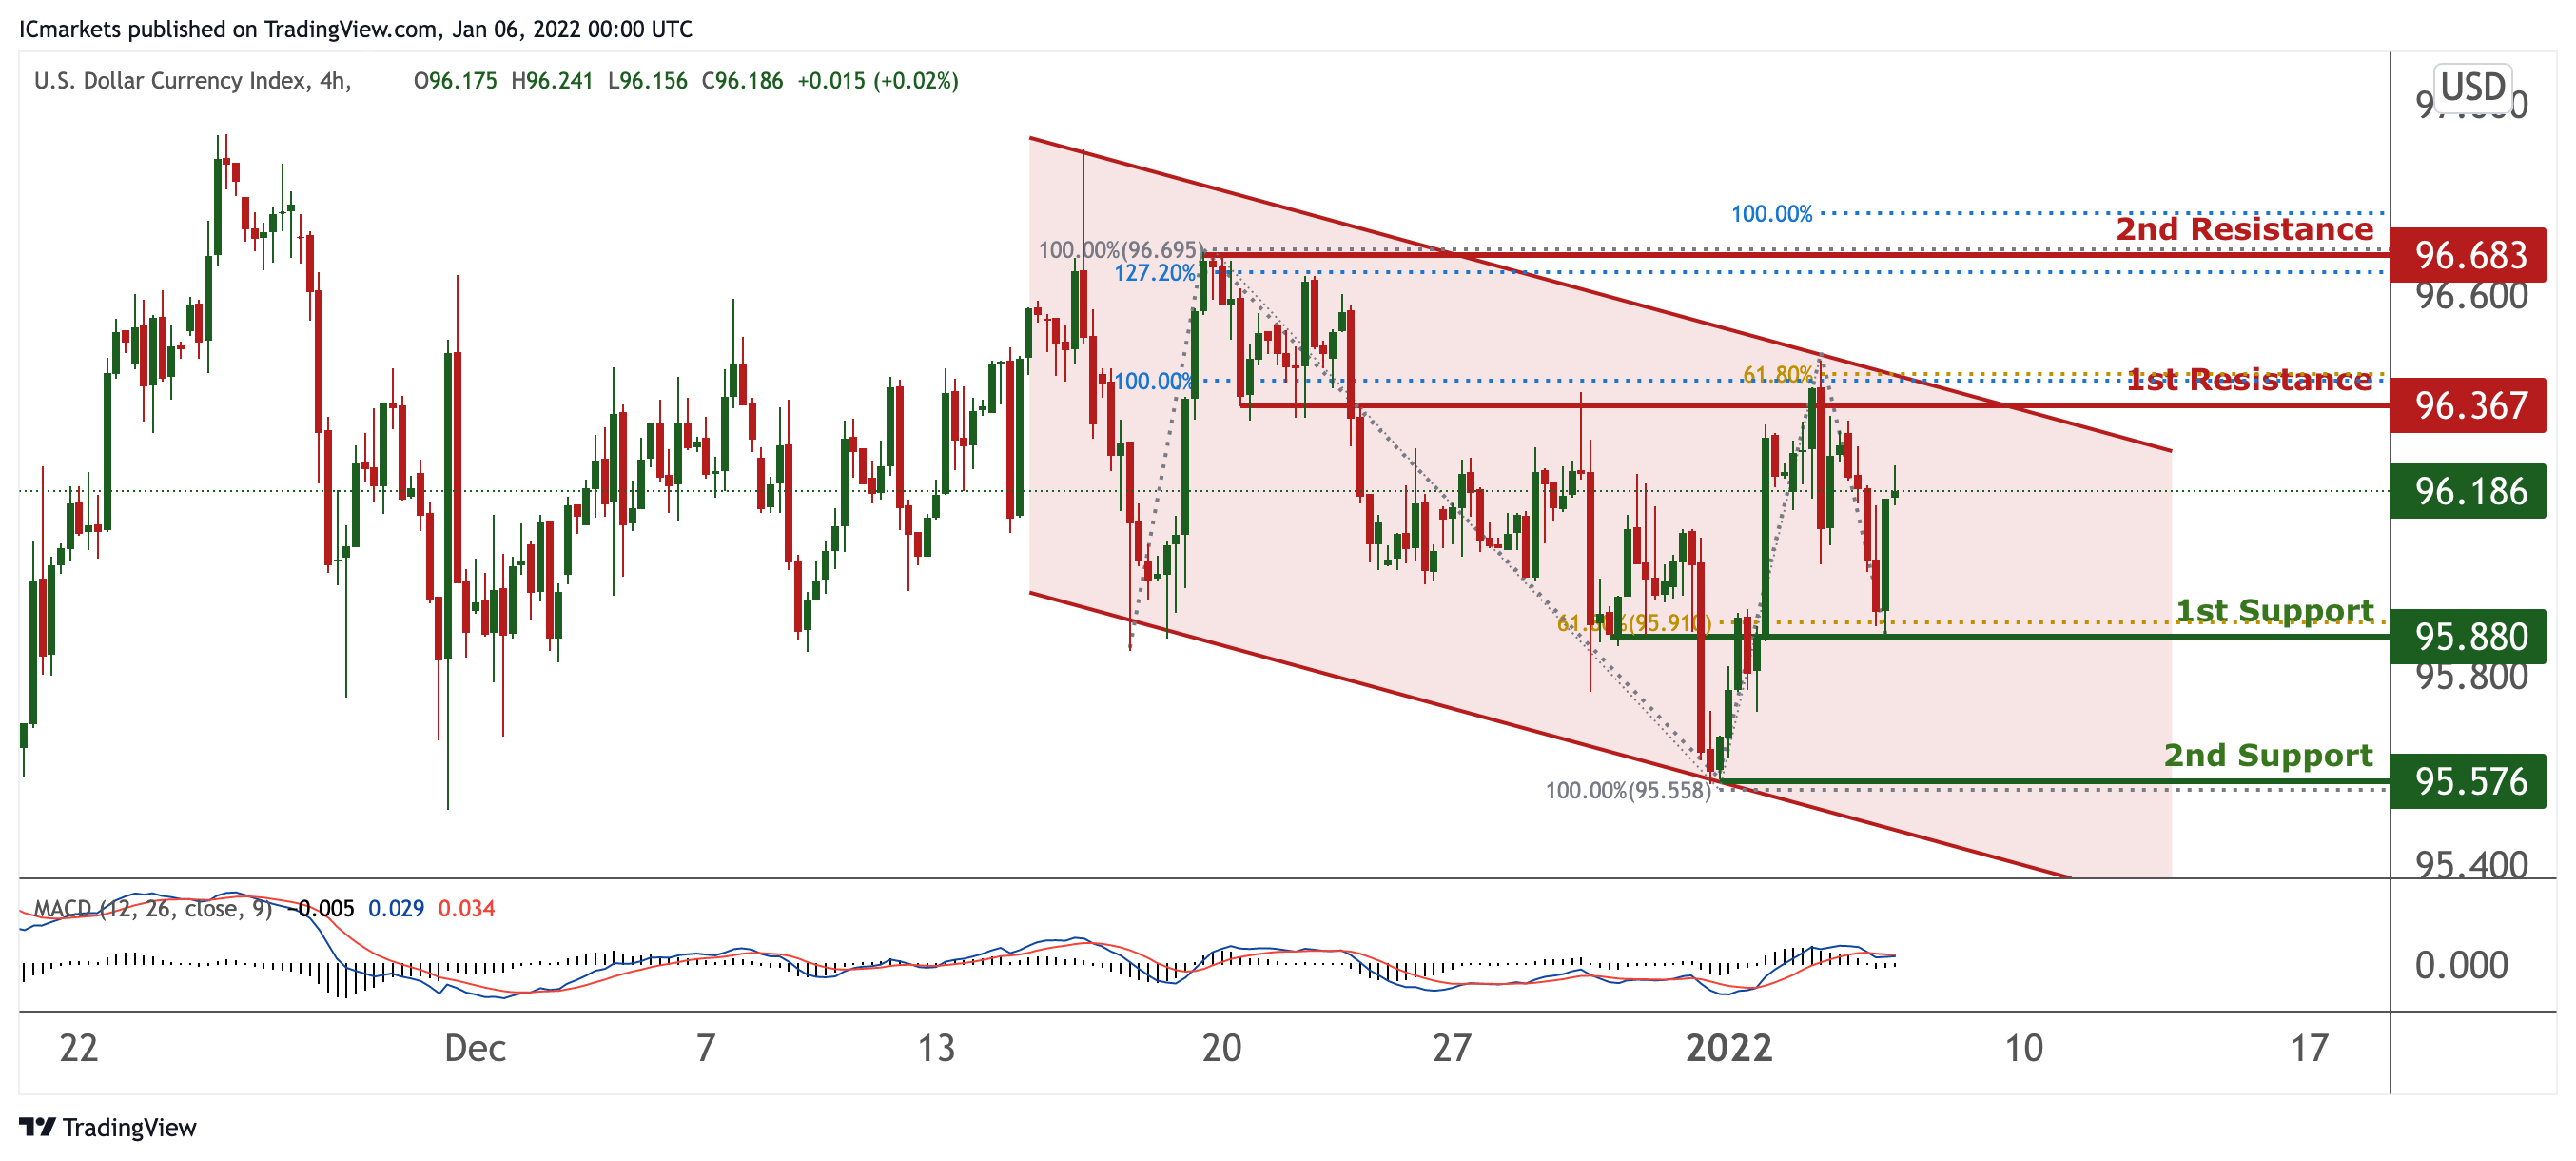
DXY:
On the H4, prices are on bearish momentum and abiding to our bearish channel. We see the potential for a dip from our 1st resistance at 96.367 in line with 100% Fibonacci extension and 61.8% Fibonacci retracement towards our 1st support in line 95.88 with 61.8% Fibonacci retracement. Our bearish bias is further supported by MACD, which is showing bullish momentum.
Areas of consideration:
- H4 time frame, 1st resistance at 96.467
- H4 time frame, 1st support at 95.88
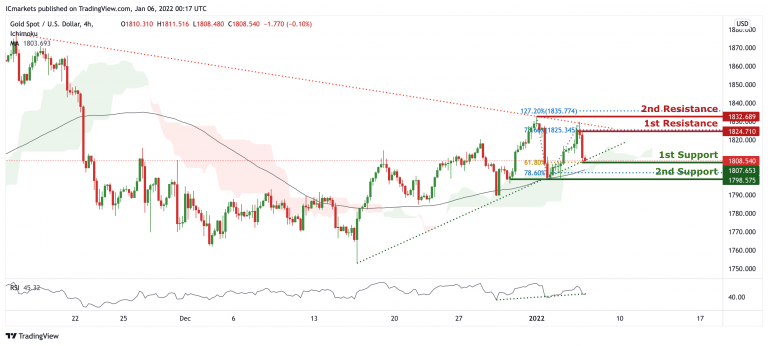
XAU/USD (GOLD):
On the H4, prices are on bullish momentum and consolidating in a triangle pattern. We see the potential for further upside from our 1st support at 1807.653 in line with 61.8% Fibonacci extension towards our 1st resistance at 1824.710 in line with 78.6% Fibonacci extension. Prices are trading our MA and also ichimoku clouds, and RSI are showing bullish momentum, further supporting our bullish bias. Alternatively, our stop loss will be placed at 2nd support at 1906.510 in line with 61.8% Fibonacci retracement.
Areas of consideration:
- H4 1st support at 1807.653
- H4 1st resistance at 1824.710
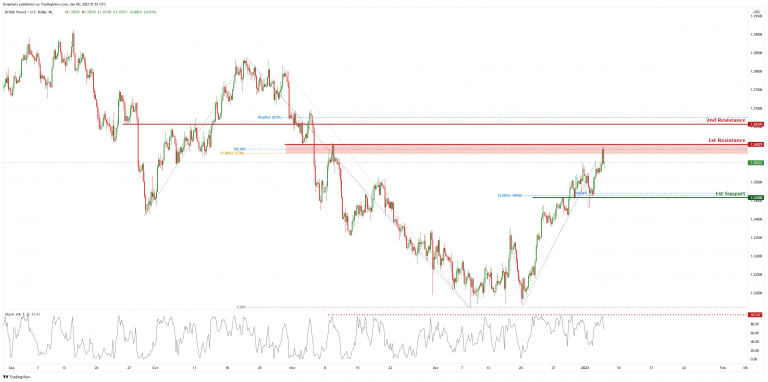
GBP/USD
On the H4 chart, price is currently heading towards the first resistance level of 1.36029 which is also 100% Fibonacci projection and 61.8% Fibonacci retracement. Price can potentially dip to the 1st support level of 1.34588 which is also 23.6% Fibonacci retracement and 100% Fibonacci projection. Our bearish bias is supported by the stochastic indicator as it is near resistance level.
Areas of consideration:
- H4 1st resistance at 1.36029
- H4 1st support 1.34588
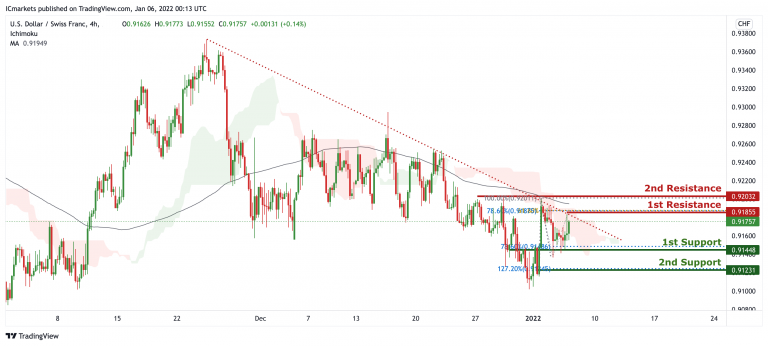
USD/CHF
In reference to yesterday’s analysis, prices are on bearish momentum and abiding to our descending trendline. We see the potential for a sell entry at 0.91855 in line with 78.6% Fibonacci retracement and 61.8% Fibonacci extension towards our 1st support at 0.91448 in line with 78.6% Fibonacci extension. Prices are trading below our MA and also facing resistance crossing the Ichimoku clouds, further supporting our bearish bias.
Areas of consideration:
- Watch 1st Support at 0.91448
- Watch 1st Resistance at 0.91855
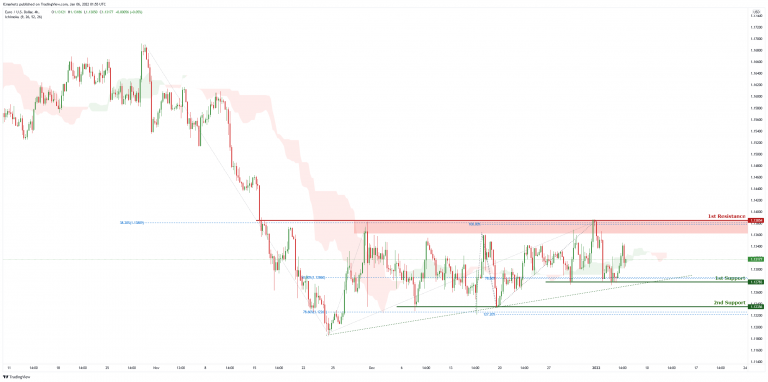
EUR/USD :
On the H4 chart, price is abiding by an ascending trendline and is near 1st support level of 1.12783 which is also 50% Fibonacci retracement and 78.6% Fibonacci projection. Price can potentially go to the 1st resistance of 1.13854 which is also 100% Fibonacci projection and 38.2% Fibonacci retracement. Our bullish bias is supported by the ichimoku cloud indicator
Areas of consideration :
- H4 1st support at 1.12783
- H4 1st resistance at 1.13854
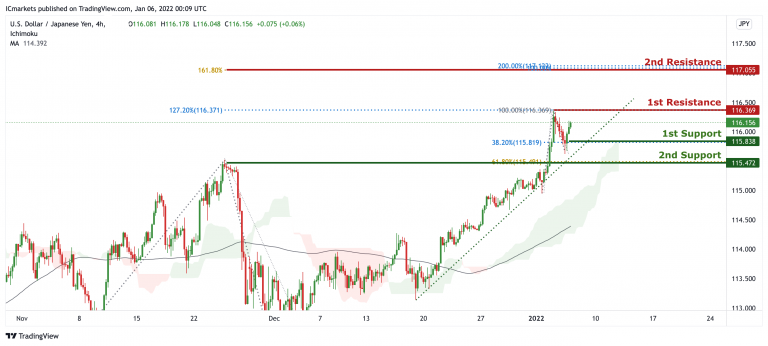
USD/JPY
On the H4 timeframe, price is abiding to an ascending trendline and showing bullish momentum. We can expect further bullish continuation from our 1st support at 115.838 in line with 38.2% Fibonacci retracement towards our 1st resistance at 116.369 in line with 100% Fibonacci retracement and 127.2% Fibonacci extension. Our bullish bias is further supported by prices trading above our MA and also Ichimoku clouds.
Areas of consideration:
- H4 1st resistance level 116.369
- H4 1st support level 115.838
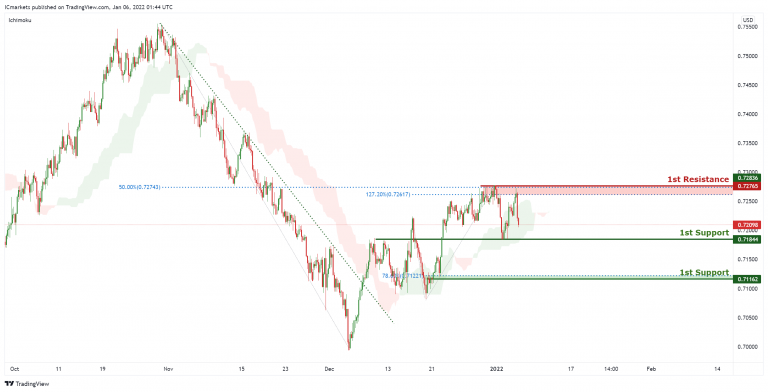
AUD/USD:
On the H4, with price approaching the support of the ichimoku cloud, we have a bullish bias that price will rise to our 1st resistance at 0.72765 which is in line with horizontal swing high resistance, 50% Fibonacci retracement and 127.2% Fibonacci extension from 1st support at 0.71844, which is in line with horizontal overlap support. Alternatively, price may break 1st support structure and head for 2nd support at 0.71162, which coincides with horizontal overlap support and 78.6% Fibonacci retracement level .
Areas of consideration:
- H4 1st Support level 0.71844
- H4 1st resistance level 0.72765
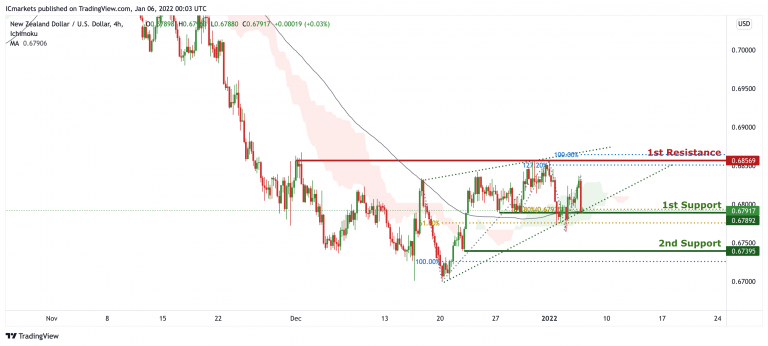
NZD/USD:
On the H4, prices are on bullish momentum and consolidating in a wedge pattern. We see the potential for further bullish movement from our 1st support at 0.67892 in line with 61.8% Fibonacci extension and 61.8% Fibonacci retracement towards our 1st resistance at 0.68569 in line with 127.2% Fibonacci extension and 100% Fibonacci extension. Prices are trading above our MA and also within the area of ichimoku clouds support, further supporting our bullish bias. Alternatively, our stop loss will be placed at 2nd support at 0.67395 in line with 100% Fibonacci extension.
Areas of consideration:
- H4 time frame, 1st resistance at 0.68569
- H4 time frame, 1st support at 0.67892
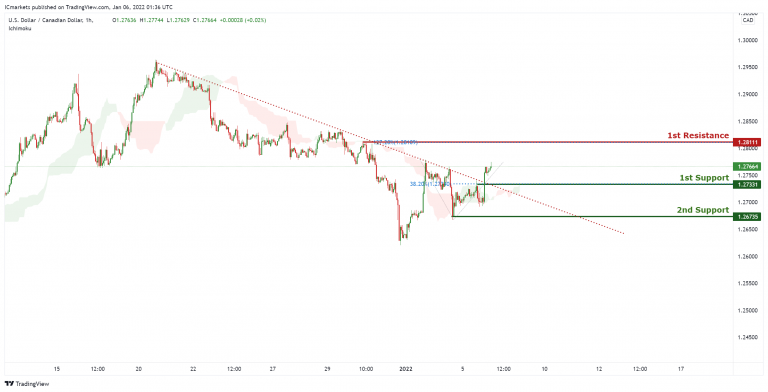
USD/CAD:
On the H1, with price moving above the ichimoku cloud, we have a bullish bias that price will rise to our 1st resistance at 1.28111 which is in line with horizontal swing high resistance and 127.2% Fibonacci extension from 1st support at 1.27331, which is in line with horizontal overlap support and 38.2% Fibonacci retracement level. Alternatively, price may break 1st support structure and head for 2nd support at 1.26735, which coincides with horizontal swing low support.
Areas of consideration:
- H4 time frame, 1st support at 1.27331
- H4 time frame, 1st resistance at 1.28111
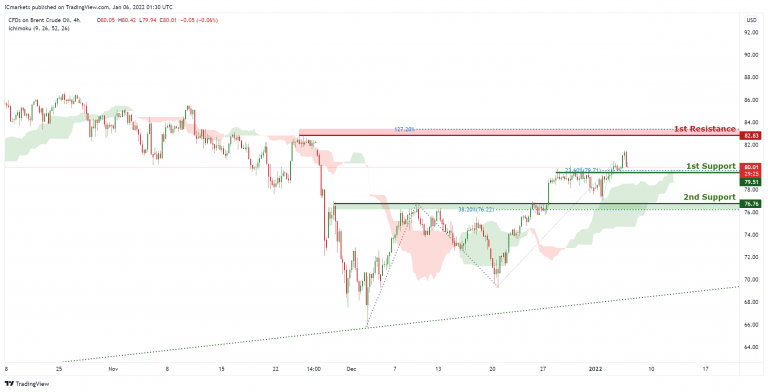
OIL:
On the H4, with price moving above the ichimoku cloud, we have a bullish bias that price will rise to our 1st resistance at 82.83 which is in line with horizontal swing high resistance and 127.2% Fibonacci extension from 1st support at 79.51, which is in line with horizontal overlap support and 23.6% Fibonacci retracement level. Alternatively, price may break 1st support structure and head for 2nd support at 76.76, which coincides with horizontal overlap support and 38.2% Fibonacci retracement level .
Areas of consideration:
- H4 time frame, 1st resistance of 82.83
- H4 time frame, 1st support of 79.51
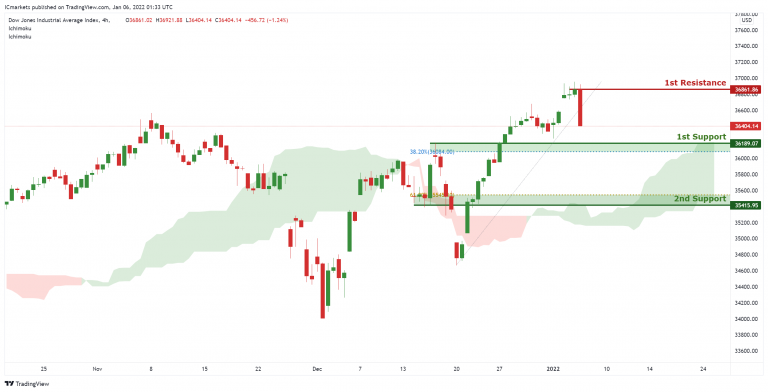
Dow Jones Industrial Average:
On the H4, with price moving above the ichimoku cloud, we have a bullish bias that price will rise to our 1st resistance at 36861 which is in line with horizontal swing high resistance from 1st support at 36189, which is in line with horizontal overlap support and 32.8% Fibonacci retracement level. Alternatively, price may break 1st support structure and head for 2nd support at 35415, which coincides with horizontal overlap support and 61.8% Fibonacci retracement level .
Area of consideration:
- 4H resistance at 36861
- 4H support at 36189


