
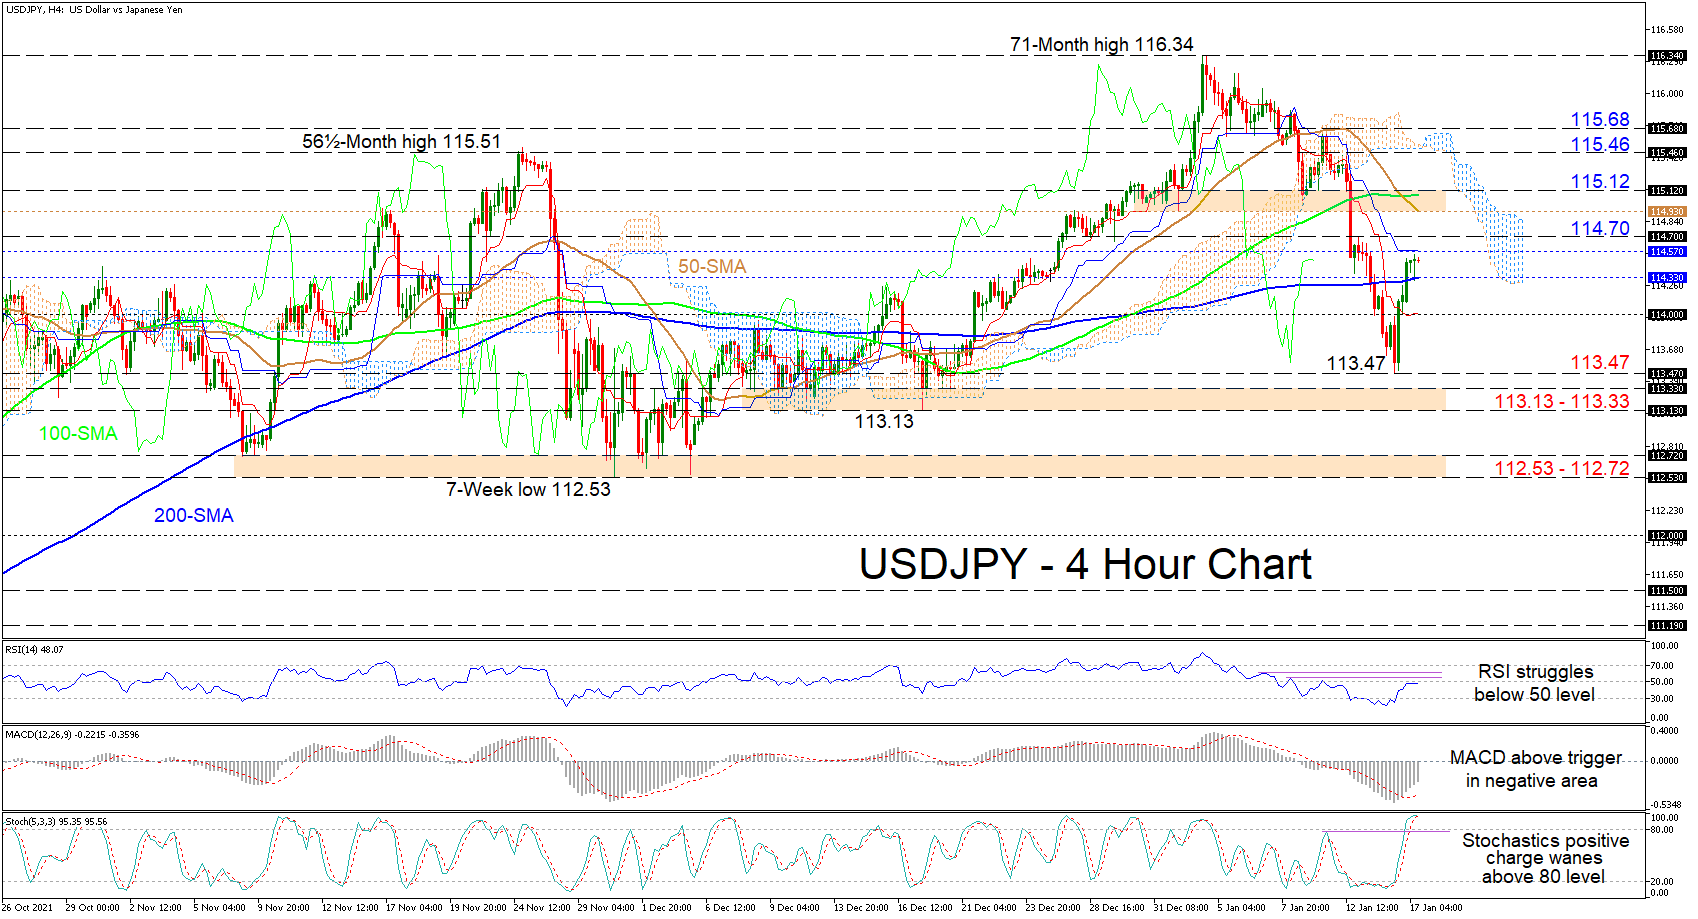
USDJPY buyers are trying to extend the bounce from the 113.47 level far beyond the recently conquered 200-period simple moving average (SMA) at 114.33. The longer-term SMAs are implying that the positive trend is feeble, while the fresh bearish crossover of the 100-period SMA by the 50-period one is endorsing the latest decline in the pair, from the near six-year high of 116.34.
The Ichimoku lines are indicating a pause in negative forces, while the short-term oscillators are demonstrating conflicting signals in directional momentum. The MACD, in the negative region, continues to climb above its red trigger line, showing that downside momentum is diminishing. However, the RSI is faltering beneath the 50 level, reflecting weakness in upside impetus, while the positively charged stochastic oscillator is hinting of waning in the bullish drive.
In the positive scenario, upside limitations could originate in the area between the blue Kijun-sen line at 114.57 and the nearby 114.70 obstacle. That said, if the bulls drive the price higher, they may then face a zone of resistance, which has taken shape from the 50-period SMA at 114.93 until the 115.12 barrier. Overcoming this boundary and the Ichimoku cloud, the pair could then seek out the 115.46 and 115.68 neighbouring highs.
Otherwise, if upside momentum fades around the blue Kijun-sen line at 114.57, initial support could emanate from the 200-period SMA at 114.33. If the pair slides back beneath the 200-period SMA, sellers may target the red Tenkan-sen line – residing around the 114.00 mark – before the price sinks toward the January 14 trough of 113.47. Slightly lower, the 113.13-113.33 support border could try to impede the bears from challenging the 112.53-112.72 foundation, which has defended the broader uptrend from the early parts of November 2021.
Summarizing, USDJPY is exhibiting a minor bullish tone slightly north of the 200-period SMA. Nonetheless, a negative tilt still grips the pair, while the price continues to trade beneath the 114.70 high and 114.93-115.12 resistance zone.


