
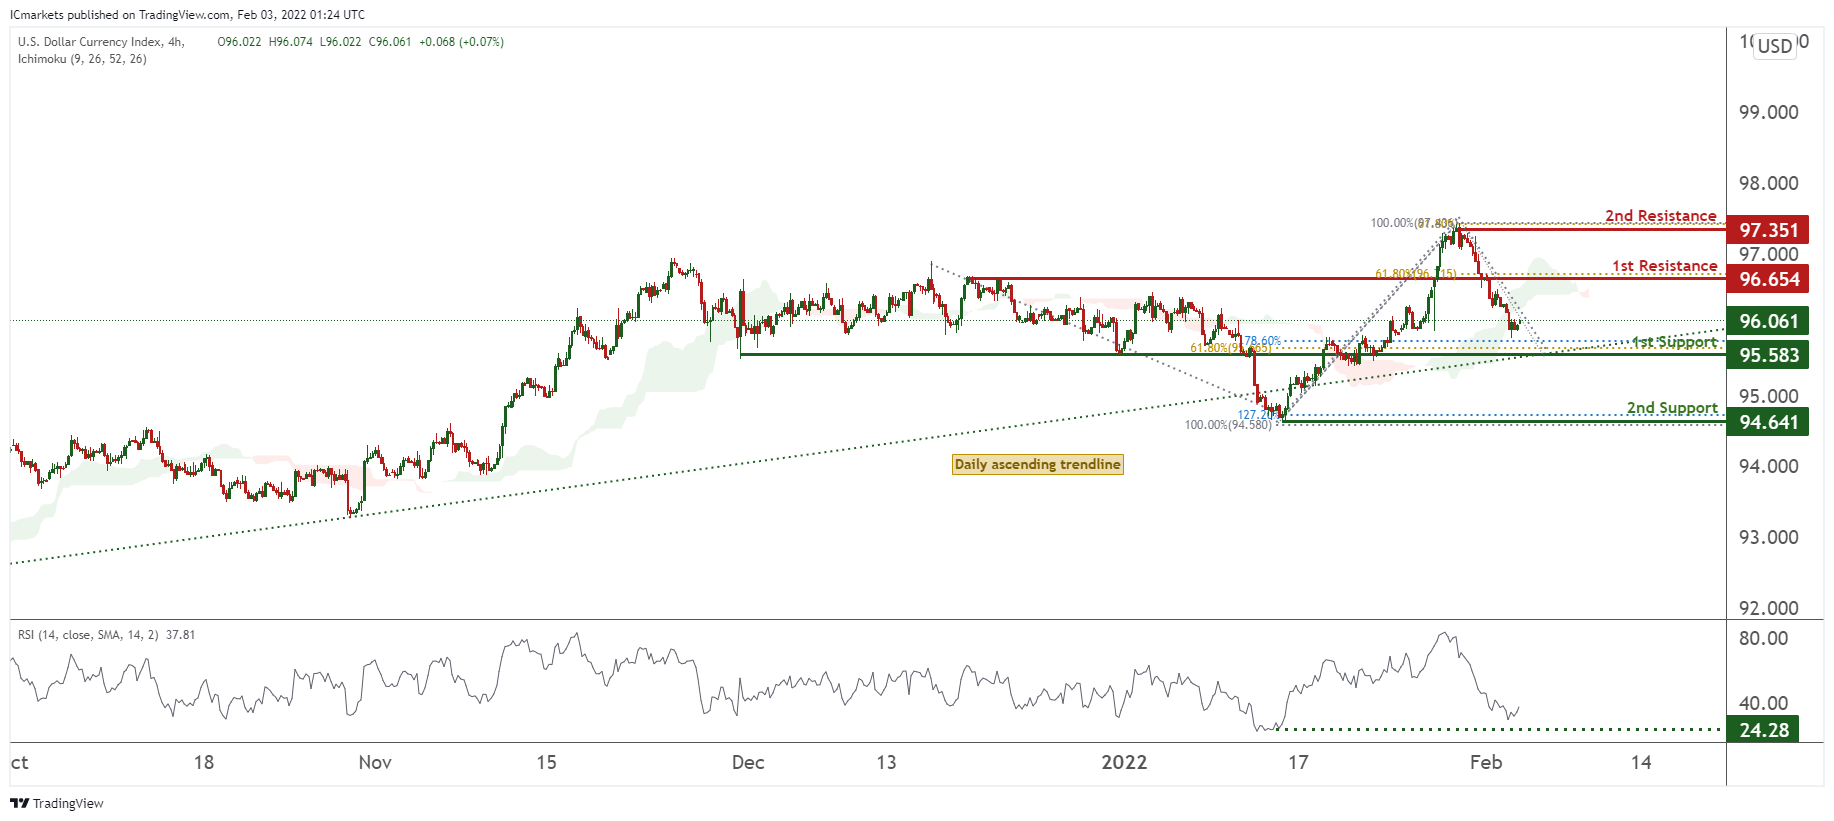
DXY:
On the H4 timeframe, prices are on bullish momentum and abiding to a daily ascending trendline. We would expect potentially a bounce from our 1st support at 95.583 in line with 61.8% Fibonacci retracement and 78.6% Fibonacci extension towards our 1st resistance at 96.654 in line with 61.8% Fibonacci retracement. RSI are close to oversold extremes, further supporting our bullish bias.
Areas of consideration:
- H4 time frame, 1st resistance at 96.654
- H4 time frame, 1st support at 95.583
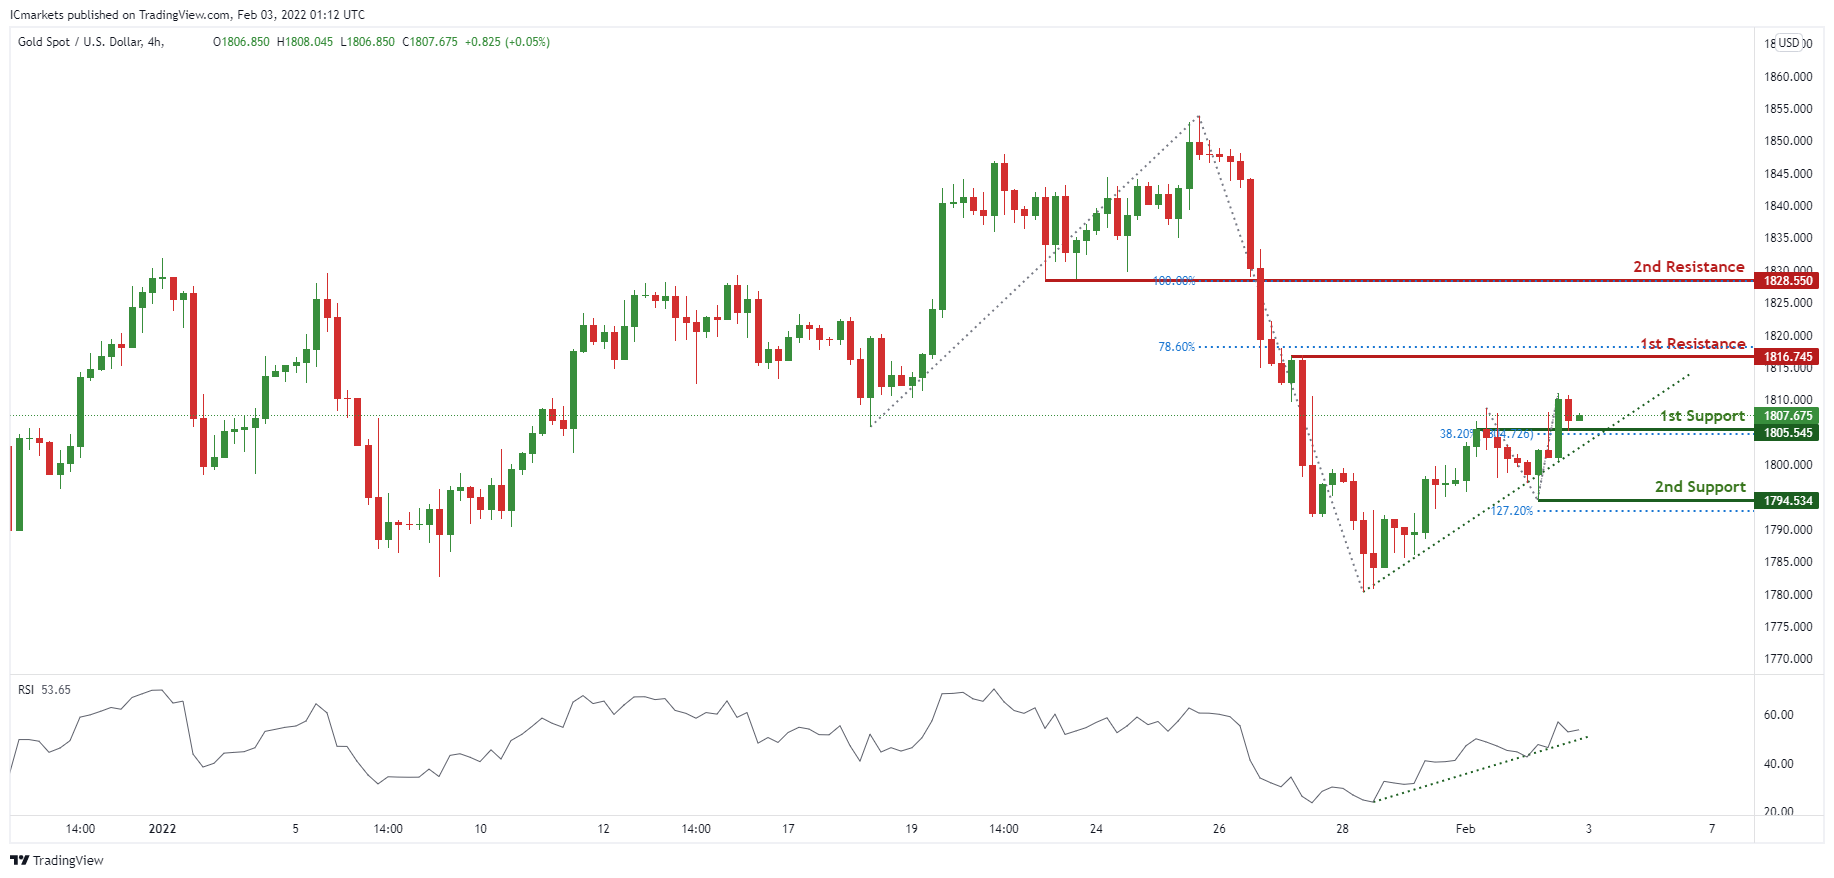
XAU/USD (GOLD):
On the H4 chart, prices are on bullish momentum and abiding to an ascending trendline. We see a potential for a bounce from our 1st support at 1805.545 in line with 38.2% Fibonacci retracement and ascending trendline towards our 1st resistance at 1816.745 which is a graphical overlap and in line with 78.6% Fibonacci extension. RSI is portraying bullish momentum.
Areas of consideration:
- 4h 1st support at 1805.545
- 4h 1st resistance at 1816.745
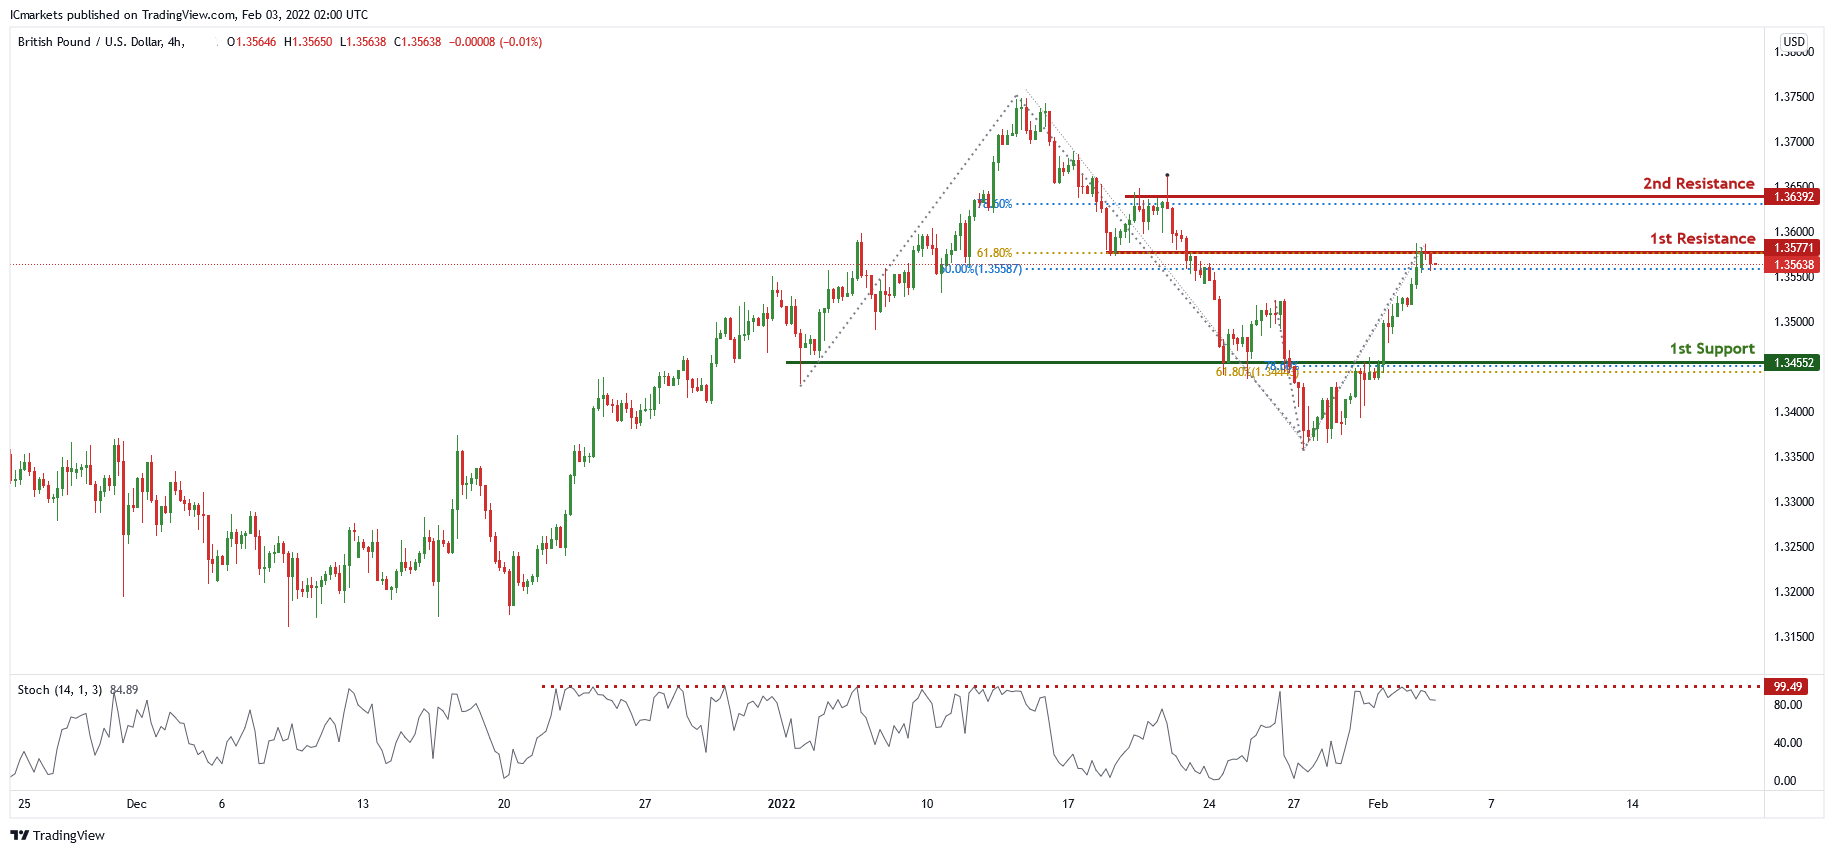
GBP/USD
On the H4 chart chart, price is near 1st resistance level of 1.35771 which is also 50% Fibonacci retracement and 61.8% Fibonacci projection. Price can potentially dip to the 1st support level of 1.34552 which is also 61.8% Fibonacci retracement and 78.6% Fibonacci projection. Our bearish bias is supported by the stochastic indicator as it is near resistance level.
Areas of consideration:
- H4 1st support at 1.34552
- H4 1st resistance at 1.35771
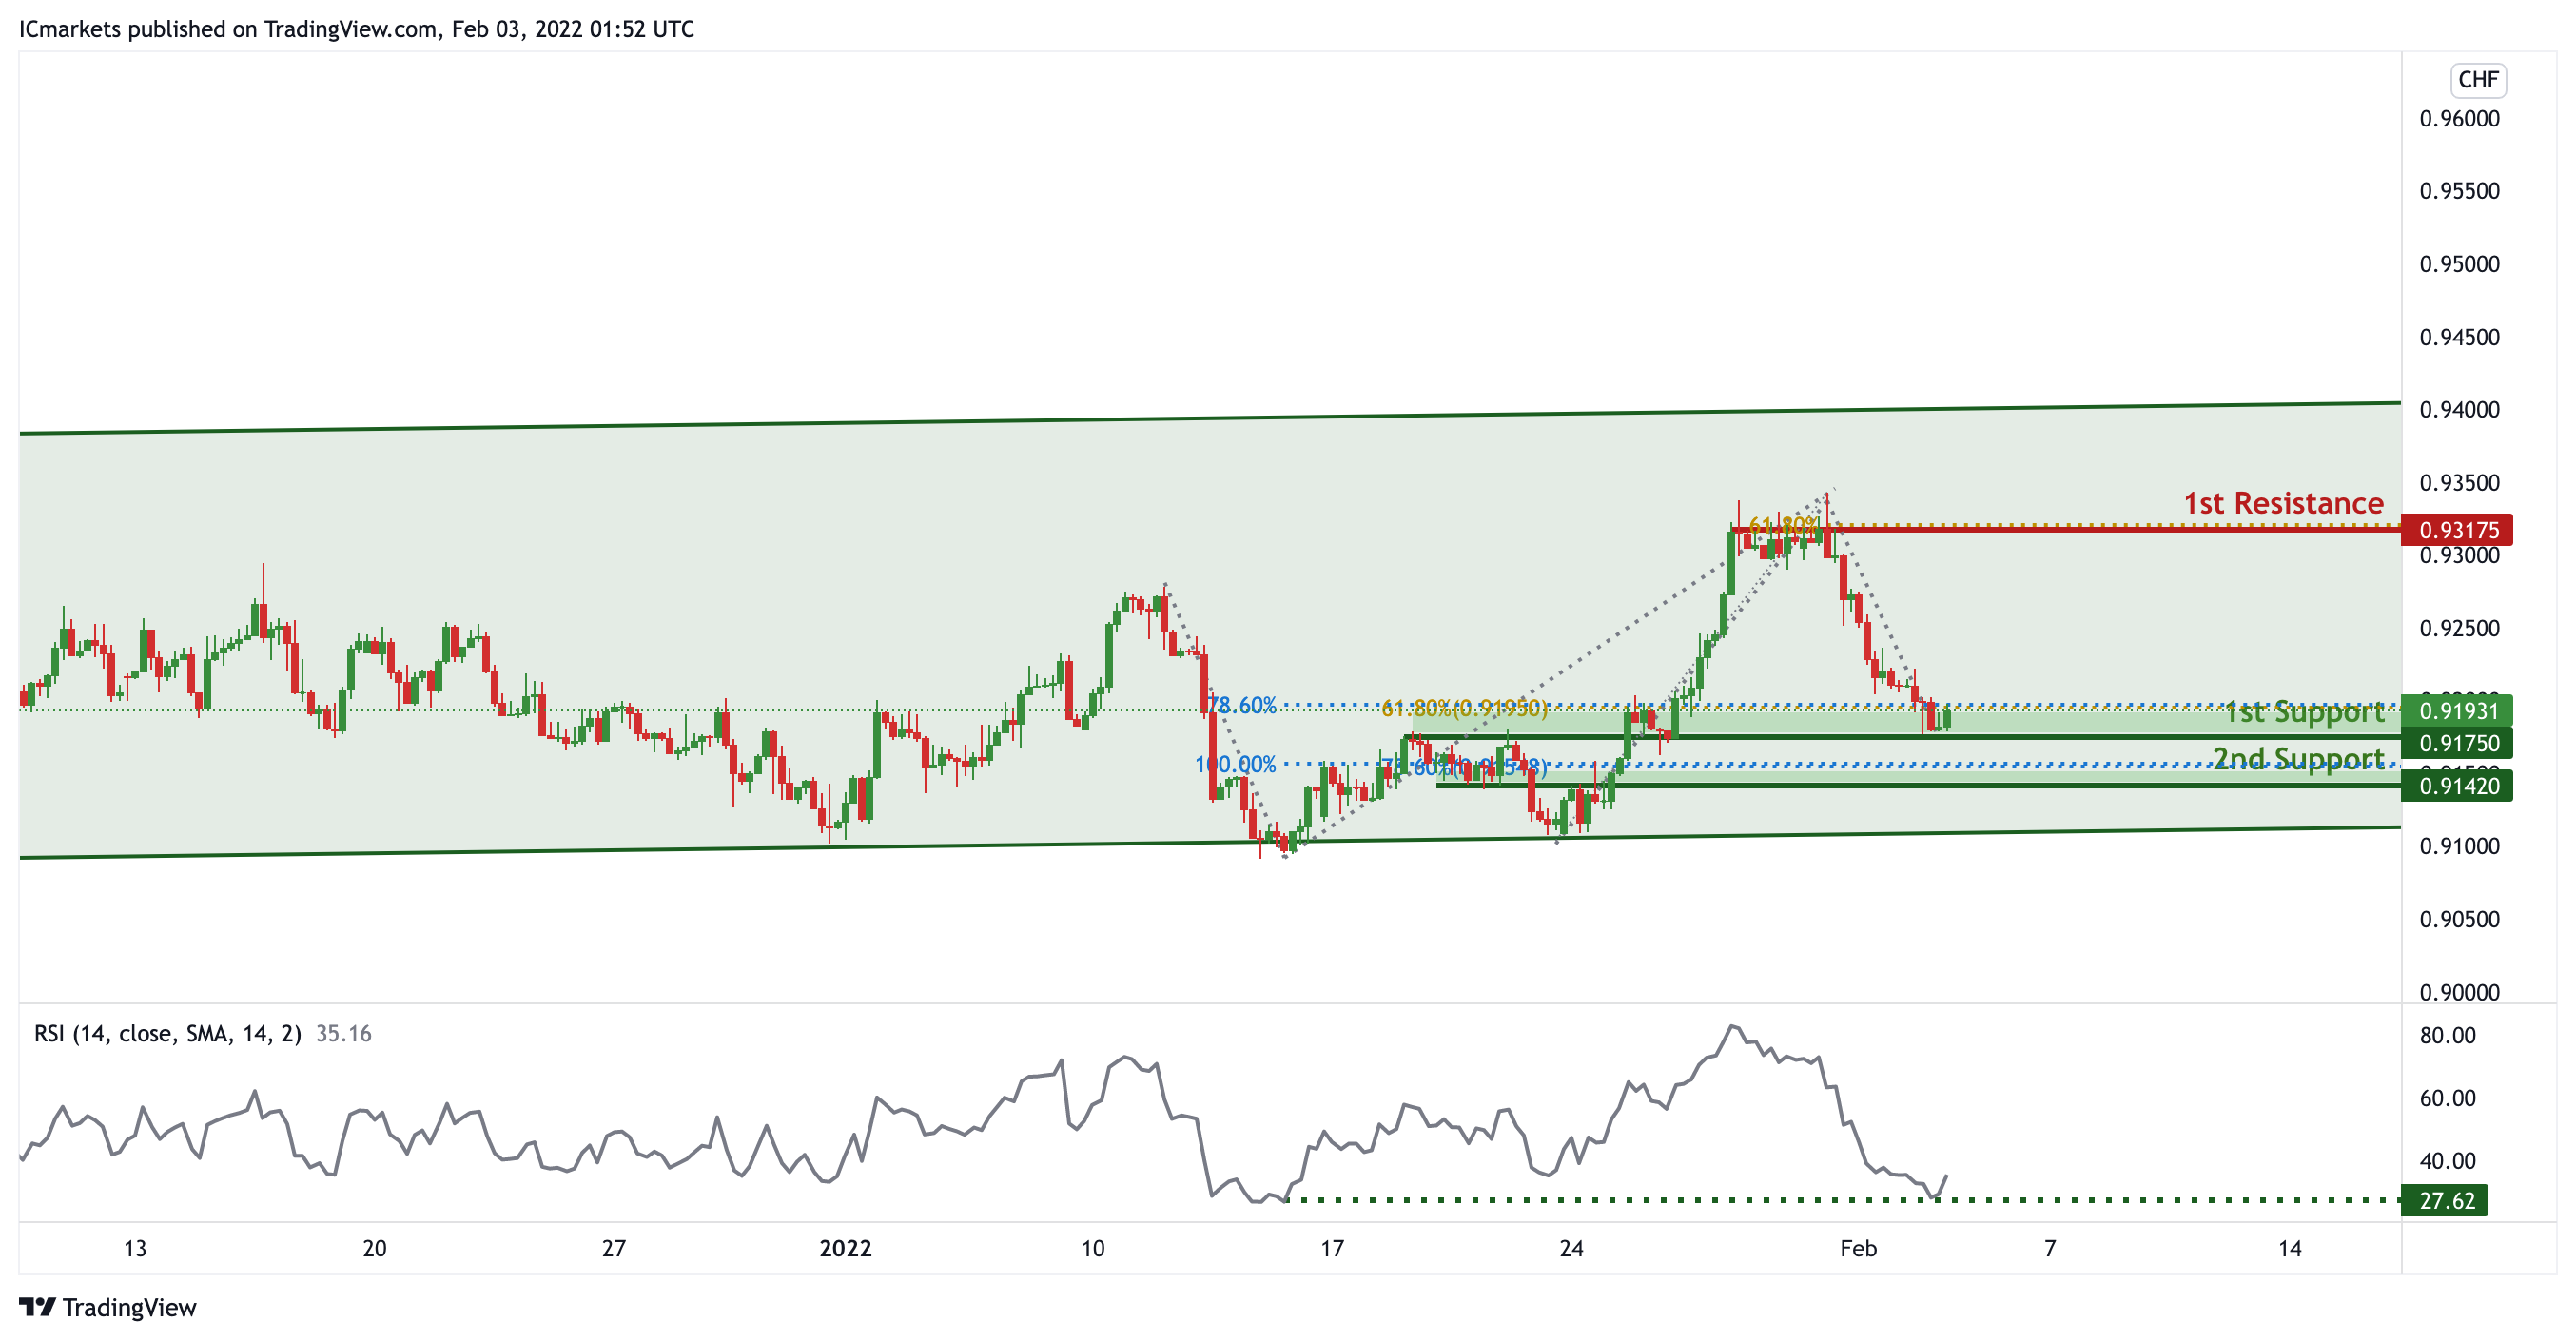
USD/CHF:
On the H4 timeframe,price is abiding to the daily ascending channel signifying an overall bullish momentum. We can expect the price to bounce from 1st Support in line with 78.6% Fibonacci projection and 61.8% fibonacci retracement towards 1st Resistance in line with 61.8% Fibonacci projection and previous swing high. Our bullish bias is further supported by the RSI indicator where it is at the support level.
Areas of consideration:
- Watch 1st Support at 0.91750
- Watch 1st Resistance at 0.93175
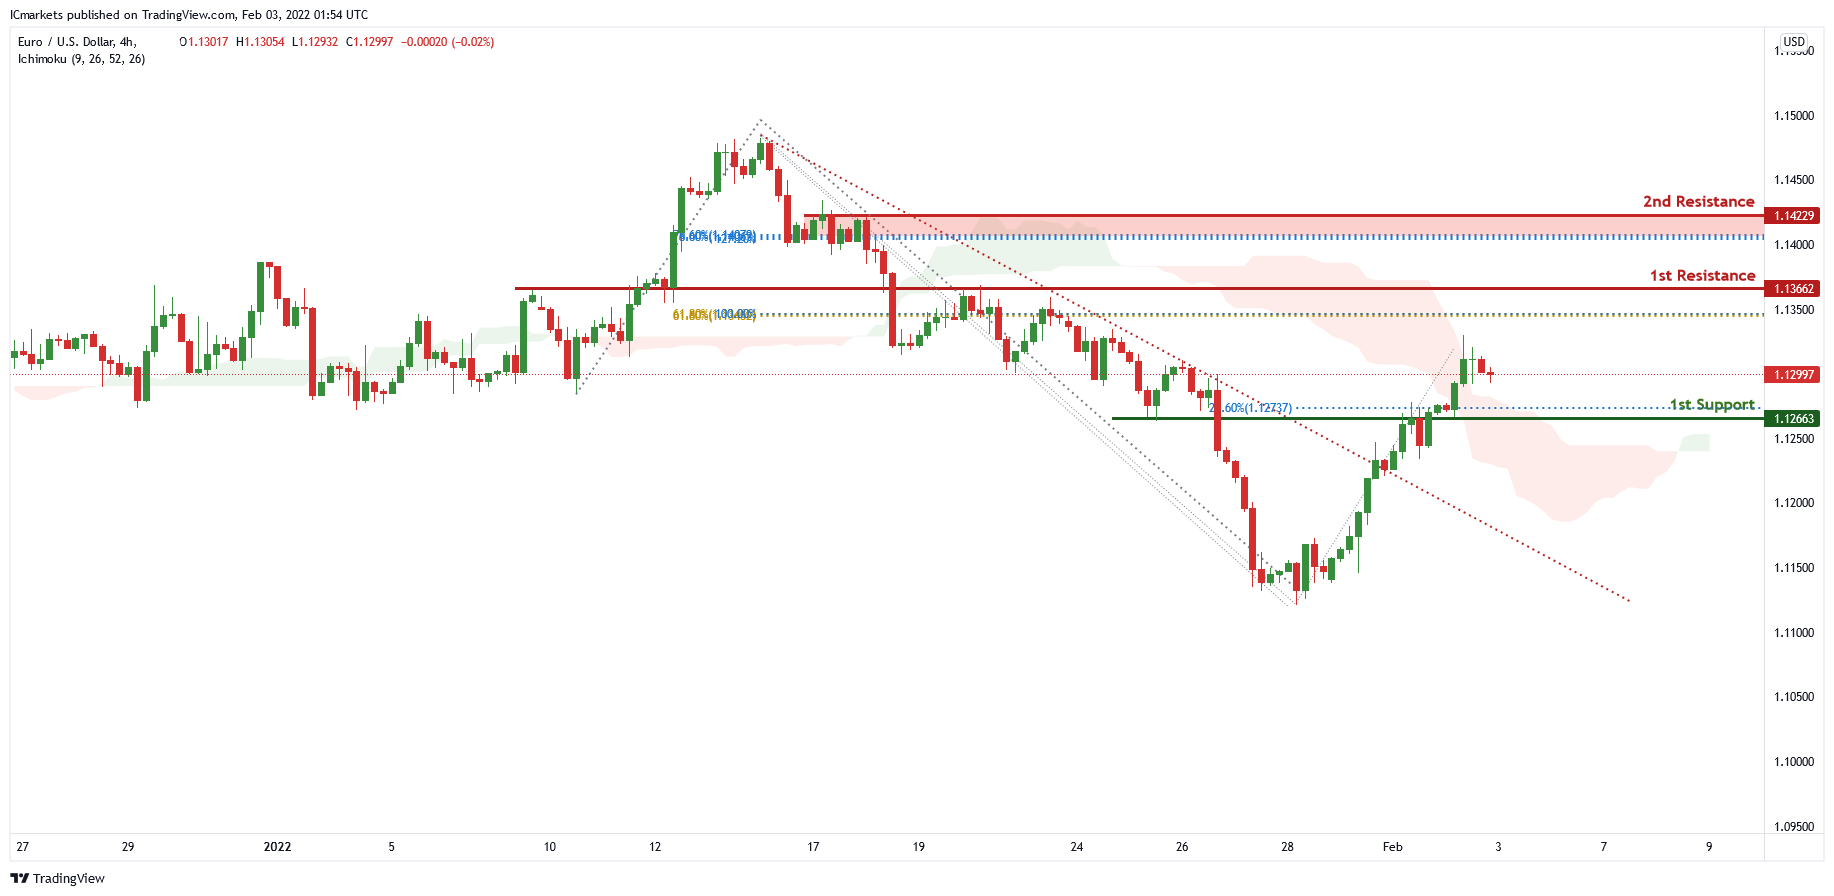
EUR/USD :
On the H4 chart, price has recently broken out of the descending trendline and is between 1st resistance of 1.13662 which is also 100% Fibonacci projection, 61.8% Fibonacci retracement and 1st support of 1.12663 which is also 23.6% Fibonacci retracement. Price can potentially continue its upward trend to the 1st resistance level. Our bullish bias is supported by the ichimoku cloud indicator as it is trading above the clouds.
Areas of consideration :
- H4 1st support at 1.12663
- H4 1st resistance at 1.13662
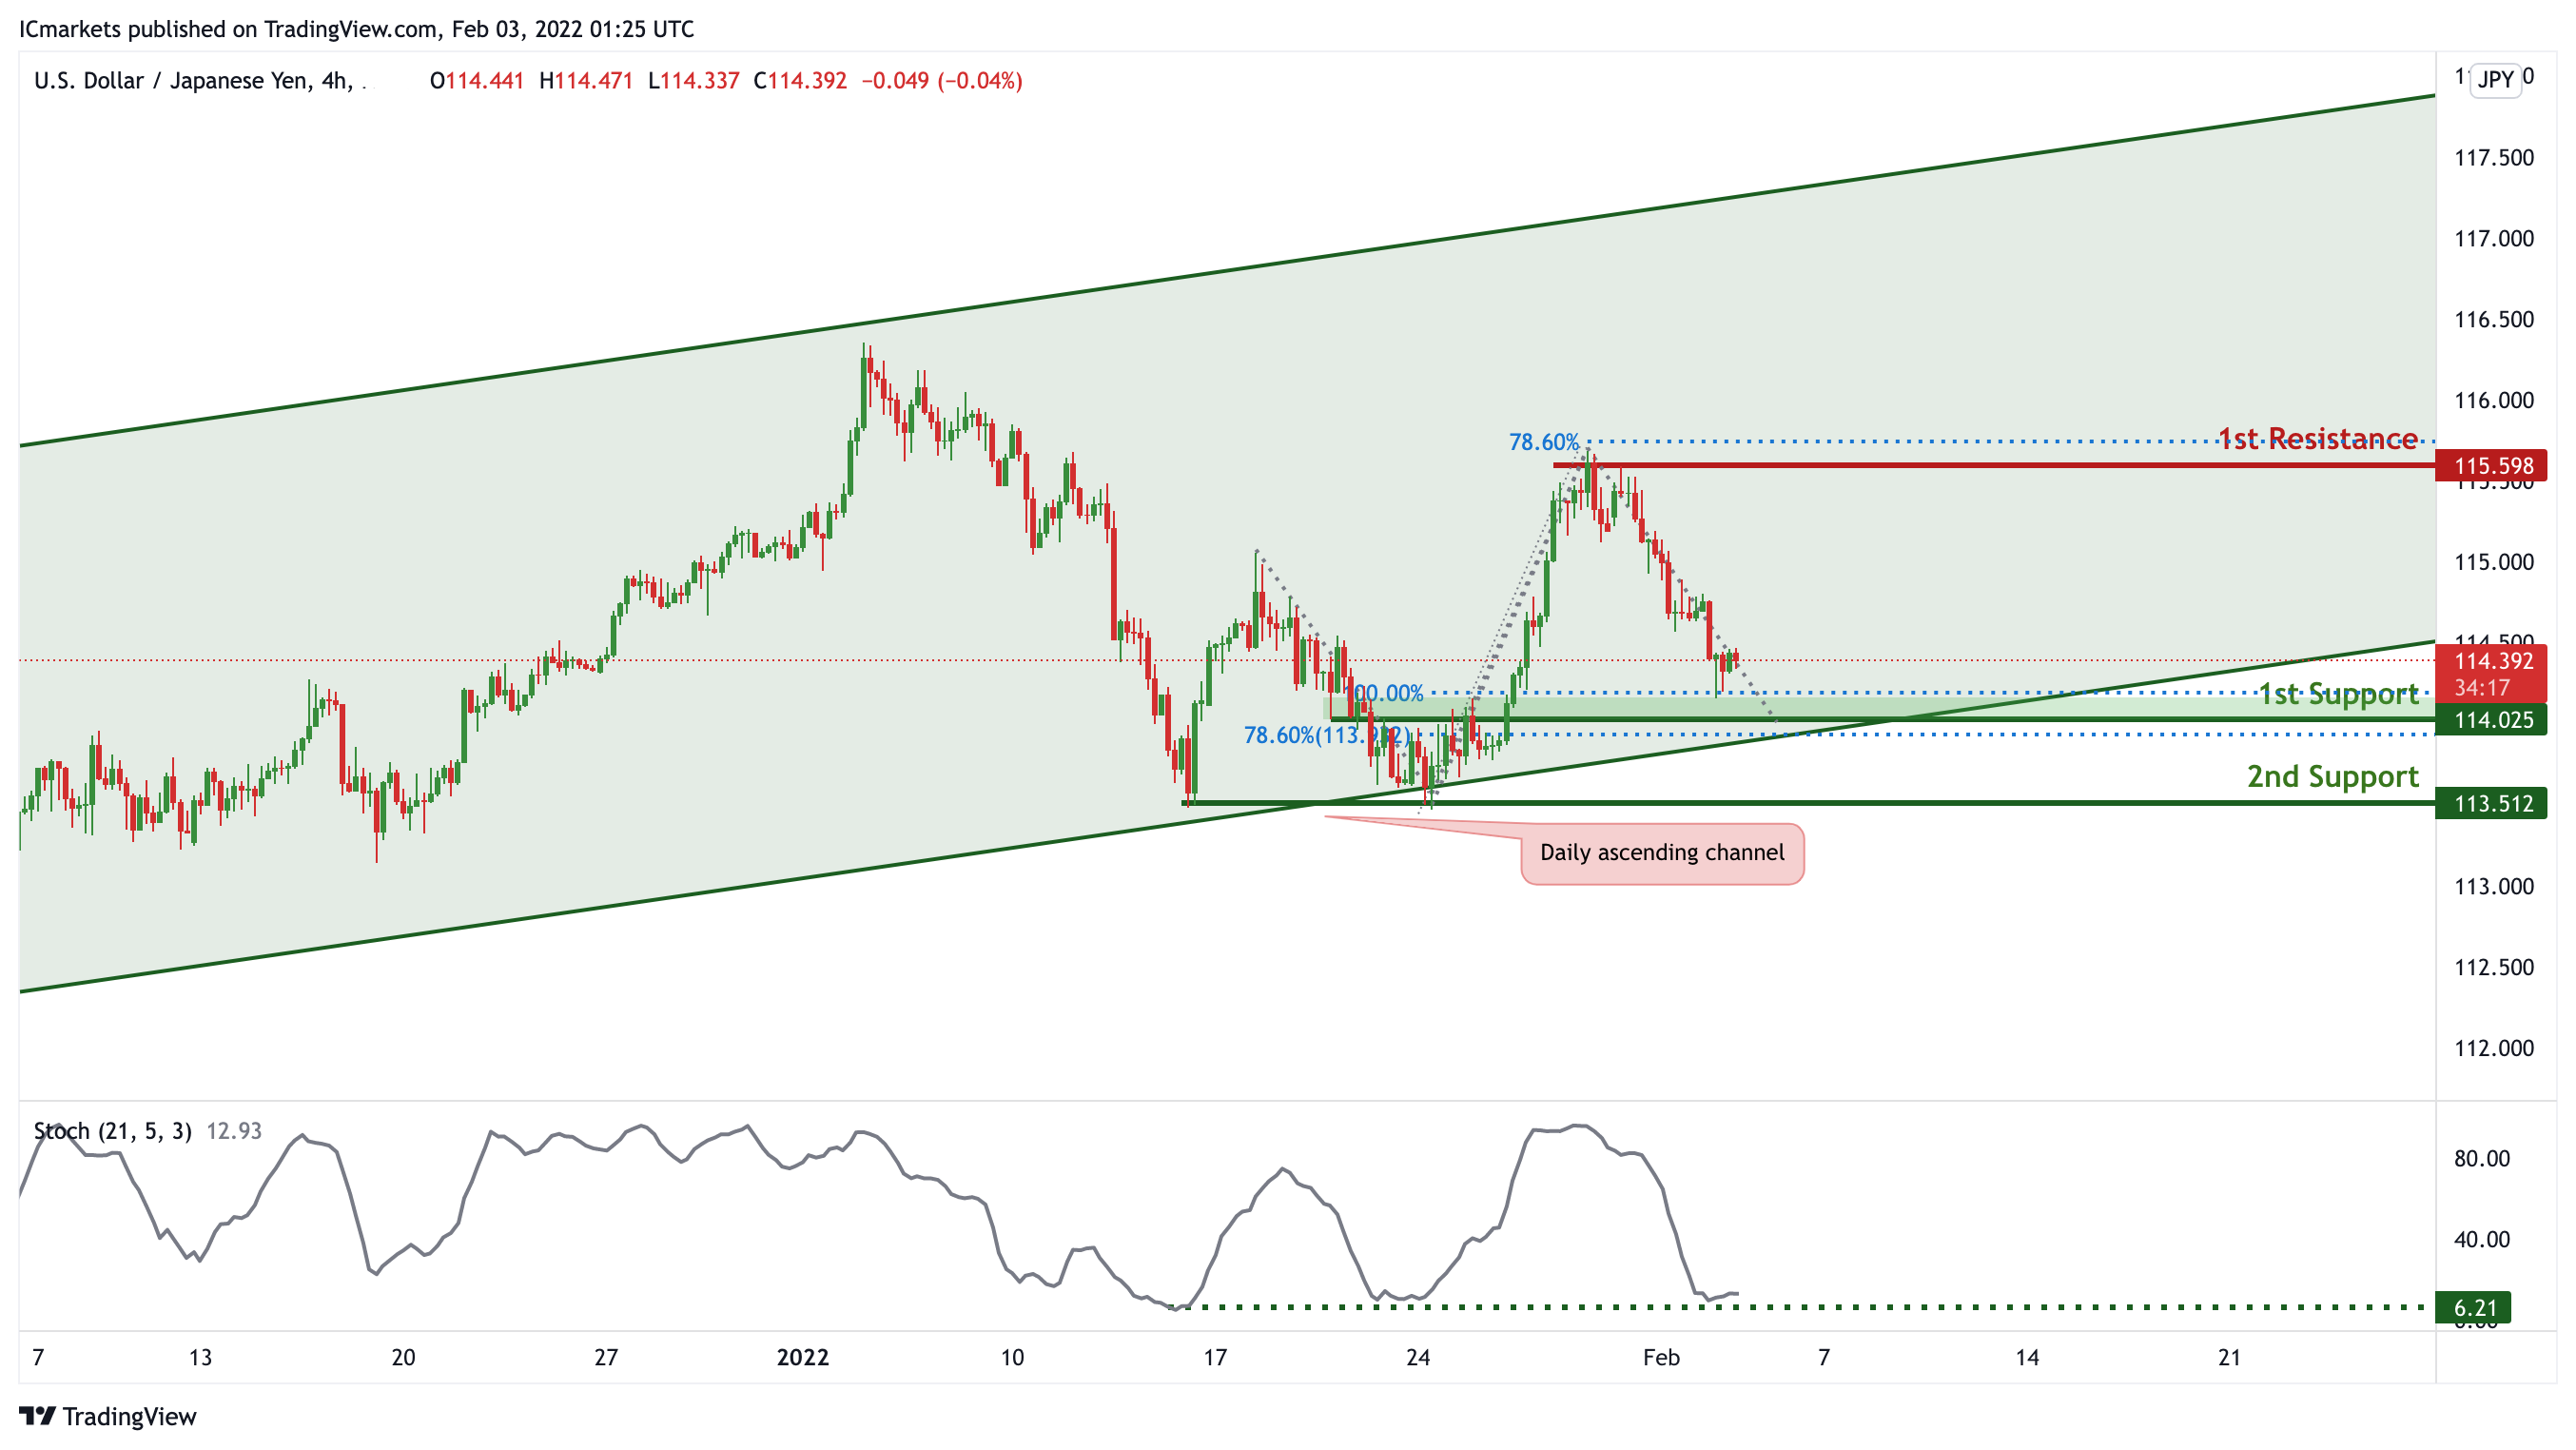
USD/JPY:
On the H4 chart, price is trading in an ascending channel signifying an overall bullish momentum. We can expect price to bounce from 1st Support in line with 78.6% Fibonacci retracement and 100% Fibonacci projection towards 1st Resistance in line with 78.6% FIbonacci projection and previous swing high. Our bullish bias is further supported by the stochastic indicator where the %K line is at the support level.
Areas of consideration:
- H4 1st support at 114.025
- H4 1st resistance at 115.598
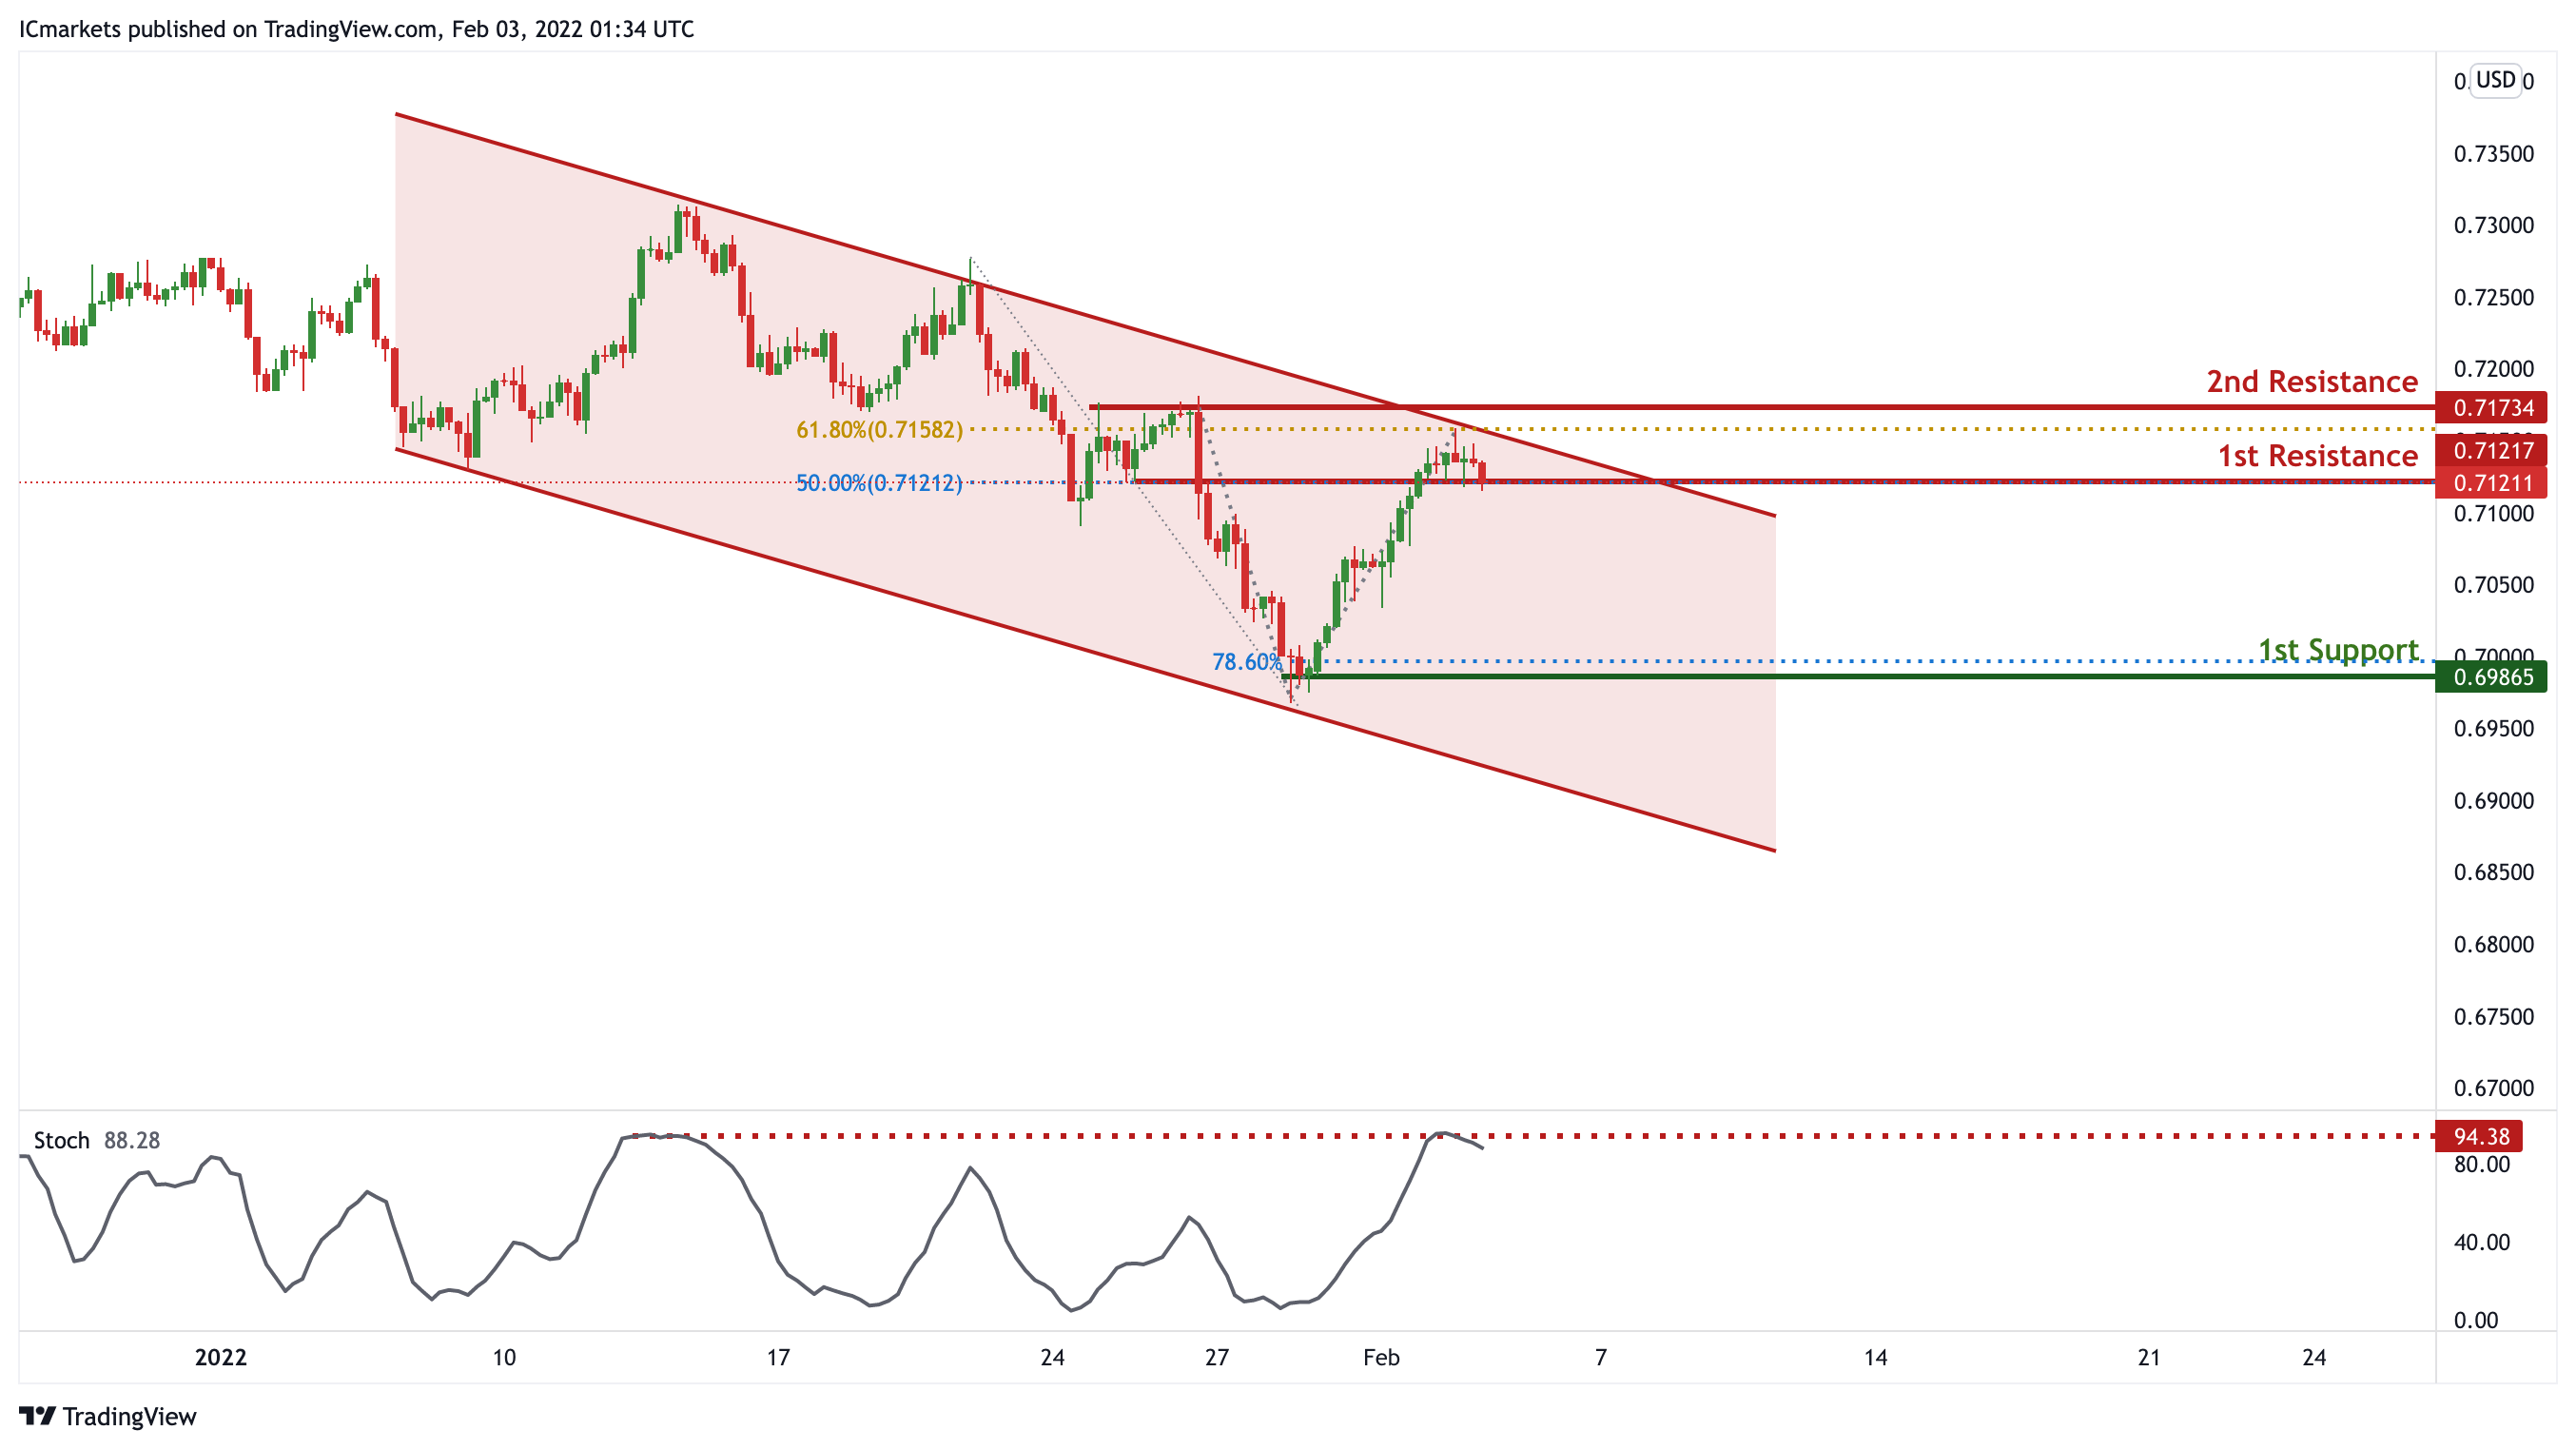
AUD/USD:
On the H4 timeframe, price is abiding to the descending channel, signifying an overall bearish momentum. We can expect price to drop from 1st Resistance in line with 50% Fibonacci retracement towards 1st Support in line with previous swing low and 78.6% Fibonacci projection. Our bearish bias is further supported by the stochastic indicator where the %K line is at the resistance level.
Areas of consideration:
- H4 1st Support level 0.69865
- H4 1st resistance level 0.71217
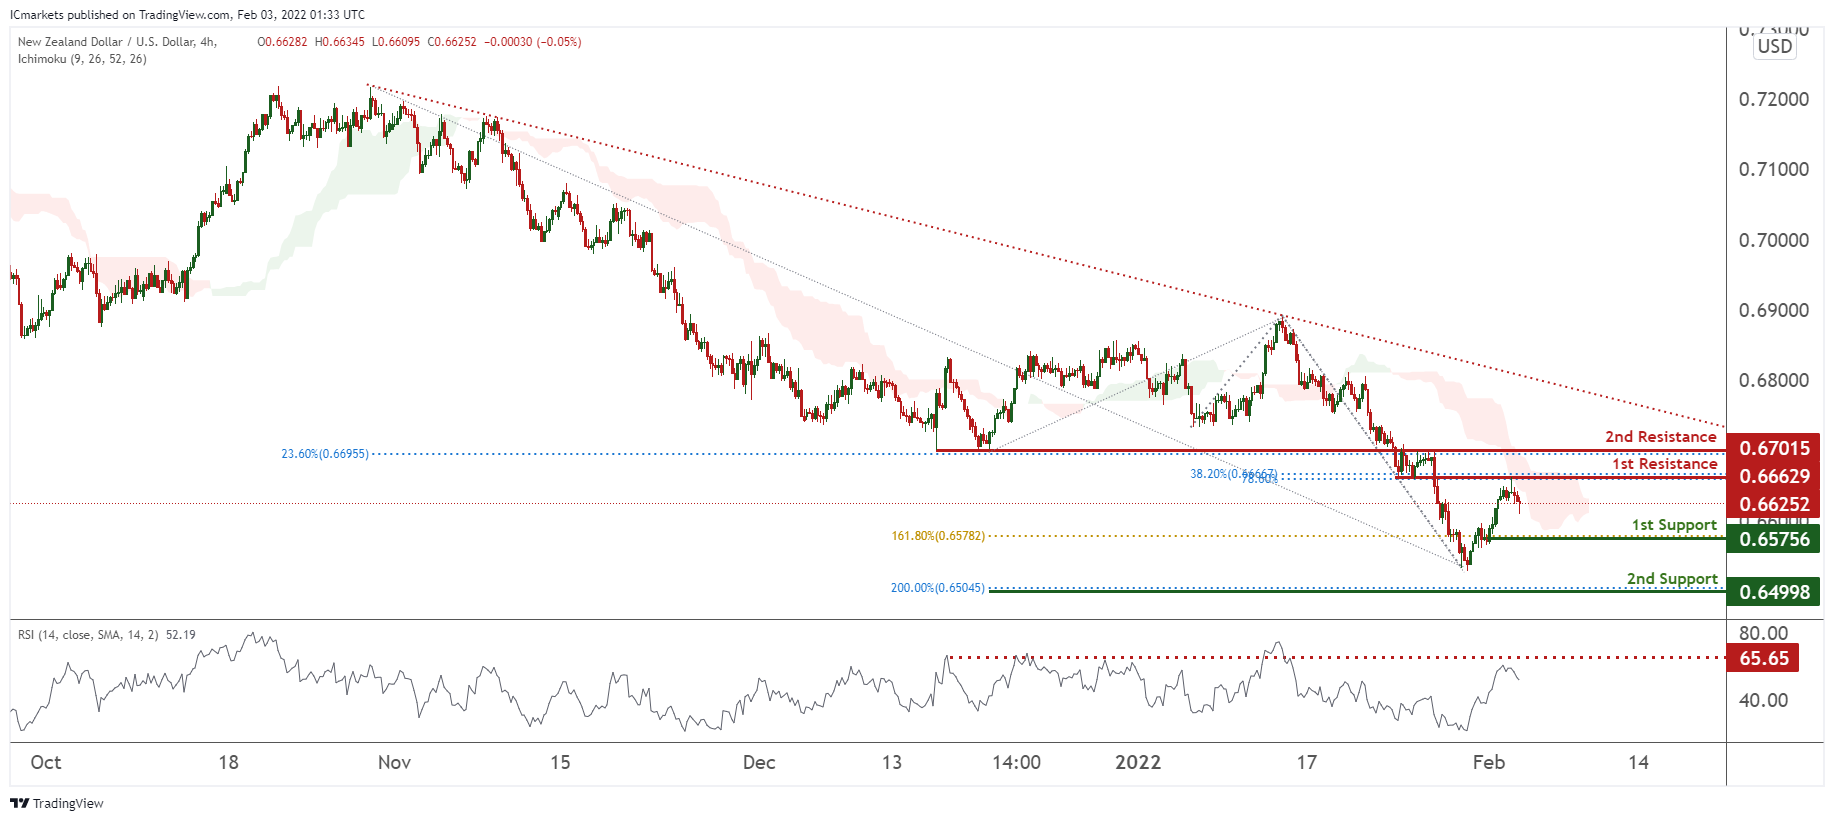
NZD/USD:
On the H4, prices are on bearish momentum and abiding to our bearish trendline. We see the potential for a dip from our 1st resistance at 0.66629 in line with 38.2% Fibonacci retracement and 78.6% Fibonacci extension towards our 1st support at 0.65756 in line with 161.8% Fibonacci projection. RSI is at a level where dips occurred previously and prices are trading below our ichimoku cloud resistance, further supporting our bearish bias.
Areas of consideration:
- H4 time frame, 1st resistance at 0.66629
- H4 time frame, 1st support at 0.65756
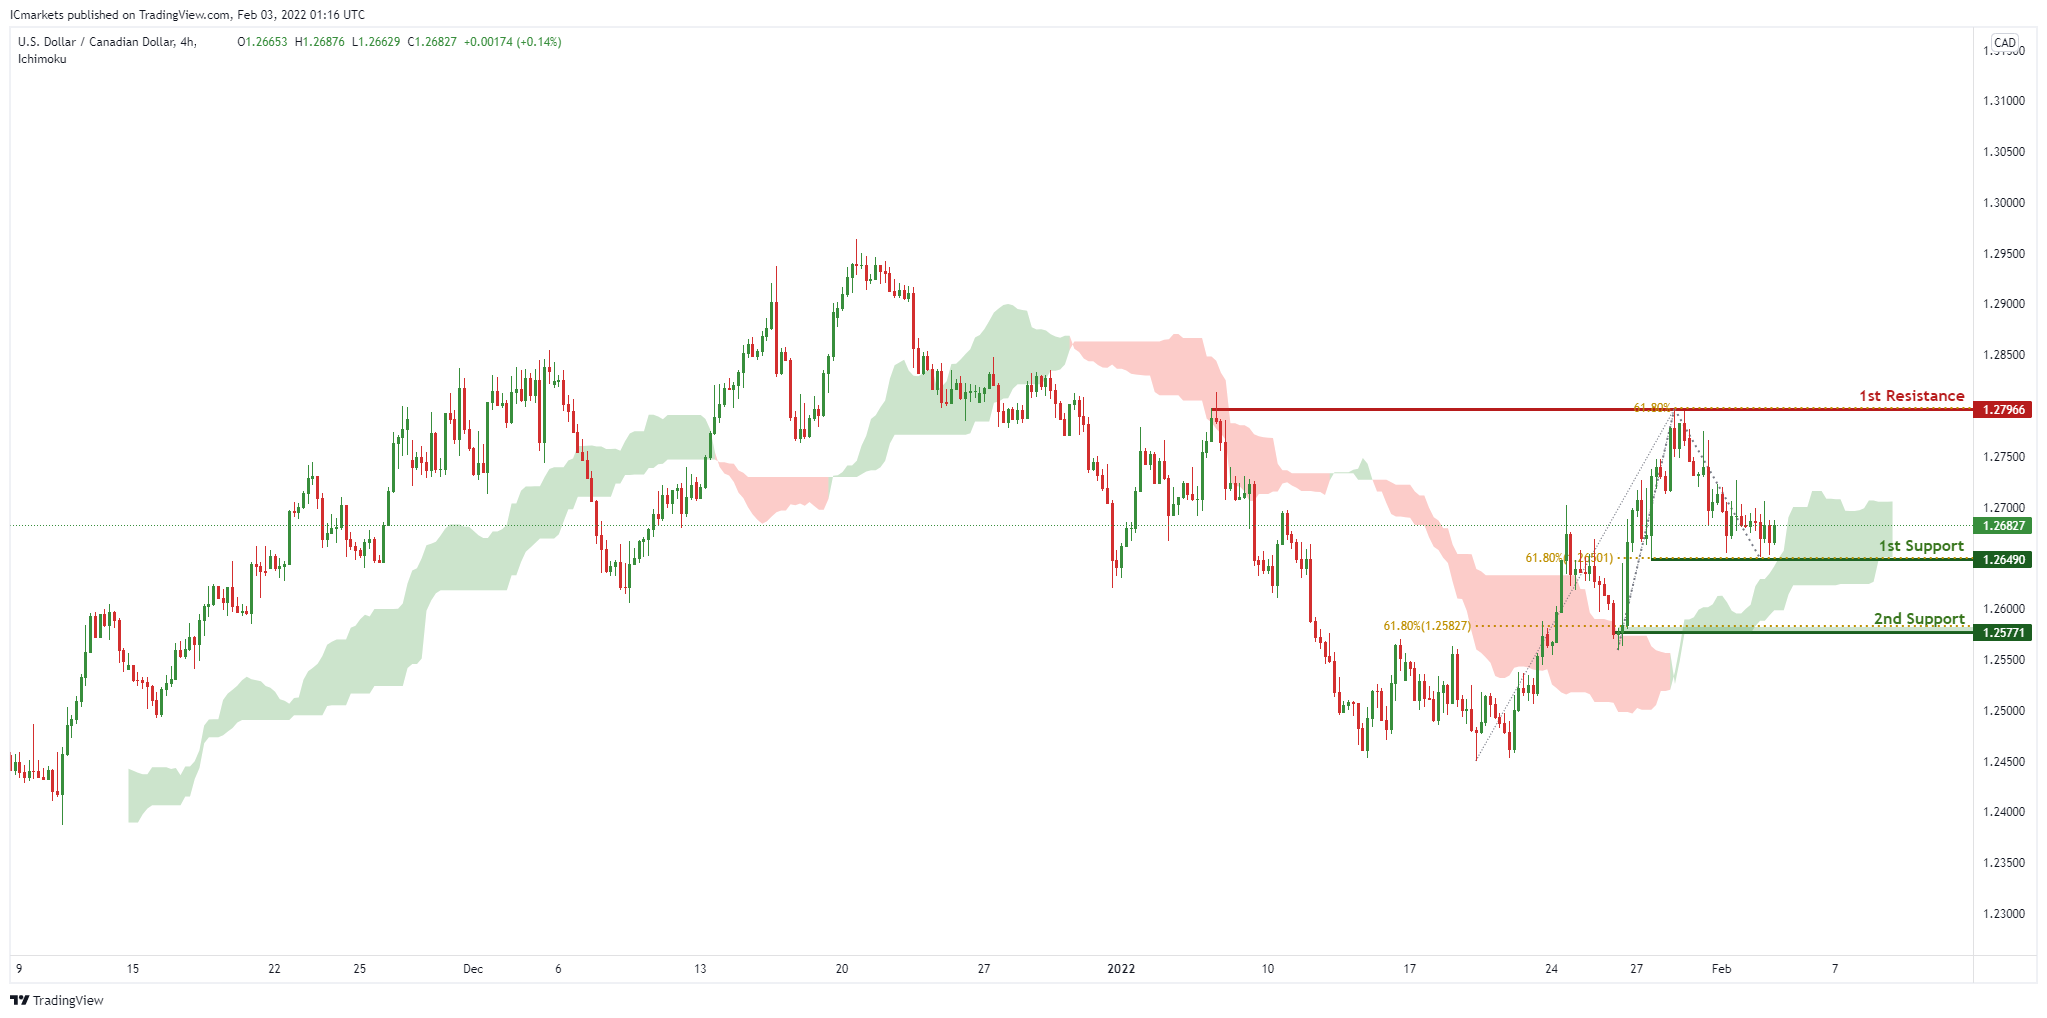
USD/CAD:
On the H4, with prices moving above the ichimoku cloud, we see the potential for a bounce from our 1st support at 1.26490 in line with horizontal swing low support and 61.8% Fibonacci retracement towards our 1st resistance at 1.27966 in line with horizontal swing high resistance and 61.8% Fibonacci retracement. Alternatively, price may break 1st support structure and head for 2nd support at 1.25771, in line with 61.8% Fibonacci retracement and horizontal swing low support.
Areas of consideration:
- H4 time frame, 1st support at 1.26490
- H4 time frame, 1st resistance at 1.27966
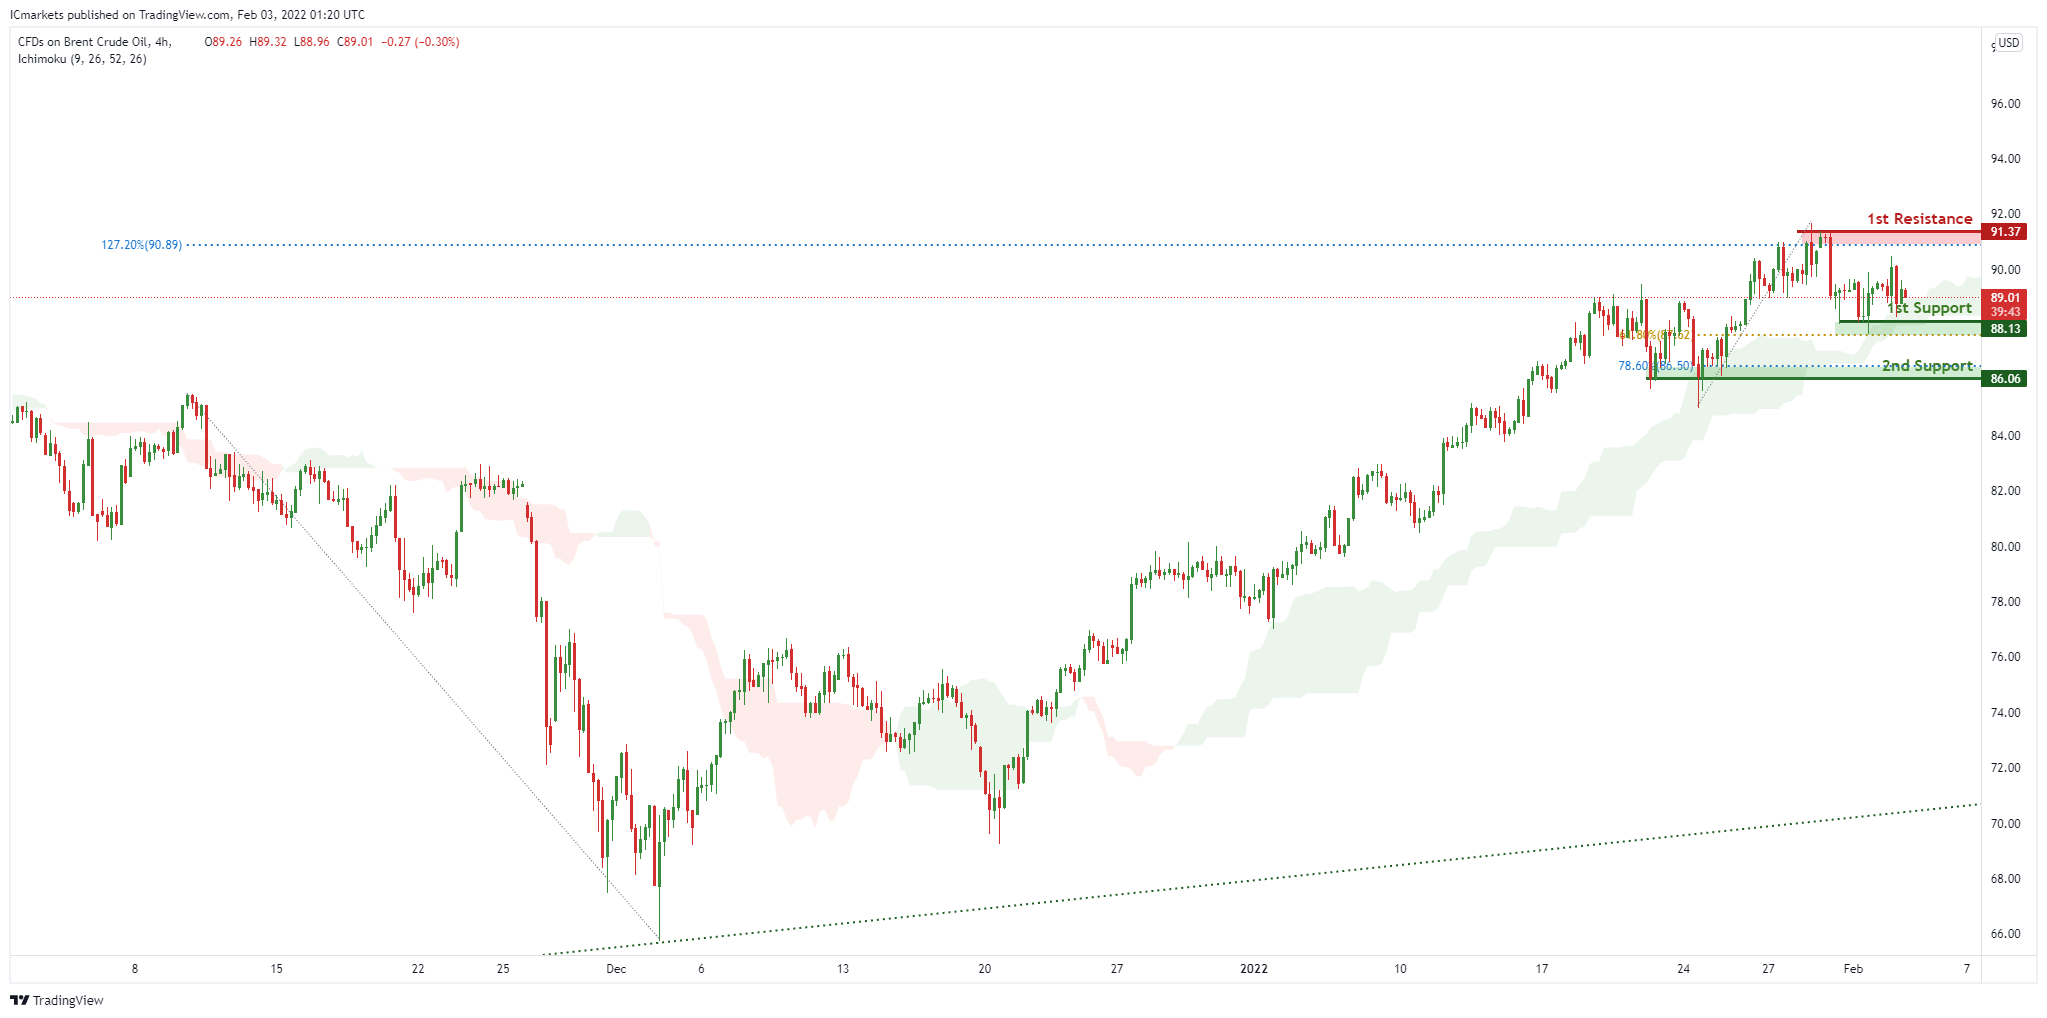
OIL:
On the H4, with price moving above the ichimoku cloud, signifying an overall bullish momentum. We can expect price to rise to our 1st resistance at 91.37 in line horizontal graphical swing high resistance and 127.2% Fibonacci extension from our 1st support in line with horizontal overlap support and 78.6% Fibonacci retracement level at 88.13. Alternatively, price may break 1st support structure and head for 2nd support, which coincides with 78.6% Fibonacci retracement level at 86.06.
Areas of consideration:
- H4 time frame, 1st resistance of 91.37
- H4 time frame, 1st support of 88.13
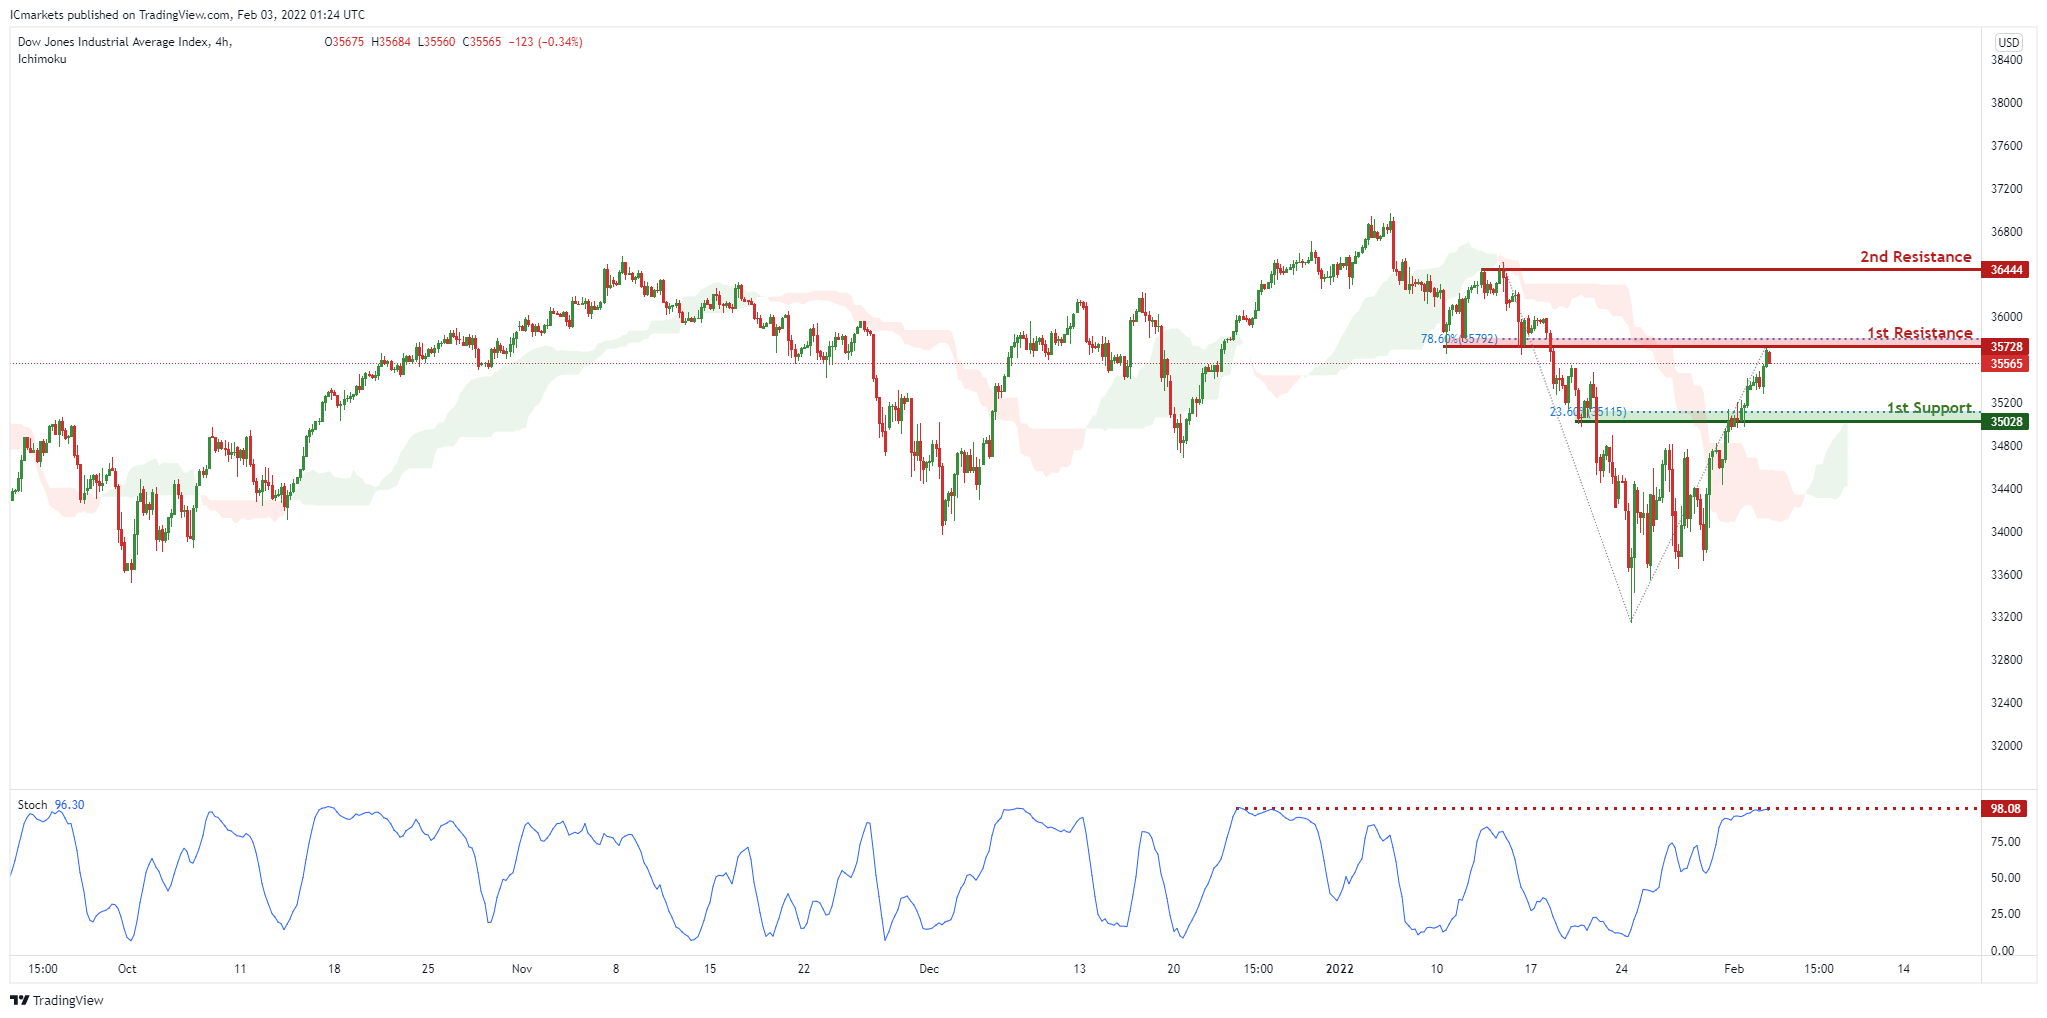
Dow Jones Industrial Average:
On the H4, with price expected to reverse off the stochastics indicator, signifying an overall bearish momentum. We can expect price to drop from our 1st resistance at 35728 in line horizontal graphical overlap and 78.6% Fibonacci retracement towards 1st support in line with horizontal overlap support ,23.6% Fibonacci retracement level at 35028. Alternatively, price may break 1st resistance structure and head for 2nd resistance, which coincides with the horizontal swing high resistance at 36444. Traders should wait for prices to swing higher or lower before entering.
Areas of consideration:
- H4 time frame, 1st resistance of 35728
- H4 time frame, 1st support of 35028


