
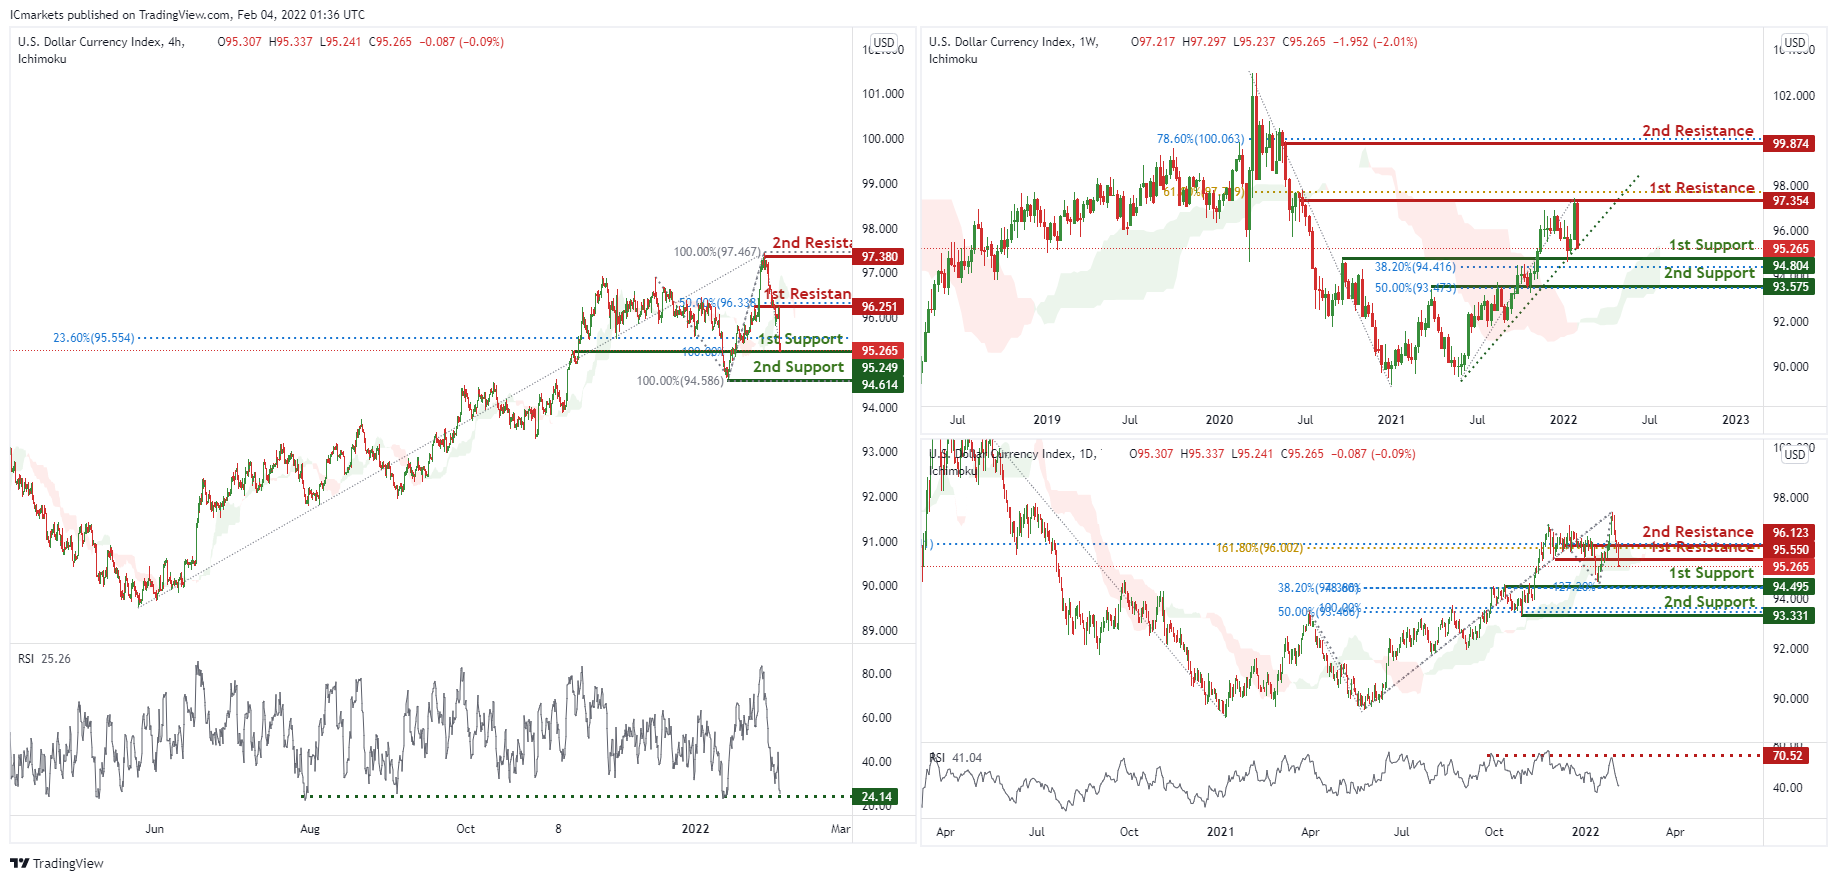
DXY:
On the weekly, prices are on bullish momentum and abiding to our ascending trendline. We see potential for prices to bounce from our 1st support at 94.804 in line with 38.2% Fibonacci retracement and 50% Fibonacci retracement towards our 1st resistance at 97.354 in line with 61.8% Fibonacci retracement. Prices are trading above our ichimoku cloud support, further supporting our bullish bias.
On the daily, prices are on bearish momentum. We see potential for prices to dip from our 1st resistance at 95.265 which is a graphical overlap towards our 1st support at 94.495 in line with 38.2% Fibonacci retracement and 78.6% Fibonacci extension. RSI are at levels where dips previously occurred.
On the H4 timeframe, prices have reached a graphical overlap and on bullish momentum. We would expect a bounce from our 1st support at 95.249 in line with 100% Fibonacci extension and 23.6% Fibonacci retracement towards our 1st resistance at 96.251 in line with 50% Fibonacci retracement. RSI is at a level where bounces previously occurred and also ichimoku clouds are forecasting bullish momentum.
Areas of consideration:
- H4 time frame, 1st resistance at 96.251
- H4 time frame, 1st support at 95.249
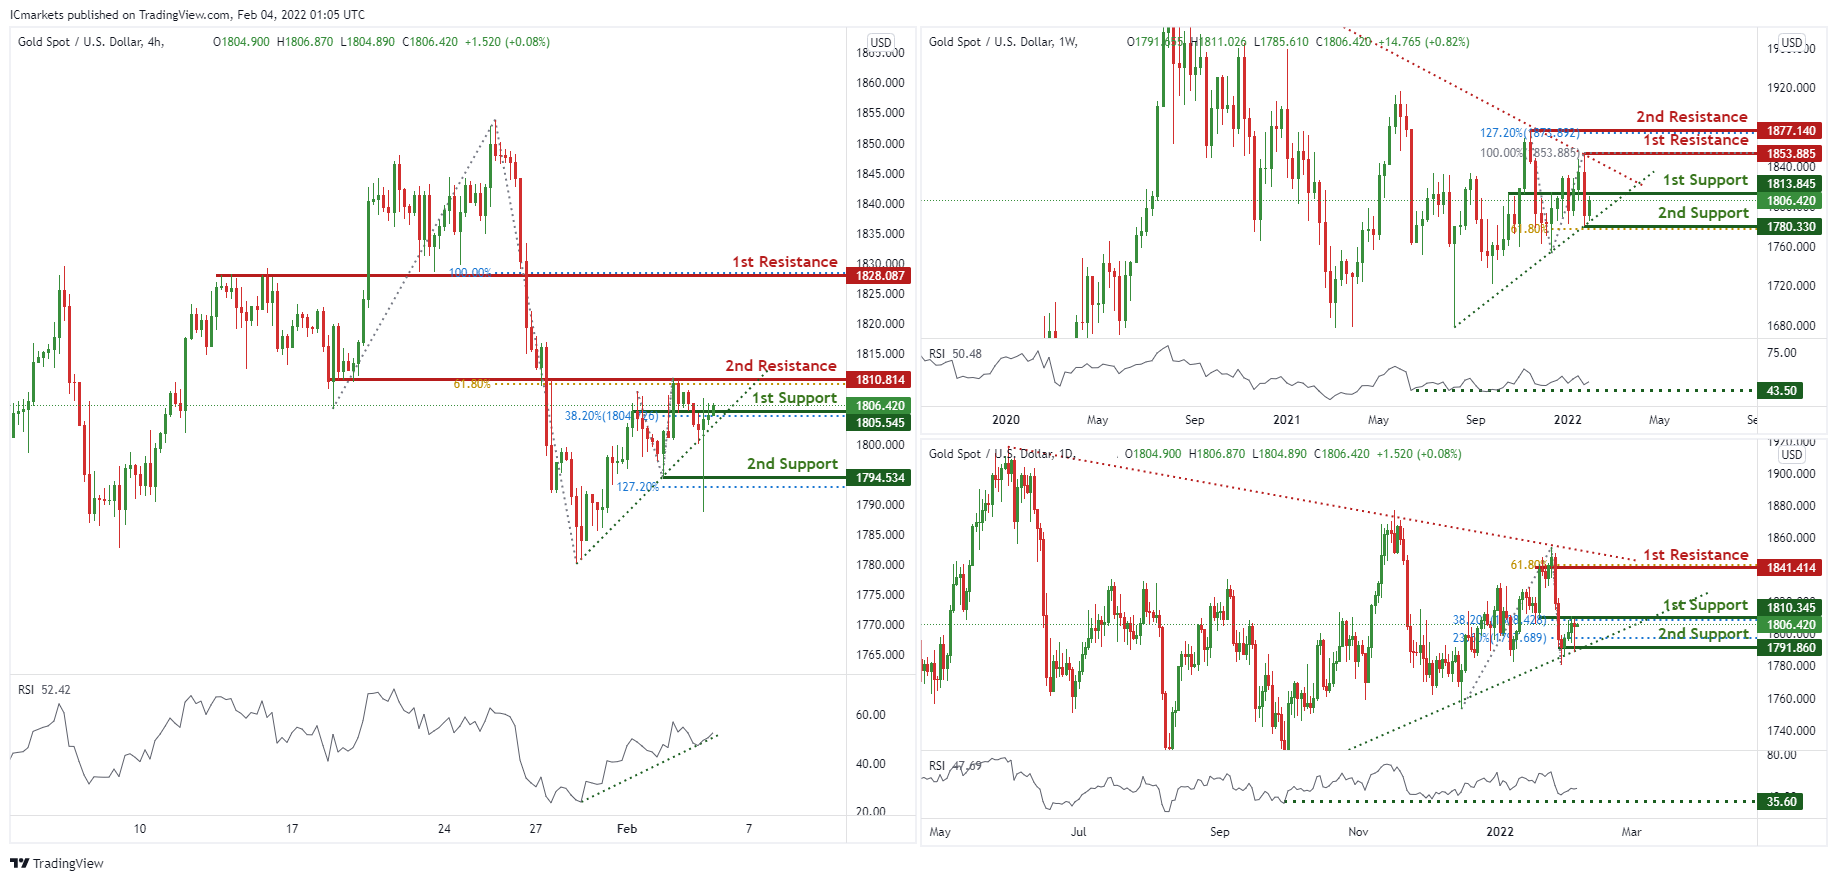
XAU/USD (GOLD):
On the weekly, prices are consolidating in a triangle and have the potential to climb from our 1st support at 1813.845 which is a graphical overlap towards our 1st resistance at 1853.885 in line with 100% Fibonacci retracement. RSI is at levels where bounces previously occur.
On the daily, prices are consolidating in a triangle. We see potential for a bounce from our 1st support at 1806.42 in line with 38.2% Fibonacci retracement towards our 1st resistance at 1841.414 in line with 61.8% Fibonacci extension. Our bias is further supported by RSI at levels where bounces previously occurred.
On the H4 chart, prices areon bullish momentum and abiding to our ascending trendline support. We see potential for prices to bounce from our 1st support at 1805.545 towards our 1st resistance at 1810.814 in line with 61.8% Fibonacci extension. RSI are on bullish momentum.
Areas of consideration:
- 4h 1st support at 1805.545
- 4h 1st resistance at 1810.814
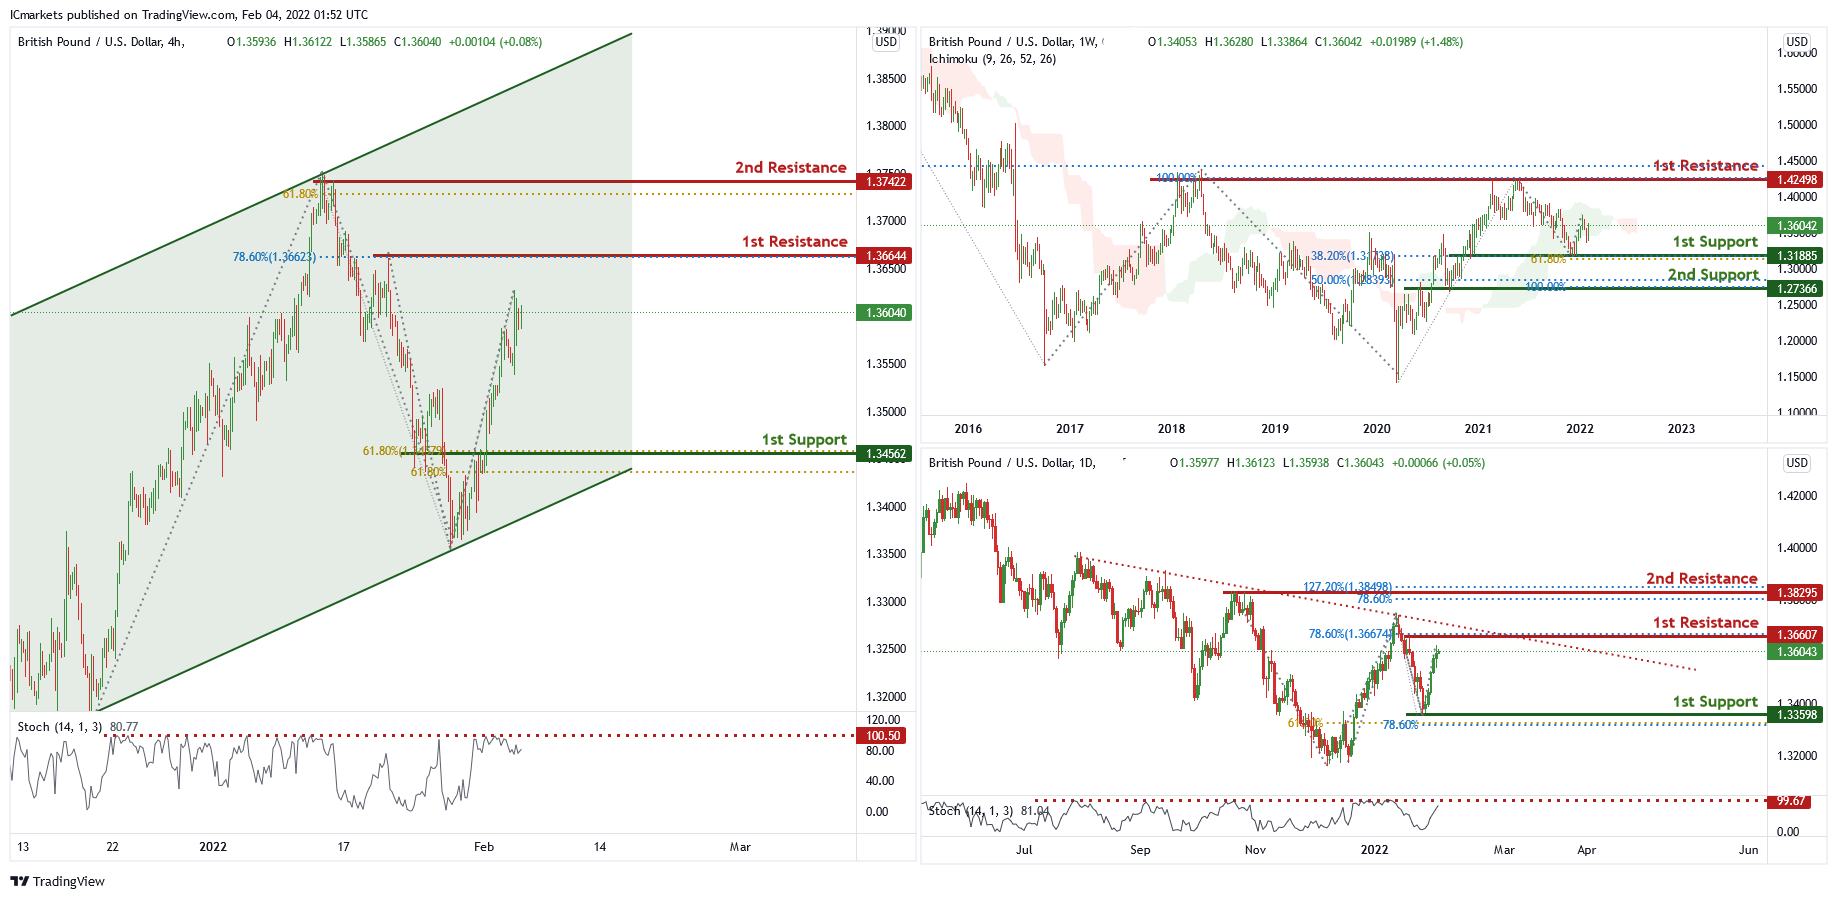
GBP/USD
On the weekly chart , price has recently bounced off the 1st support level of 1.31885 which is also 38.2% Fibonacci retracement and 61.8% Fibonacci projection. Price can potentially go to the 1st resistance level of 1.42498 which is also 100% Fibonacci projection and 50% Fibonacci retracement. Our bullish bias is supported by the ichimoku cloud indicator.
On the daily chart , price is abiding by a descending trendline and near the 1st resistance level of 1.36607 which is 78.6% Fibonacci retracement. Price can potentially dip to the 1st support level of 1.33598 which is also 61.8% Fibonacci projection and 78.6% Fibonacci retracement. Our bearish bias is supported by the stochastic indicator as it is near resistance level.
On the H4 chart, price is trading in an ascending channel and is near 1st resistance level of 1.36644 which is also 78.6% Fibonacci retracement. Price can potentially dip to the 1st support level of 1.34562 which is also 61.8% Fibonacci retracement and 61.8% Fibonacci projection. Our bearish bias is supported by a stochastic indicator as it is near resistance level.
Areas of consideration
- H4 1st support at 1.34562
- H4 1st resistance at 1.36644
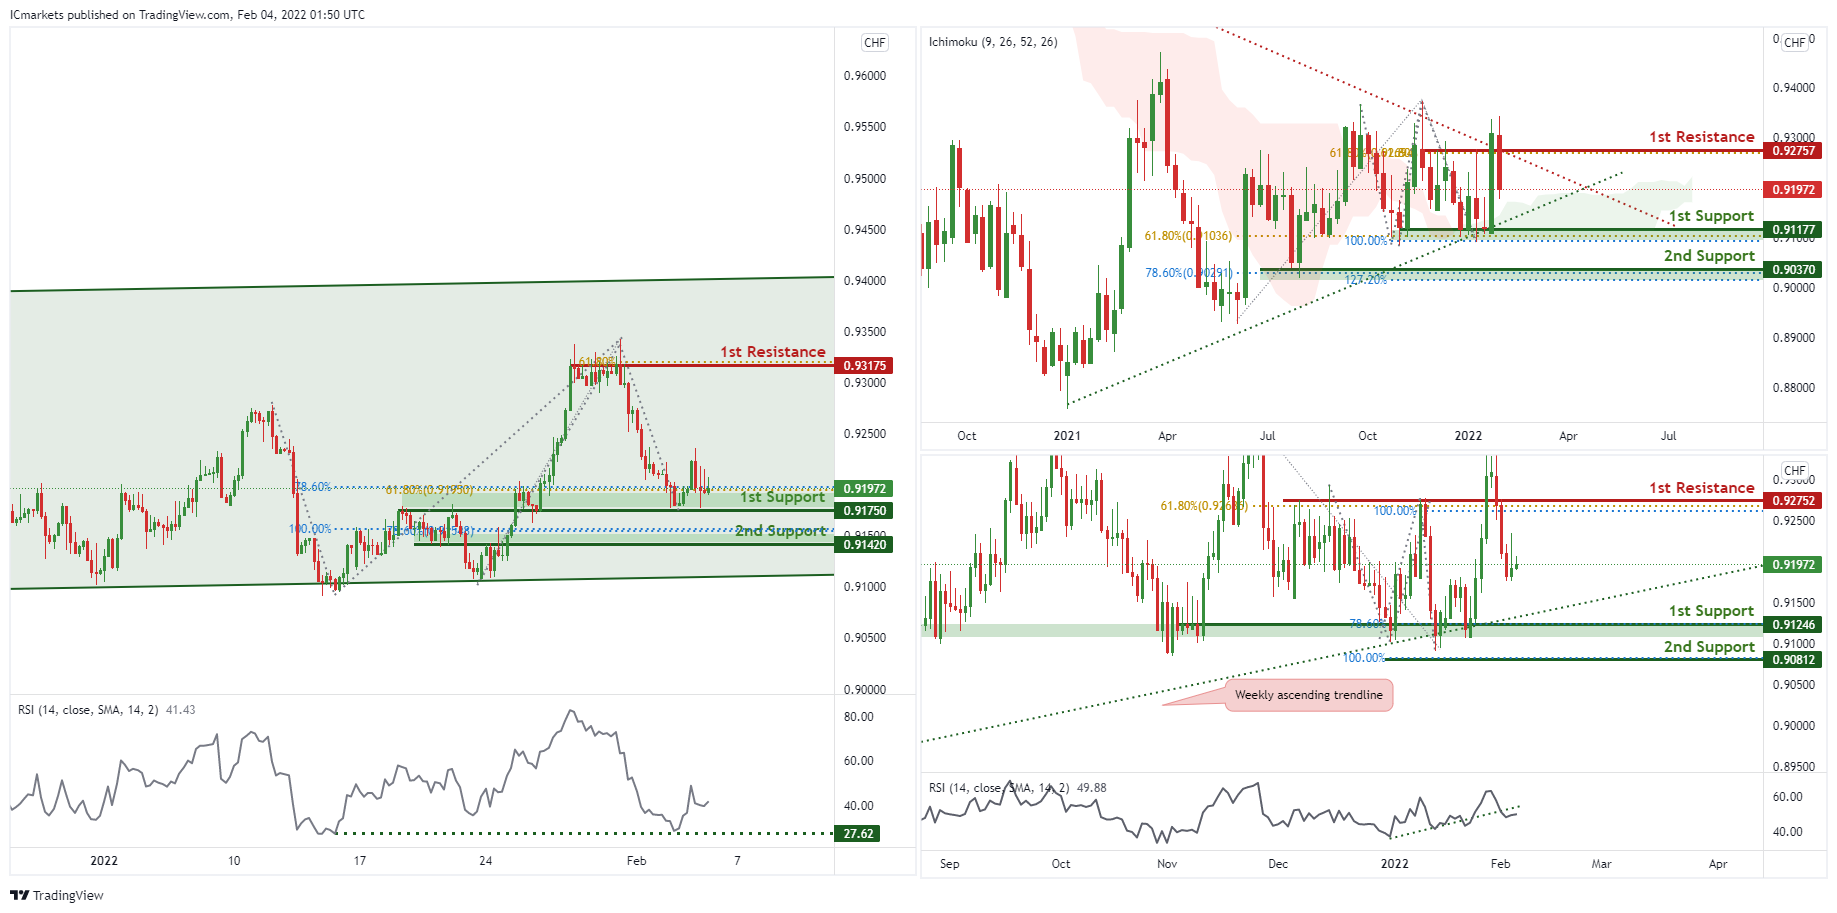
USD/CHF:
On the weekly, prices are on bearish momentum and abiding to our descending trendline. We see the potential for a dip from our 1st resistance at 0.93206 in line with 78.6% Fibonacci extension towards our 1st support at 0.91845 in line with 61.8% Fibonacci retracement. RSI is showing bearish momentum. On the daily chart, prices are hovering in between 2 levels. We see the potential for a dip if prices approach our 1st resistance at 0.93720 in line with 100% Fibonacci extension towards our 1st support at 0.92713 which is a graphical overlap. RSI are at levels where dips previously occurred. Traders should wait for prices to swing higher or lower before entering.
On the H4 timeframe,price is abiding to the daily ascending channel signifying an overall bullish momentum. We can expect the price to bounce from 1st Support in line with 78.6% Fibonacci projection and 61.8% fibonacci retracement towards 1st Resistance in line with 61.8% Fibonacci projection and previous swing high. Our bullish bias is further supported by the RSI indicator where it is at the support level.
Areas of consideration:
- Watch 1st Support at 0.91750
- Watch 1st Resistance at 0.93175
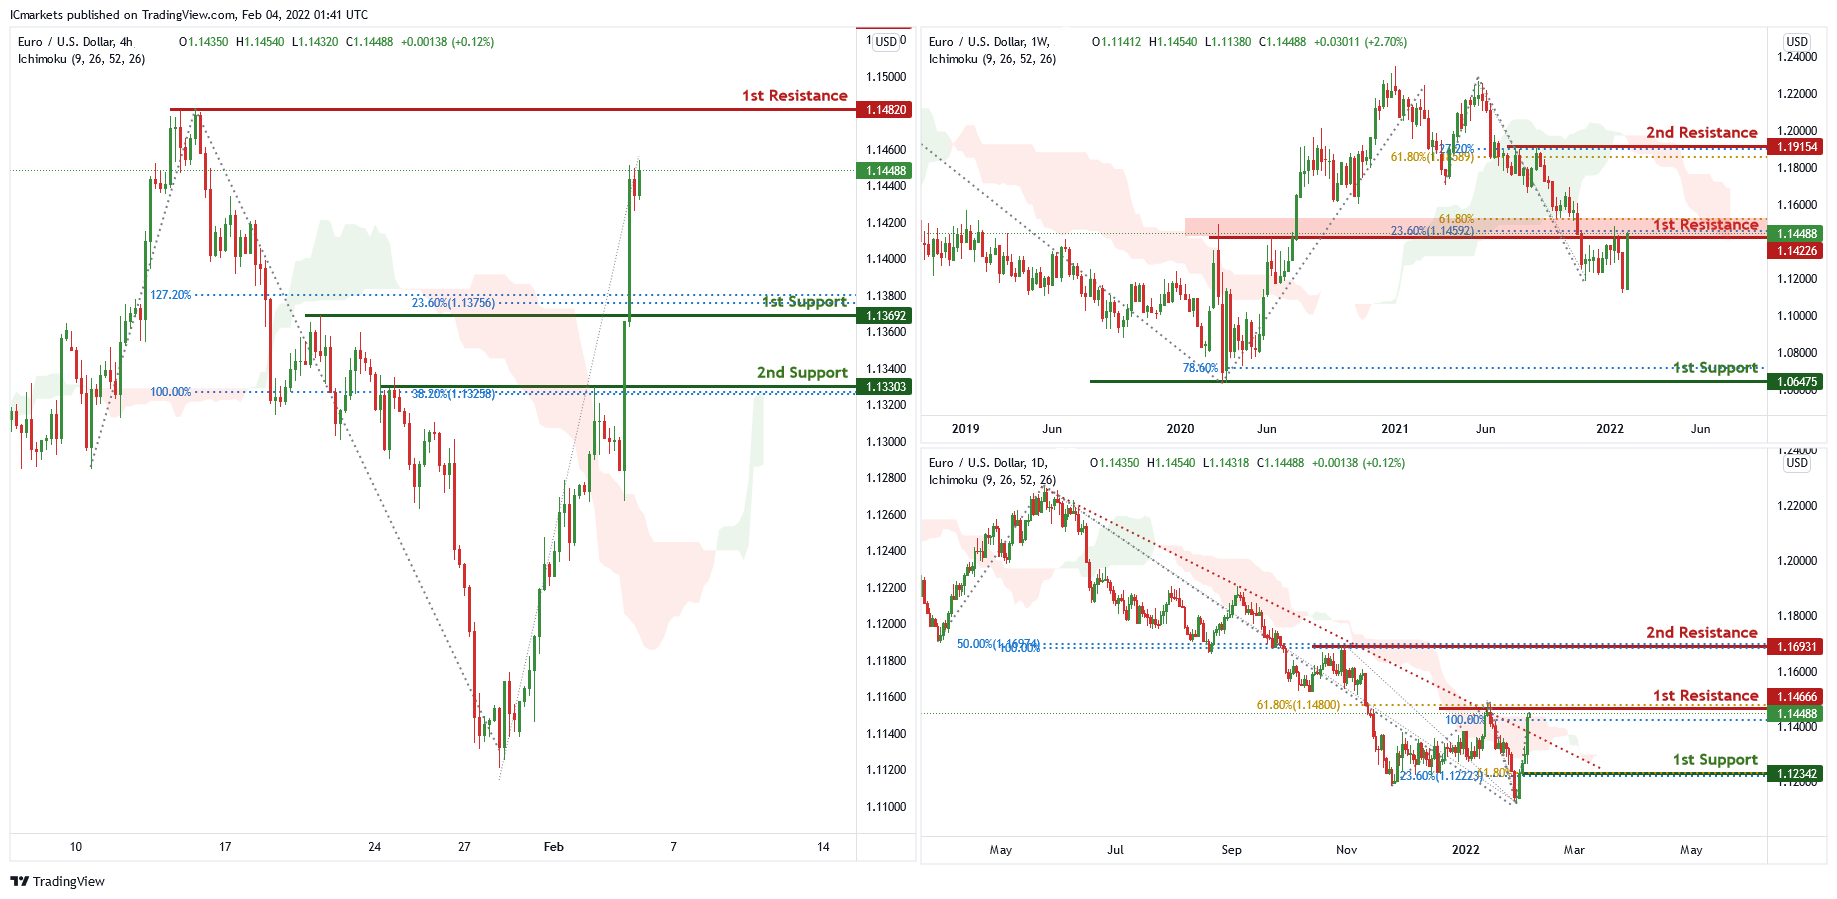
EUR/USD :
On the weekly chart, price is near 1st resistance level of 1.14226 which is also 61.8% Fibonacci projection and 23.6% Fibonacci retracement. Price can potentially dip to the 1st support level of 1.06475 which is 78.6% Fibonacci projection. Our bearish bias is supported by the ichimoku cloud indicator as price is trading below it.
On the daily chart, price has broken out of the descending trendline and is near 1st resistance level of 1.14666 which is also 100% Fibonacci projection and 61.8% Fibonacci retracement. Price can potentially go to the 2nd resistance level of 1.16931 which is 50% retracement and 100% projection. Our bullish bias is supported by the ichimoku cloud indicator as price is trading above the cloud.
On the H4 chart , price is near the 1st resistance level of 1.14820 which is the graphical swing high. Price can potentially dip to the 1st support level of 1.13692 which is also 23.6% Fibonacci retracement and 127.2% Fibonacci projection. Our bearish bias is supported by the stochastic indicator as it is near resistance level,
Areas of consideration
- H4 1st support at 1.13692
- H4 1st resistance at 1.14820
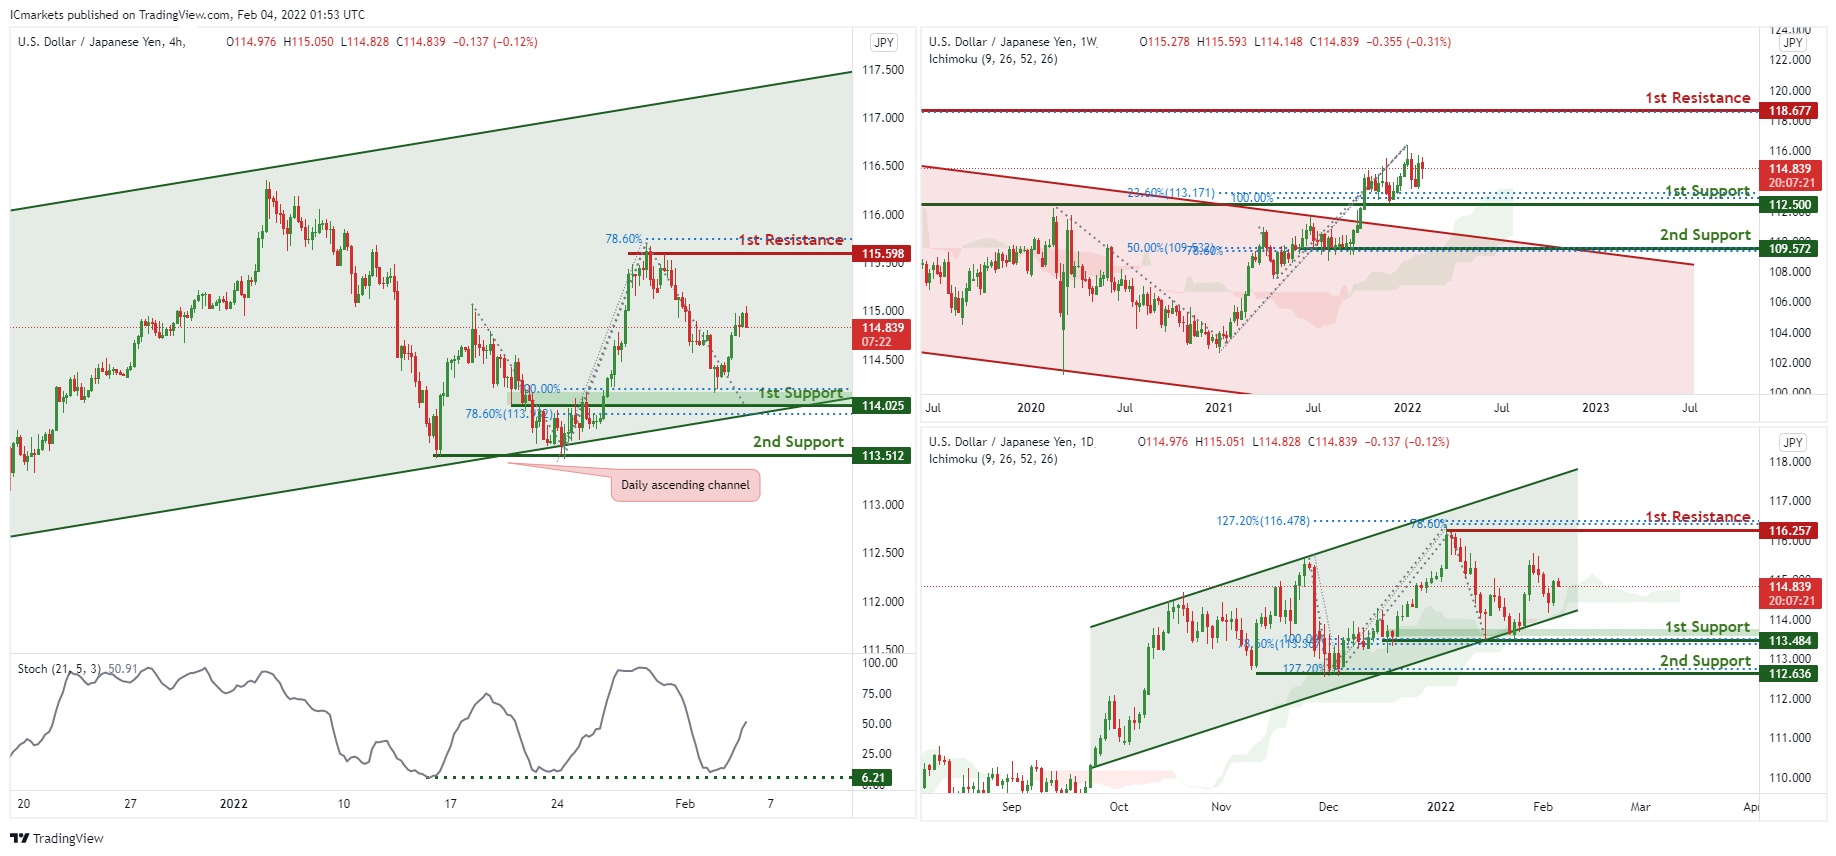
USD/JPY
On the weekly chart, price has broken out of the descending channel and near support level of 112.500 which is also 23.6% Fibonacci retracement and 100% Fibonacci projection. Price can potentially go to the 1st resistance level of 118.677 which is also 78.6% Fibonacci retracement. Our bullish bias is supported by the ichimoku cloud indicator as price is trading above it.
On the daily chart price is trading in an ascending channel and is between 1st resistance of 116.257 which is also 127.2% Fibonacci retracement , 78.6% Fibonacci projection and 1st support of 113.484 which is also 100% Fibonacci projection and 78.6% Fibonacci retracement. Our bullish bias is supported by the ichimoku cloud indicator as price is trading above it.
On the H4 chart,in reference to yesterday’s analysis, price indeed bounced at 1st Support. Price is trading in an ascending channel signifying an overall bullish momentumWe can expect price to bounce from 1st Support in line with 78.6% Fibonacci retracement and 100% Fibonacci projection towards 1st Resistance in line with 78.6% FIbonacci projection and previous swing high. Our bullish bias is further supported by the stochastic indicator where the %K line is at the support level. Traders should wait for price to swing higher or lower before entering.
Areas of consideration:
- H4 1st support at 114.025
- H4 1st resistance at 115.598
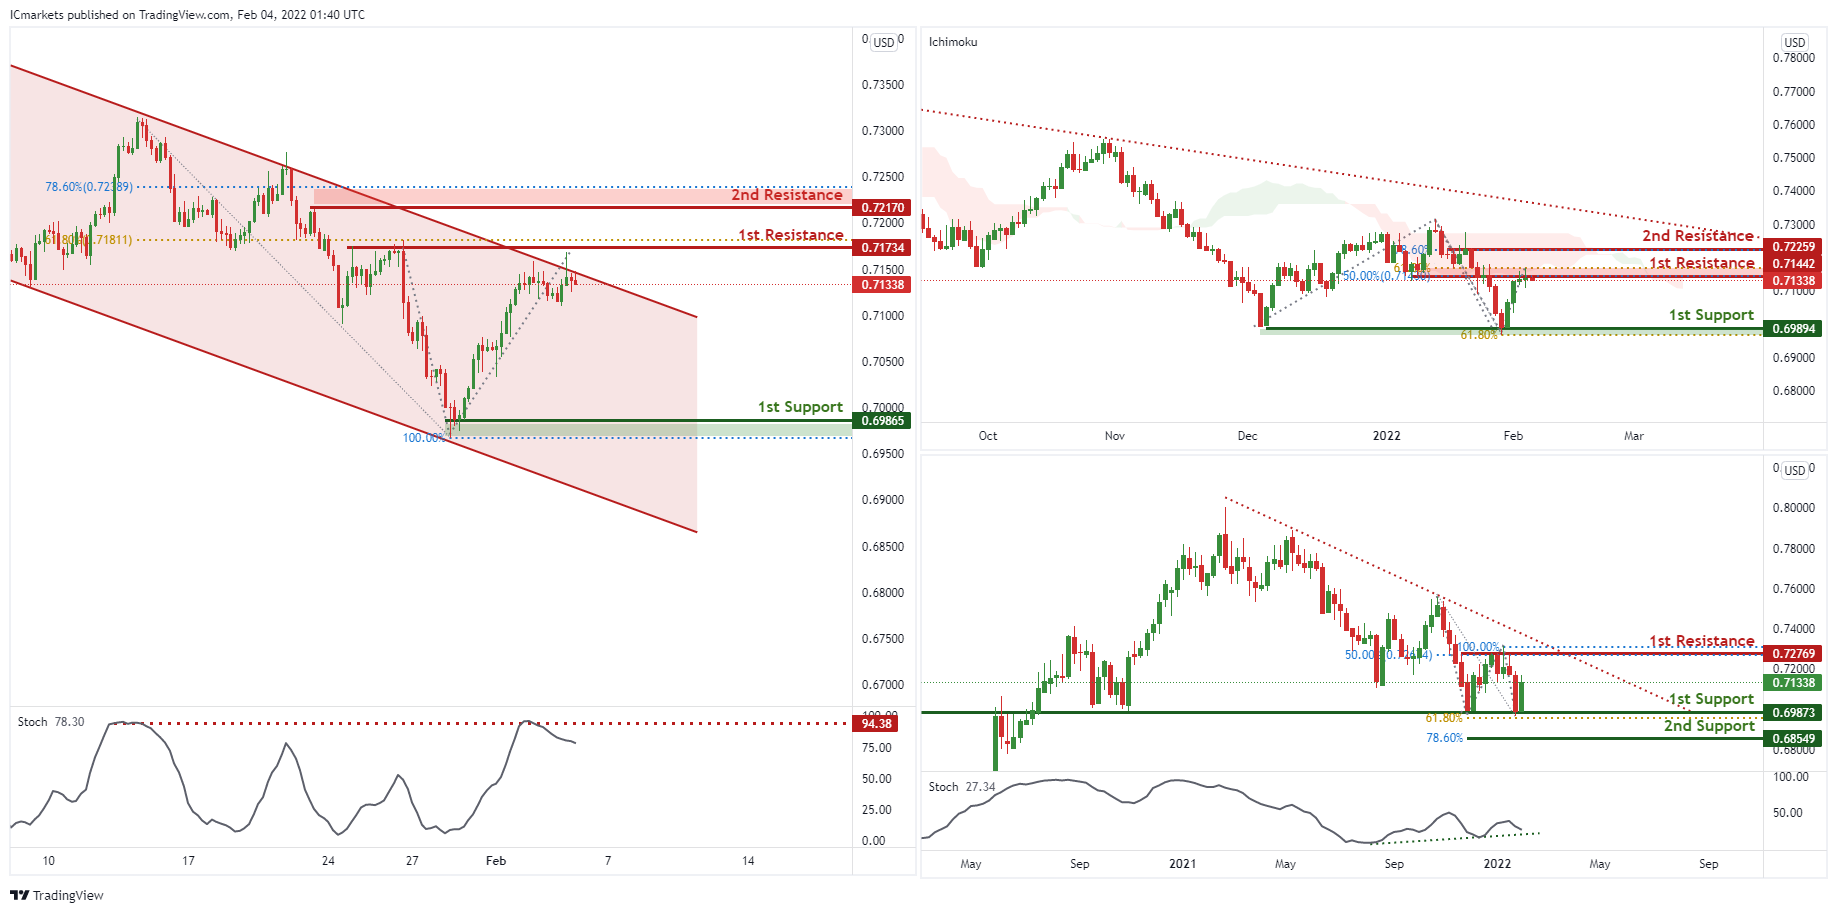
AUD/USD:
On the weekly, price is abiding to the descending trendline resistance , signifying an overall bearish momentum. However, the price bounced up at the horizontal support. We can expect price to reach 1st Resistance in line with 50% Fibonacci retracement and 100% Fibonacci projection. Traders can wait for price to swing higher or lower before entering.
On the Daily timeframe, price is abiding to the descending trendline , signifying an overall bearish momentum. We can expect the price to drop from 1st Resistance in line with 50% Fibonacci retracement and 61.8% Fibonacci projection towards 1st Support in line with horizontal support and 61.8% Fibonacci projection.
On the H4 timeframe, price is abiding to the descending channel, signifying an overall bearish momentum. We can expect price to drop from 1st Resistance in line with 50% Fibonacci retracement towards 1st Support in line with previous swing low and 78.6% Fibonacci projection. Our bearish bias is further supported by the stochastic indicator where the %K line is at the resistance level.
Areas of consideration:
- H4 1st Support level 0.69865
- H4 1st resistance level 0.71734
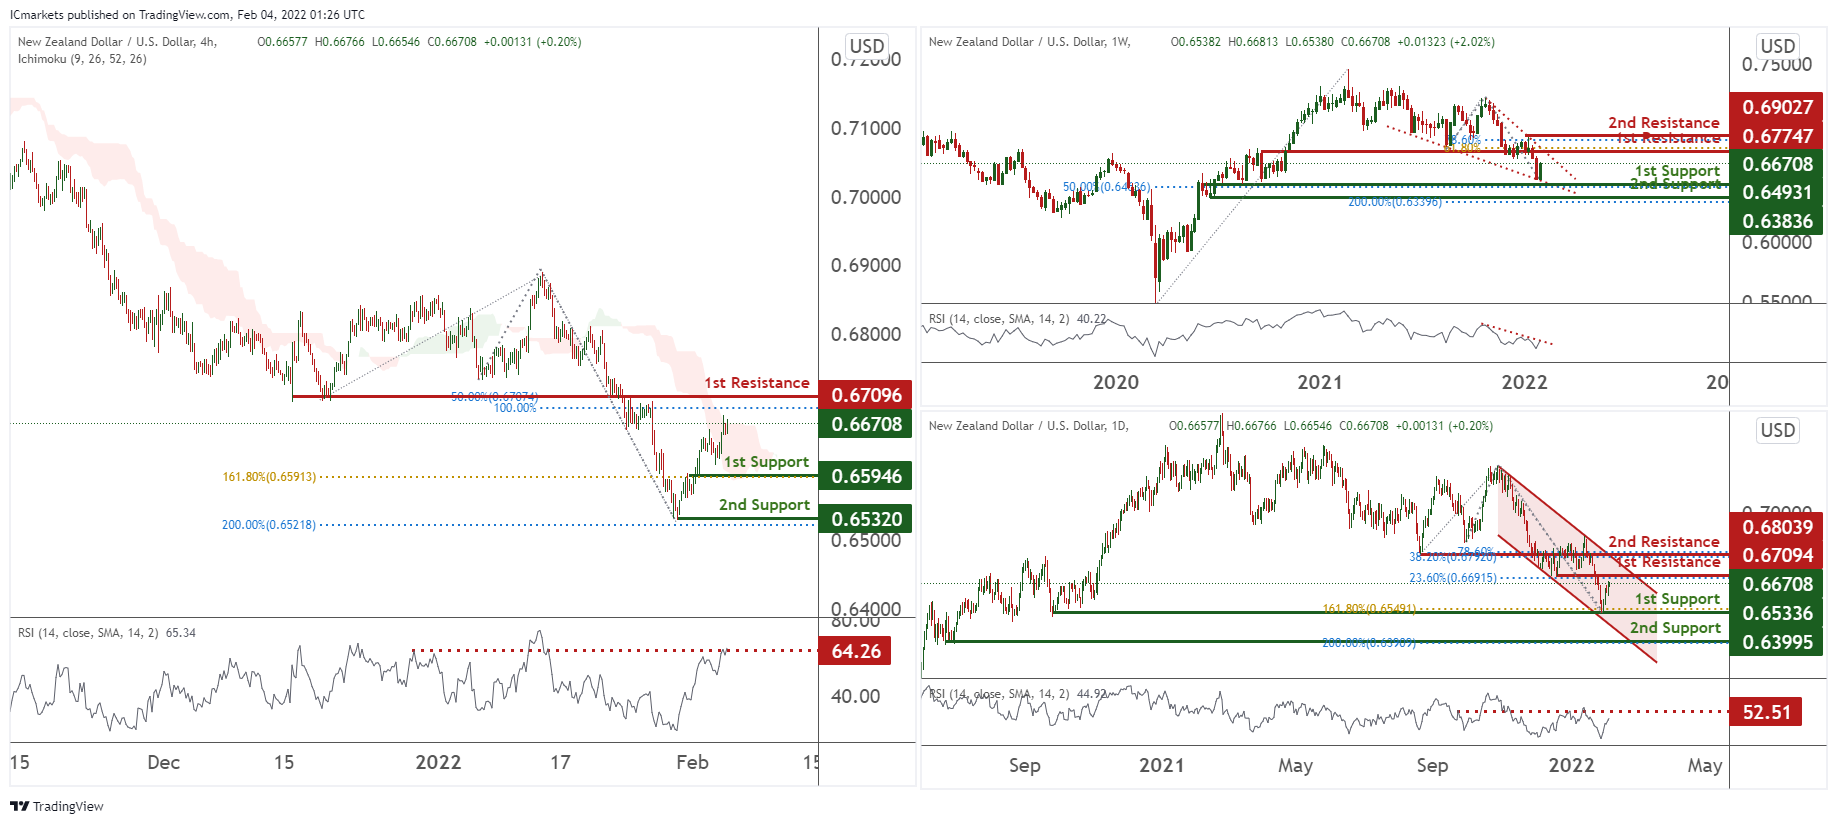
NZD/USD:
On the weekly, prices are on bearish momentum and abiding to a bearish triangle. We see potential for a dip from 1st resistance at 0.67747 in line with 61.8% Fibonacci retracement towards 1st support at 50% Fibonacci retracement. RSI is on bearish momentum.
On the daily, prices are on bearish momentum and consolidating in a bearish triangle. We see potential for prices to dip from our 1st resistance at 0.67094 in line with 23.6% Fibonacci retracement towards our 1st support at 0.65336 in line with 161.8% Fibonacci projection. RSI is at levels where dips previously occurred.
On the H4 timeframe, prices are approaching a Pivot and are on bearish momentum. We see potential for prices to dip from our 1st resistance at 0.67096 in line with 100% Fibonacci extension and 50% Fibonacci retracement towards our 1st support at 0.65946 in line with 161.8% Fibonacci Projection. Our bias is further supported by the Ichimoku Clouds forecasting bearish momentum and also RSI at a level where dips usually occur.
Areas of consideration:
- H4 time frame, 1st resistance at 0.67096
- H4 time frame, 1st support at 0.65946
USD/CAD:
On the Weekly, with price expected to reverse off the stochastics indicator, signifying an overall bearish momentum. We can expect price to drop from our 1st resistance at 1.29626 in line horizontal graphical overlap and 61.8% Fibonacci retracement towards 1st support in line with horizontal swing low support at 1.23427. Alternatively, price may break 1st resistance structure and head for 2nd resistance, which coincides with the horizontal swing high resistance at 1.33505. Traders should wait for prices to swing higher or lower before entering.
On the Daily, with price expected to break the ichimoku cloud, signifying an overall bearish momentum. We can expect price to drop from our 1st resistance at 1.27690 in line horizontal graphical overlap and 61.8% Fibonacci retracement towards 1st support in line with horizontal overlap support ,50% Fibonacci retracement level at 1.26213. Alternatively, price may break 1st resistance structure and head for 2nd resistance, which coincides with the horizontal swing high resistance at 1.28643. Traders should wait for prices to swing higher or lower before entering.
On the H4, with prices moving above the ichimoku cloud, we see the potential for a bounce from our 1st support at 1.26490 in line with horizontal swing low support and 61.8% Fibonacci retracement towards our 1st resistance at 1.27966 in line with horizontal swing high resistance and 61.8% Fibonacci retracement. Alternatively, price may break 1st support structure and head for 2nd support at 1.25771, in line with 61.8% Fibonacci retracement and horizontal swing low support.
Areas of consideration:
- H4 time frame, 1st support at 1.26490
- H4 time frame, 1st resistance at 1.27966
OIL:
On the Weekly, with price expected to reverse off the stochastics indicator, signifying an overall bearish momentum. We can expect price to drop from our 1st resistance at 92.95 in line horizontal swing high overlap and 127.2% Fibonacci extension towards 1st support in line with horizontal overlap support ,161.8% Fibonacci extension level at 86.84. Alternatively, price may break 1st resistance structure and head for 2nd resistance, which coincides with the horizontal swing high resistance at 99.62. Traders should wait for prices to swing higher or lower before entering.
On the Daily, with price expected to reverse off the stochastics indicator, signifying an overall bearish momentum. We can expect price to drop from our 1st resistance at 92.14 in line horizontal swing high overlap and 127.2% Fibonacci extension towards 1st support in line with horizontal overlap support ,23.6% Fibonacci retracement level at 85.05. Alternatively, price may break 1st resistance structure and head for 2nd resistance, which coincides with the horizontal swing high resistance at 99.13. Traders should wait for prices to swing higher or lower before entering.
On the H4, with price expected to reverse off the stochastics indicator, signifying an overall bearish momentum. We can expect price to drop from our 1st resistance at 91.56 in line horizontal graphical overlap and 78.6% Fibonacci retracement towards 1st support in line with horizontal overlap support ,61.8% Fibonacci retracement level at 88.13. Alternatively, price may break 1st resistance structure and head for 2nd resistance, which coincides with the horizontal swing high resistance at 92.79. Traders should wait for prices to swing higher or lower before entering.
Areas of consideration:
- H4 time frame, 1st resistance of 91.56
- H4 time frame, 1st support of 88.13
Dow Jones Industrial Average:
On the Weekly, with price moving above the ichimoku cloud, signifying an overall bullish momentum. We can expect price to rise to our 1st resistance at 36579 in line horizontal graphical swing high resistance and 161.8% Fibonacci extension from our 1st support in line with horizontal overlap support and 78.6% Fibonacci retracement level at 33753. Alternatively, price may break 1st support structure and head for 2nd support, which coincides with 127.2% Fibonacci extension level at 32286.
On the Daily, with price moving below the ichimoku cloud, signifying an overall bearish momentum. We can expect price to drop from our 1st resistance at 36452 in line horizontal graphical swing high resistance and 78.6% Fibonacci retracement towards 1st support in line with horizontal overlap support ,50% Fibonacci retracement level at 34737. Alternatively, price may break 1st resistance structure and head for 2nd resistance, which coincides with the horizontal swing high resistance at 36452. Traders should wait for prices to swing higher or lower before entering.
On the H4, with price moving above the ichimoku cloud, signifying an overall bullish momentum. We can expect price to rise to our 1st resistance at 35728 in line horizontal graphical swing high resistance and 78.6% Fibonacci retracement from our 1st support in line with horizontal overlap support and 23.6% Fibonacci retracement level at 35028. Alternatively, price may break 1st support structure and head for 2nd support, which coincides with 50% Fibonacci retracement level at 34430.
Areas of consideration:
- H4 time frame, 1st resistance of 35728
- H4 time frame, 1st support of 35028


