
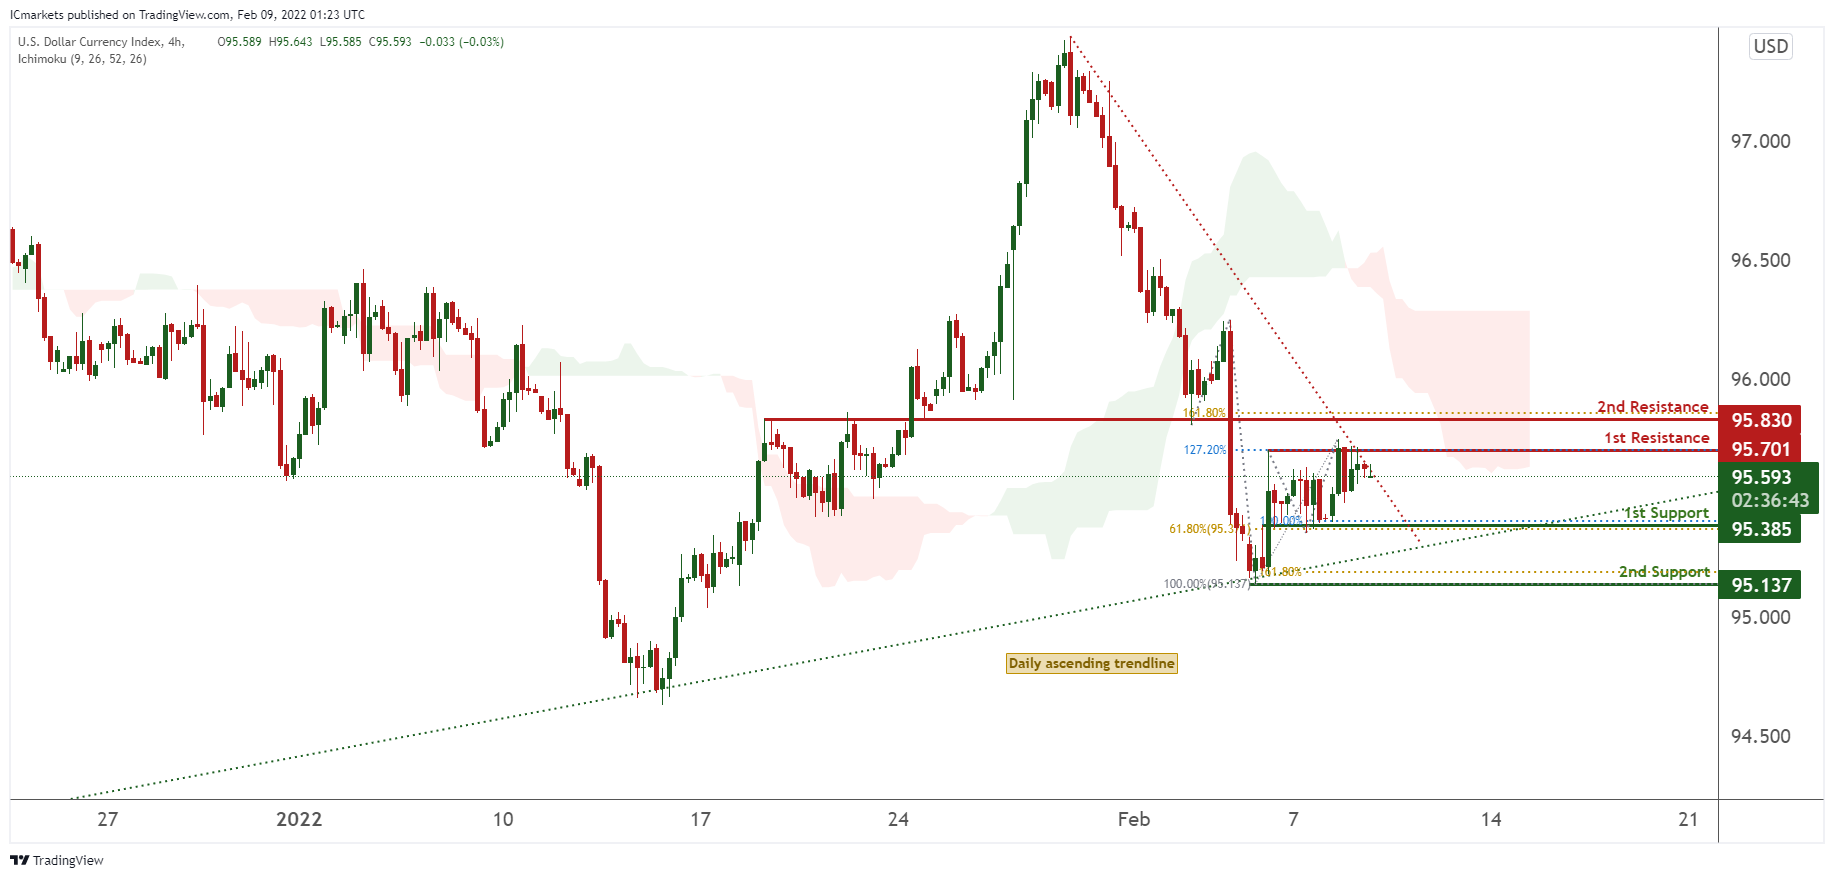
DXY:
On the H4 timeframe, prices are on bearish momentum and consolidating in a triangular pattern. We see the potential for a dip from our 1st resistance at 95.701 in line with 127.2% Fibonacci extension and graphical overlap towards our 1st support at 95.385 in line with 100% Fibonacci extension and 61.8% Fibonacci extension. Our bearish bias is further supported by our ichimoku portraying bearish momentum.
Areas of consideration:
- H4 time frame, 1st resistance at 95.701
- H4 time frame, 1st support at 95.385
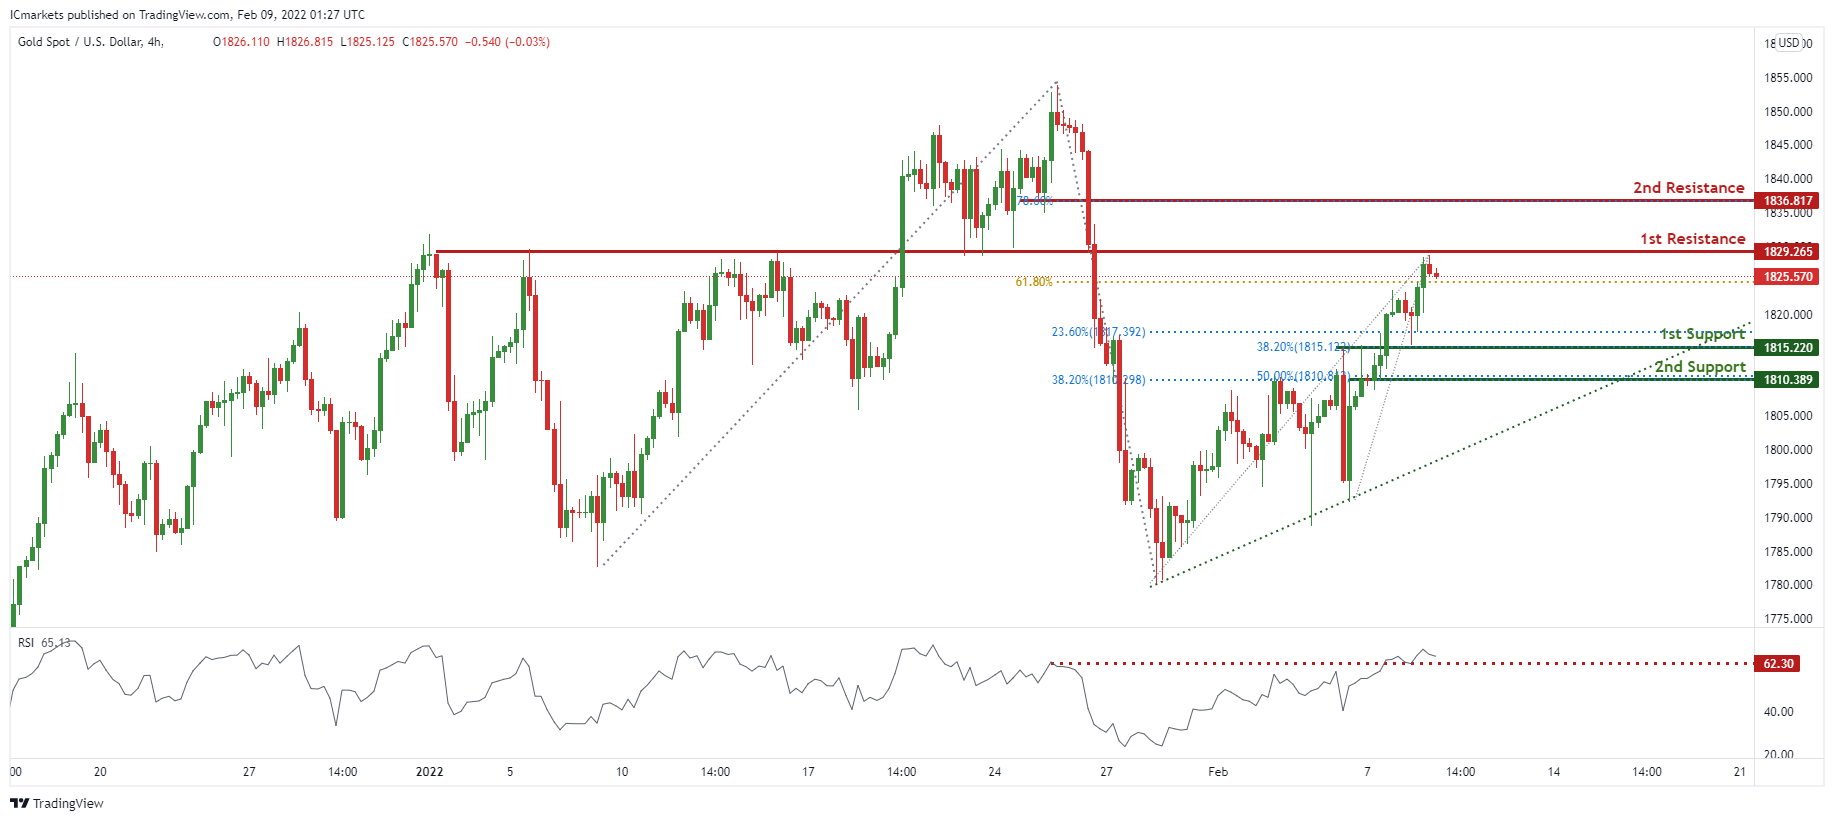
XAU/USD (GOLD):
On the H4 chart, prices are at a pivot and strong graphical overlap resistance. We see potential for a pullback from our 1st resistance at 1829.265 in line with 61.8% Fibonacci retracement towards our 1st support at 1815.220 in line with 23.6% Fibonacci retracement and 38.2% Fibonacci retracement. RSI are at levels where dips previously occurred.
Areas of consideration:
- 4h 1st support at 1815.220
- 4h 1st resistance at 1829.265
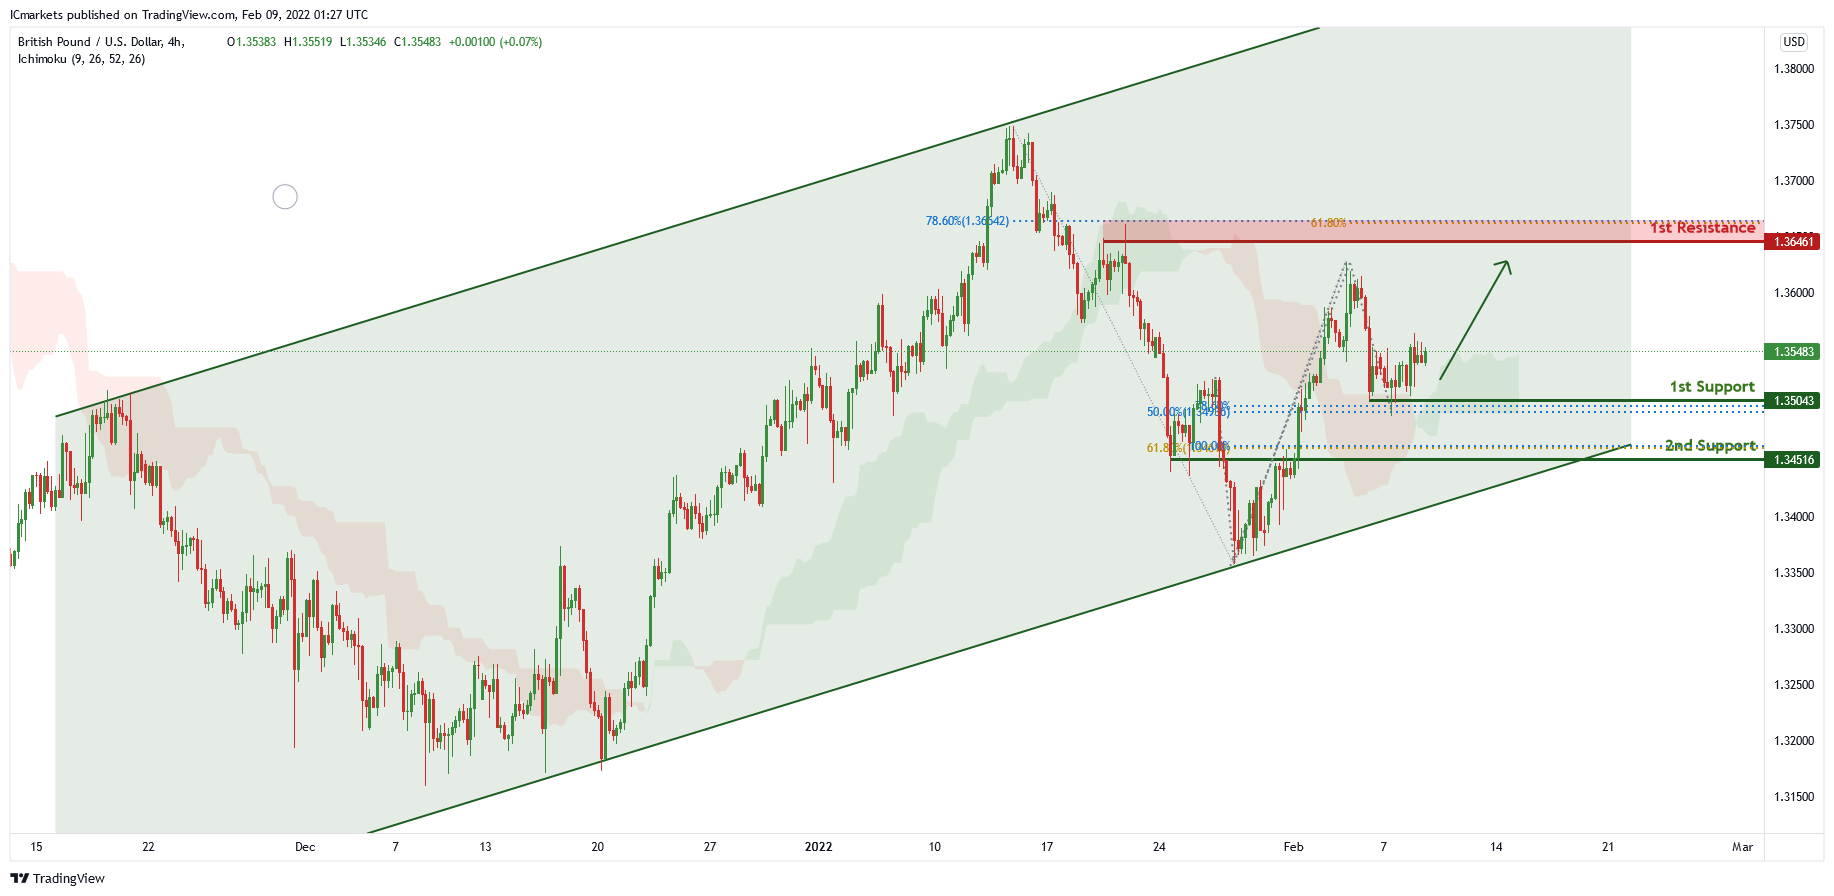
GBP/USD
In the H4 chart , price is trading in an ascending channel and near 1st support level of 1.35043 which is also 50% Fibonacci retracement and 78.6% Fibonacci projection. Price can potentially continue its bullish momentum to the 1st resistance level of 1.36461 in line with 61.8% Fibonacci projection and 78.6% Fibonacci retracement. Our bullish bias is supported by the ichimoku cloud indicator as price is trading above it.
Areas of consideration:
- H4 1st resistance 1.36461
- H4 1st support 1.35043
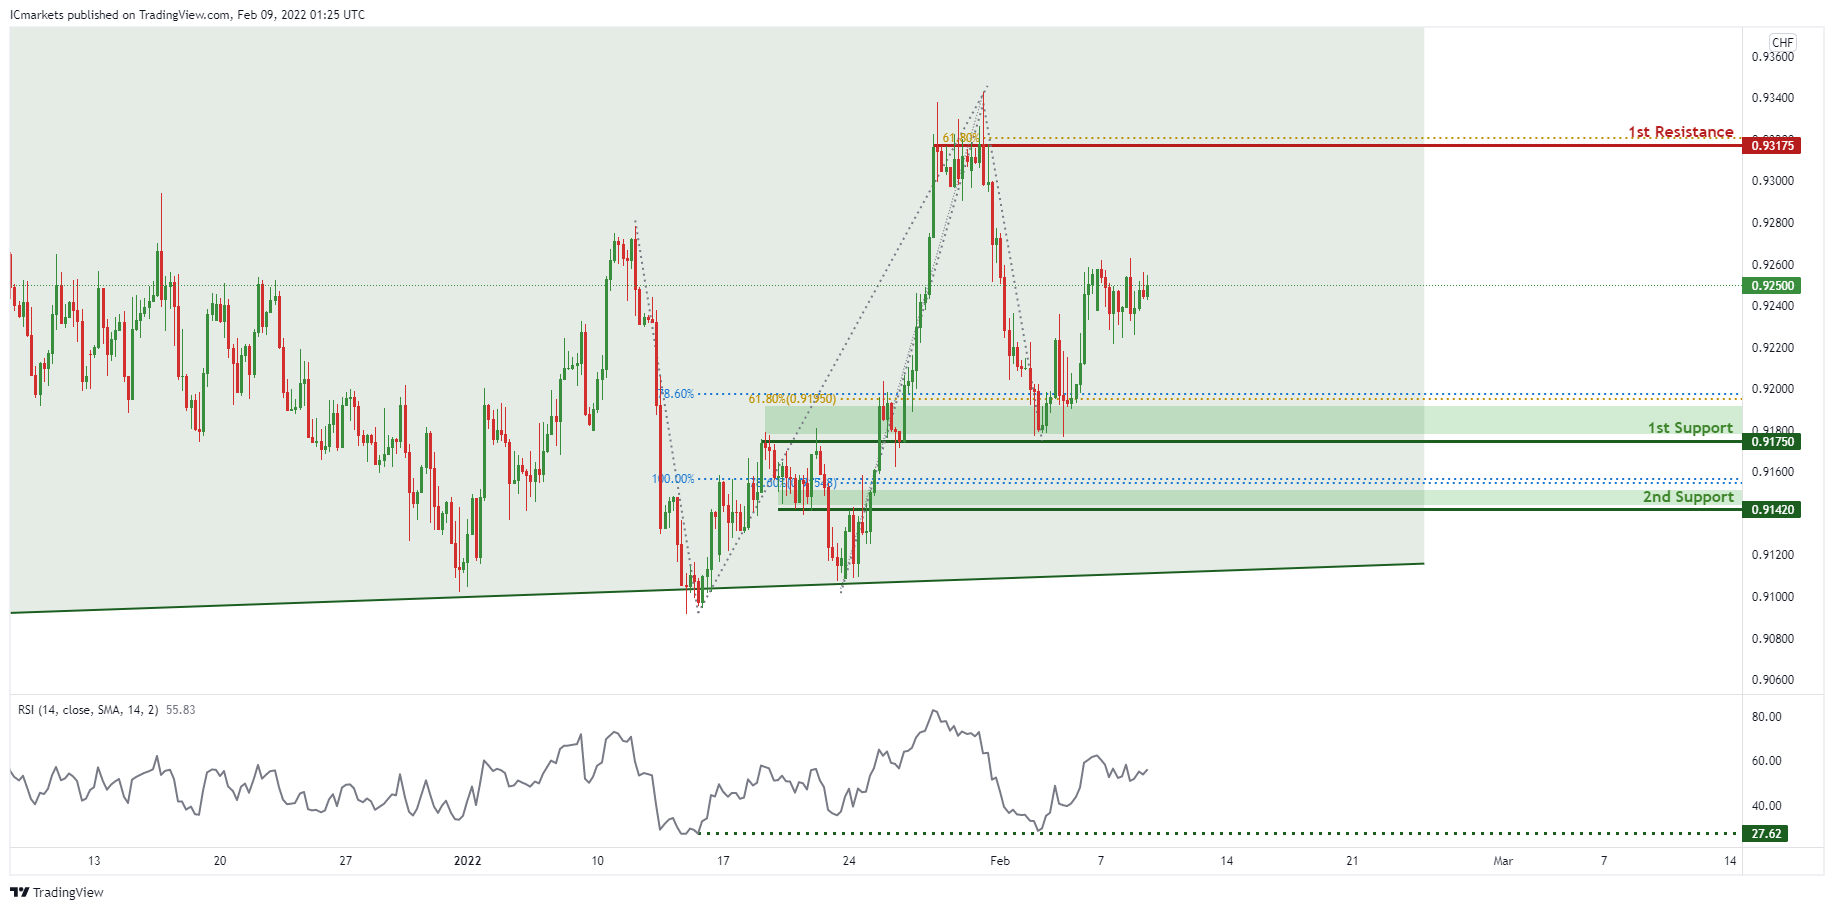
USD/CHF:
On the H4 timeframe,in reference to last week’s analysis price indeed bounced at the 1st Support level. Price is abiding to the daily ascending channel signifying an overall bullish momentum. We can expect the price to bounce from 1st Support in line with 78.6% Fibonacci projection and 61.8% fibonacci retracement towards 1st Resistance in line with 61.8% Fibonacci projection and previous swing high. Our bullish bias is further supported by the RSI indicator where it is at the support level. Traders should wait for prices to swing higher or lower before entering.
Areas of consideration:
- Watch 1st Support at 0.91750
- Watch 1st Resistance at 0.93175
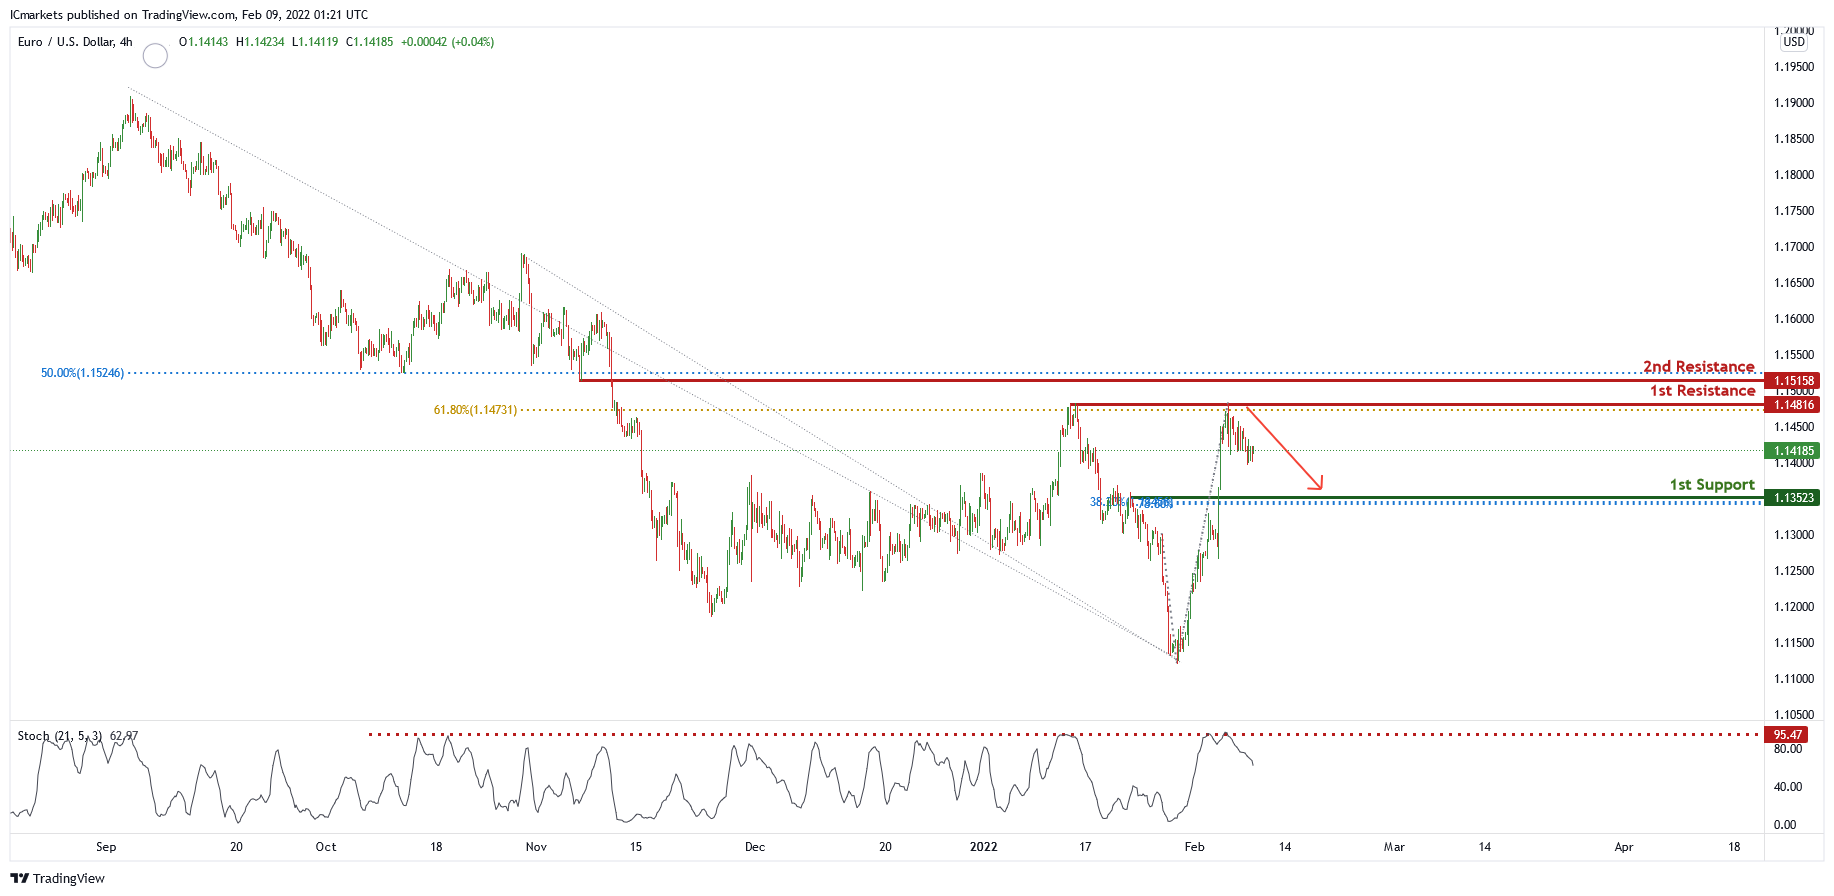
EUR/USD :
On the H4 chart, price is near the 1st resistance level of 1.14816 which is also 61.8% Fibonacci retracement. Price can potentially dip to the 1st support level of 1.13523 in line with 38.2% Fibonacci retracement and 78.6% Fibonacci projection. Our bearish bias is supported by the stochastic indicator as price is trading below it.
Areas of consideration :
- H4 1st support at 1.13523
- H4 1st resistance at 1.14816
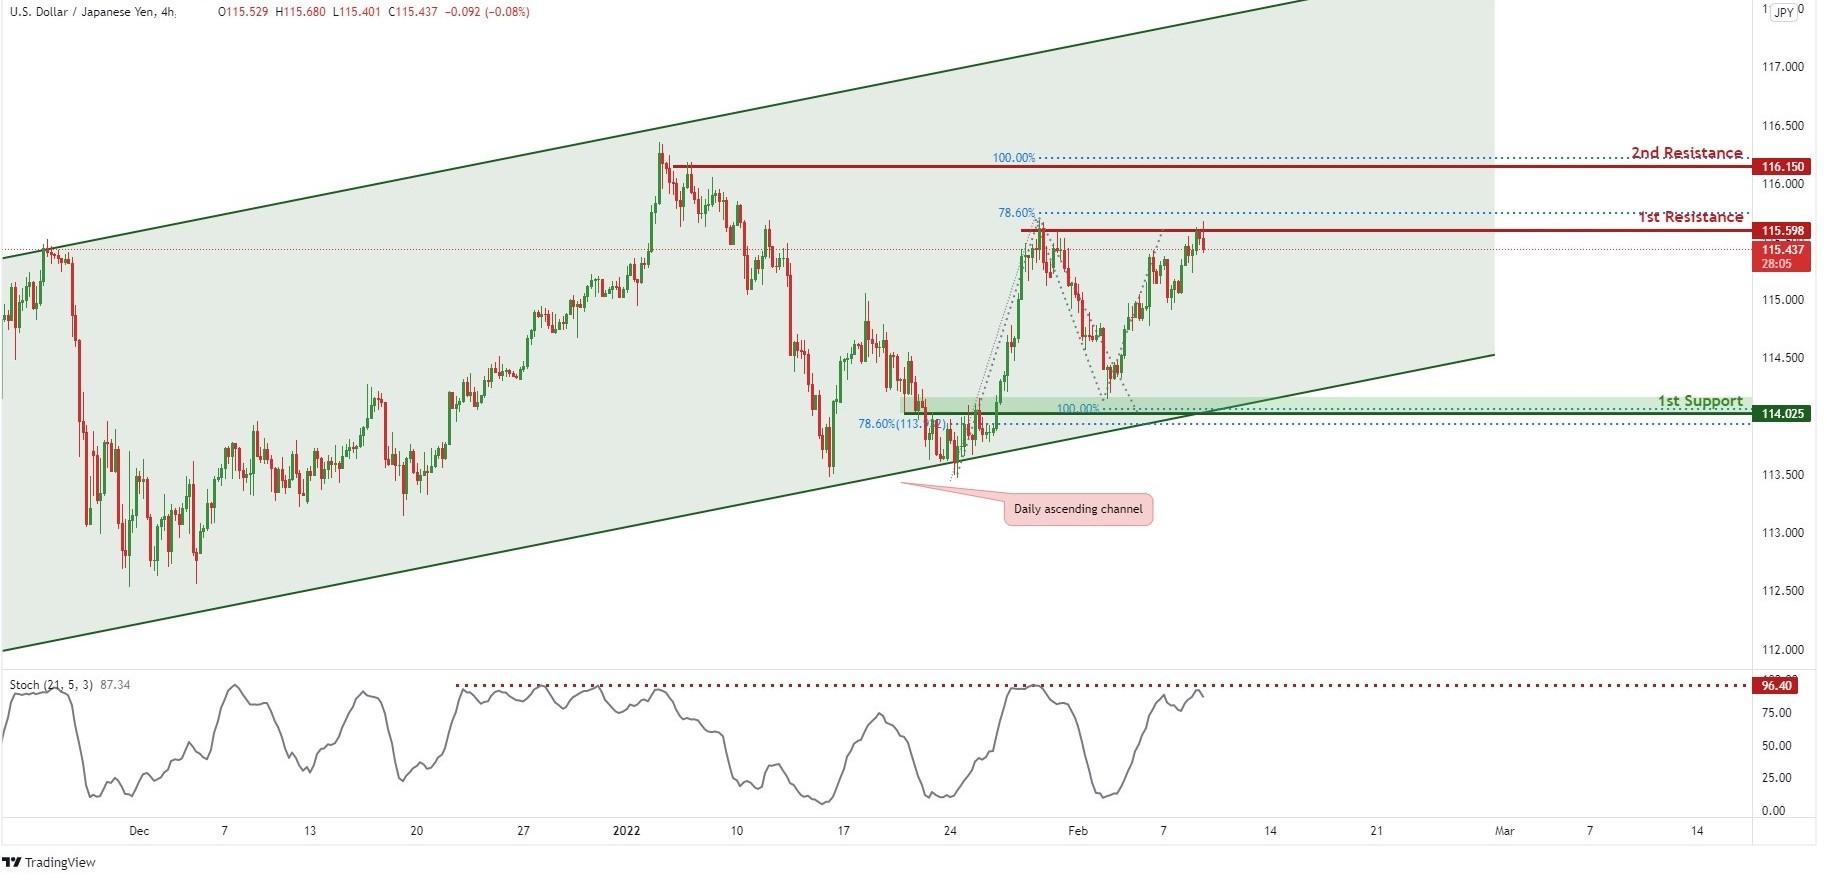
USD/JPY
On the H4 chart,in reference to last week’s analysis, price indeed bounced at 1st Support and it is reaching our potential 1st Resistance level @ 115.598.
Price is trading in an ascending channel signifying an overall bullish momentum, however, we can expect a short-term bearish drop from 1st Resistance level in line with horizontal resistance and 78.6% Fibonacci projection towards 1st Support in line with previous swing low and 100% Fibonacci projection. Our bearish bias is further supported by the stochastic indicator where the %K line is at the resistance level.
Areas of consideration:
- H4 1st support at 114.025
- H4 1st resistance at 115.598
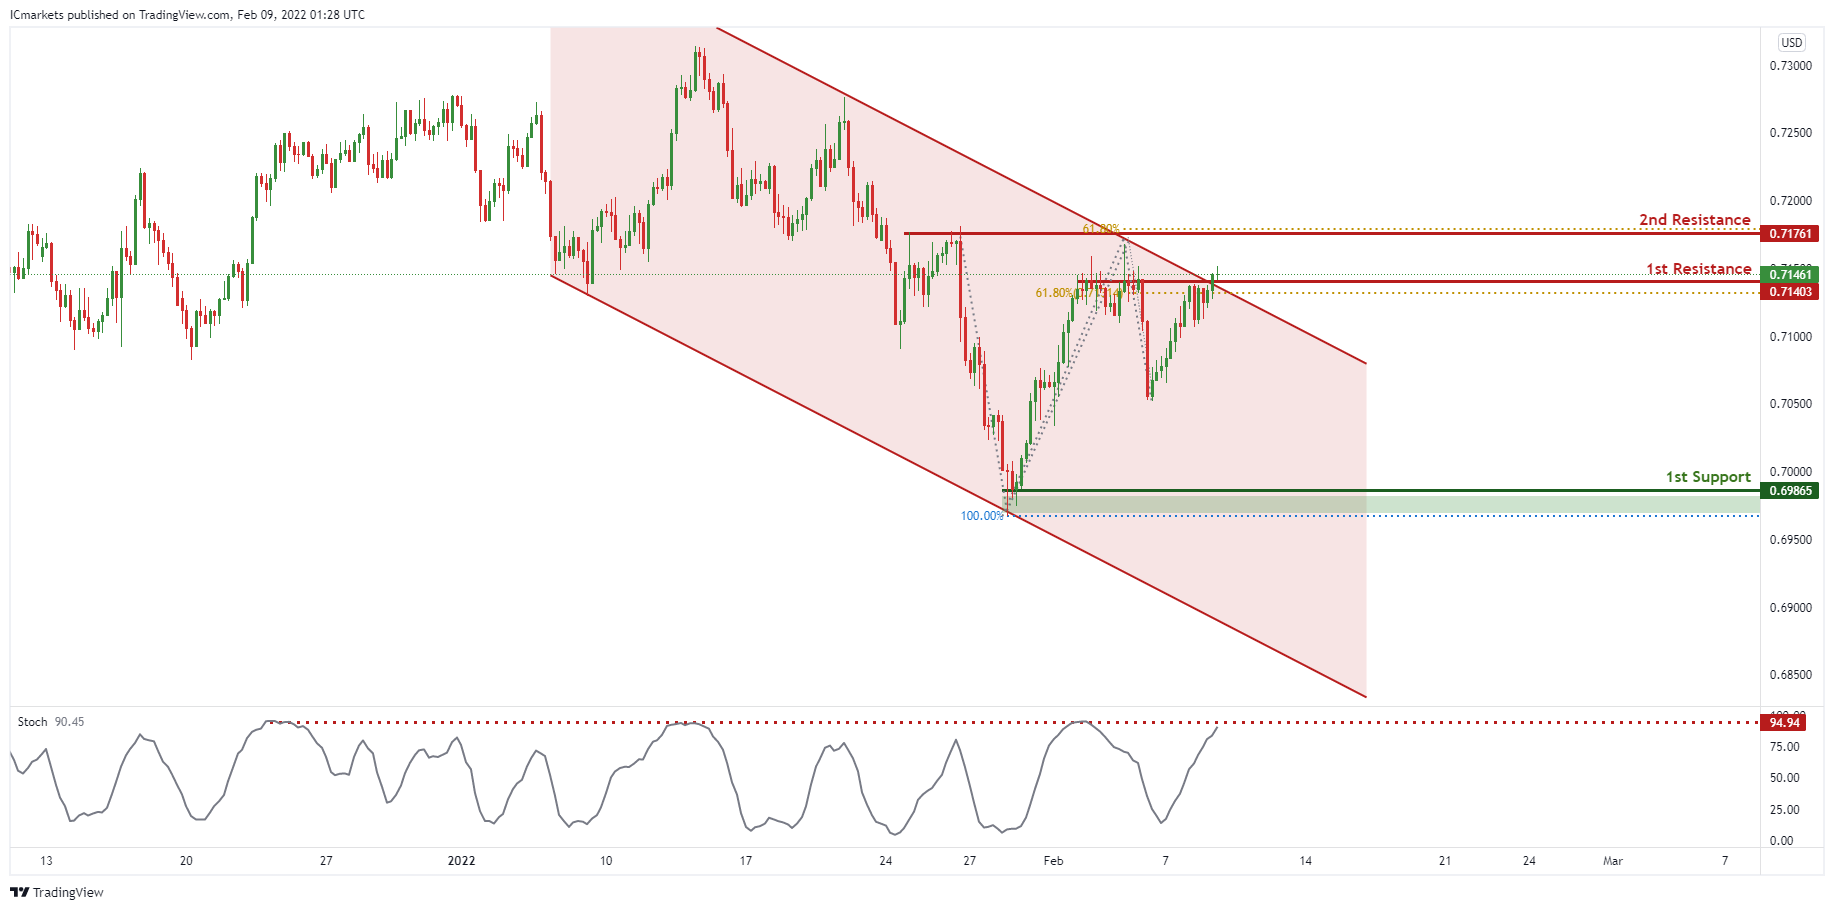
AUD/USD:
Price is abiding to the descending channel, signifying an overall bearish momentum. We can expect price to drop from 1st Resistance in line with 61.8% Fibonacci retracement towards 1st Support in line with previous swing low and 100% Fibonacci projection. Our bearish bias is further supported by the stochastic indicator where the %K Line is at the resistance level.
Areas of consideration:
- H4 1st Support level 0.69865
- H4 1st resistance level 0.71403
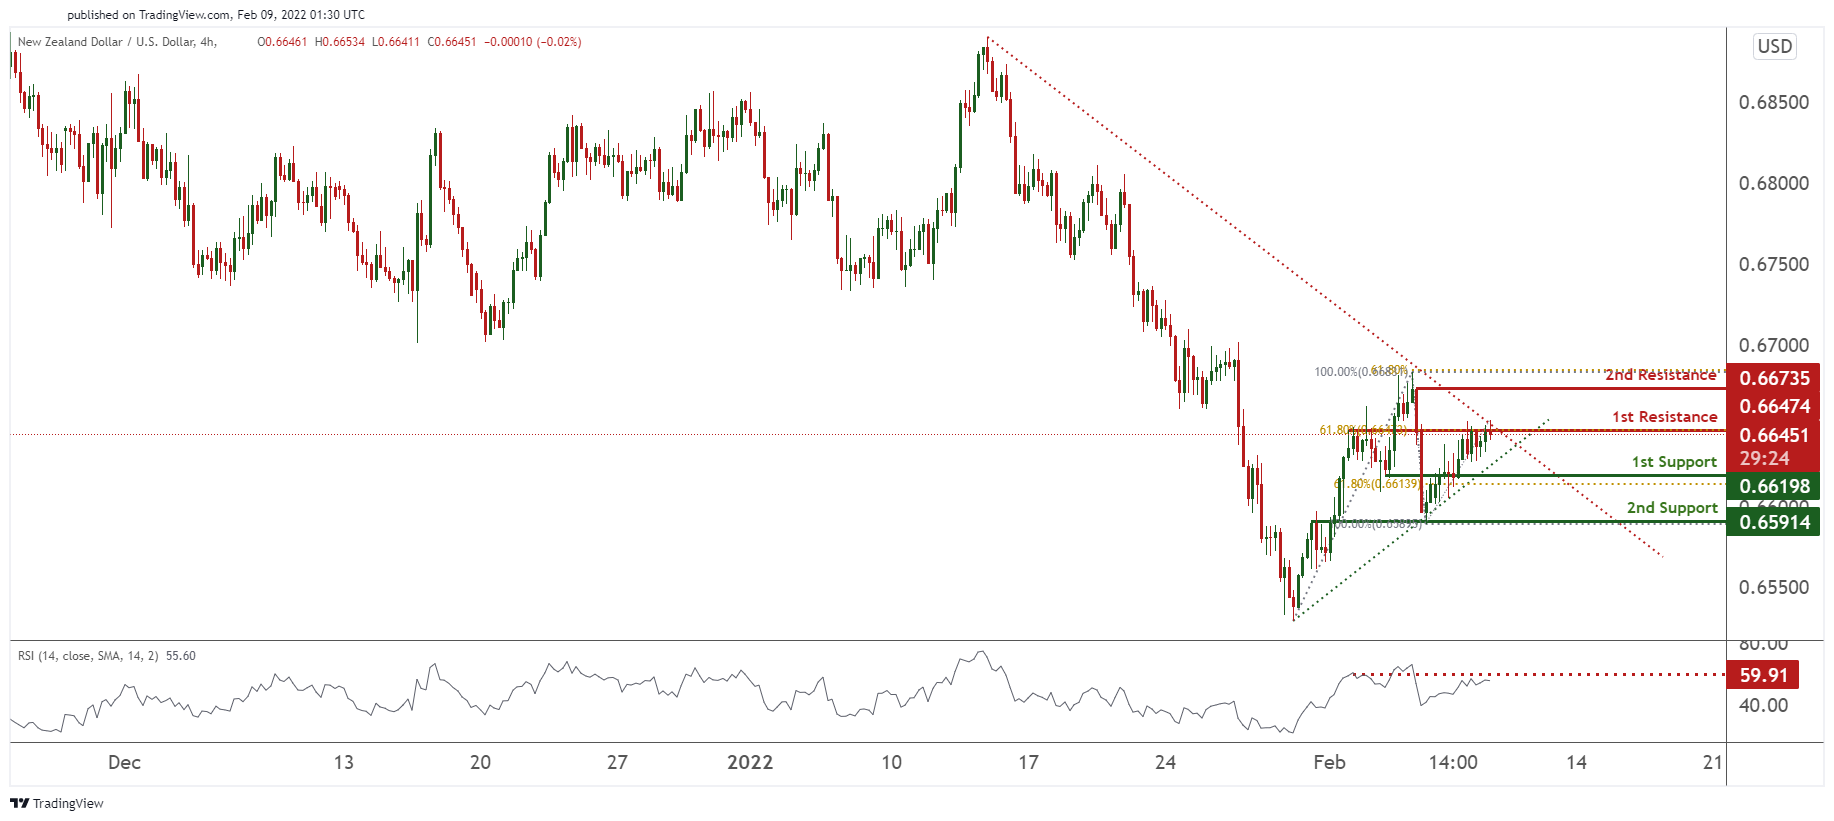
NZD/USD:
On the H4 timeframe, prices were on bearish momentum and are abiding to our descending trendline. We see potential for prices to dip from our 1st resistance at 0.66474 in line with 61.8% Fibonacci retracement towards our 1st support at 0.66198 in line with 61.8% Fibonacci retracement. Our bias is further supported by RSI being at levels where dips previously occurred. Alternatively, our stop loss will be placed at 2nd resistance at 0.66735 in line with 100% Fibonacci retracement and 61.8% Fibonacci extension.
Areas of consideration:
- H4 time frame, 1st resistance at 0.66451
- H4 time frame, 1st support at 0.66198
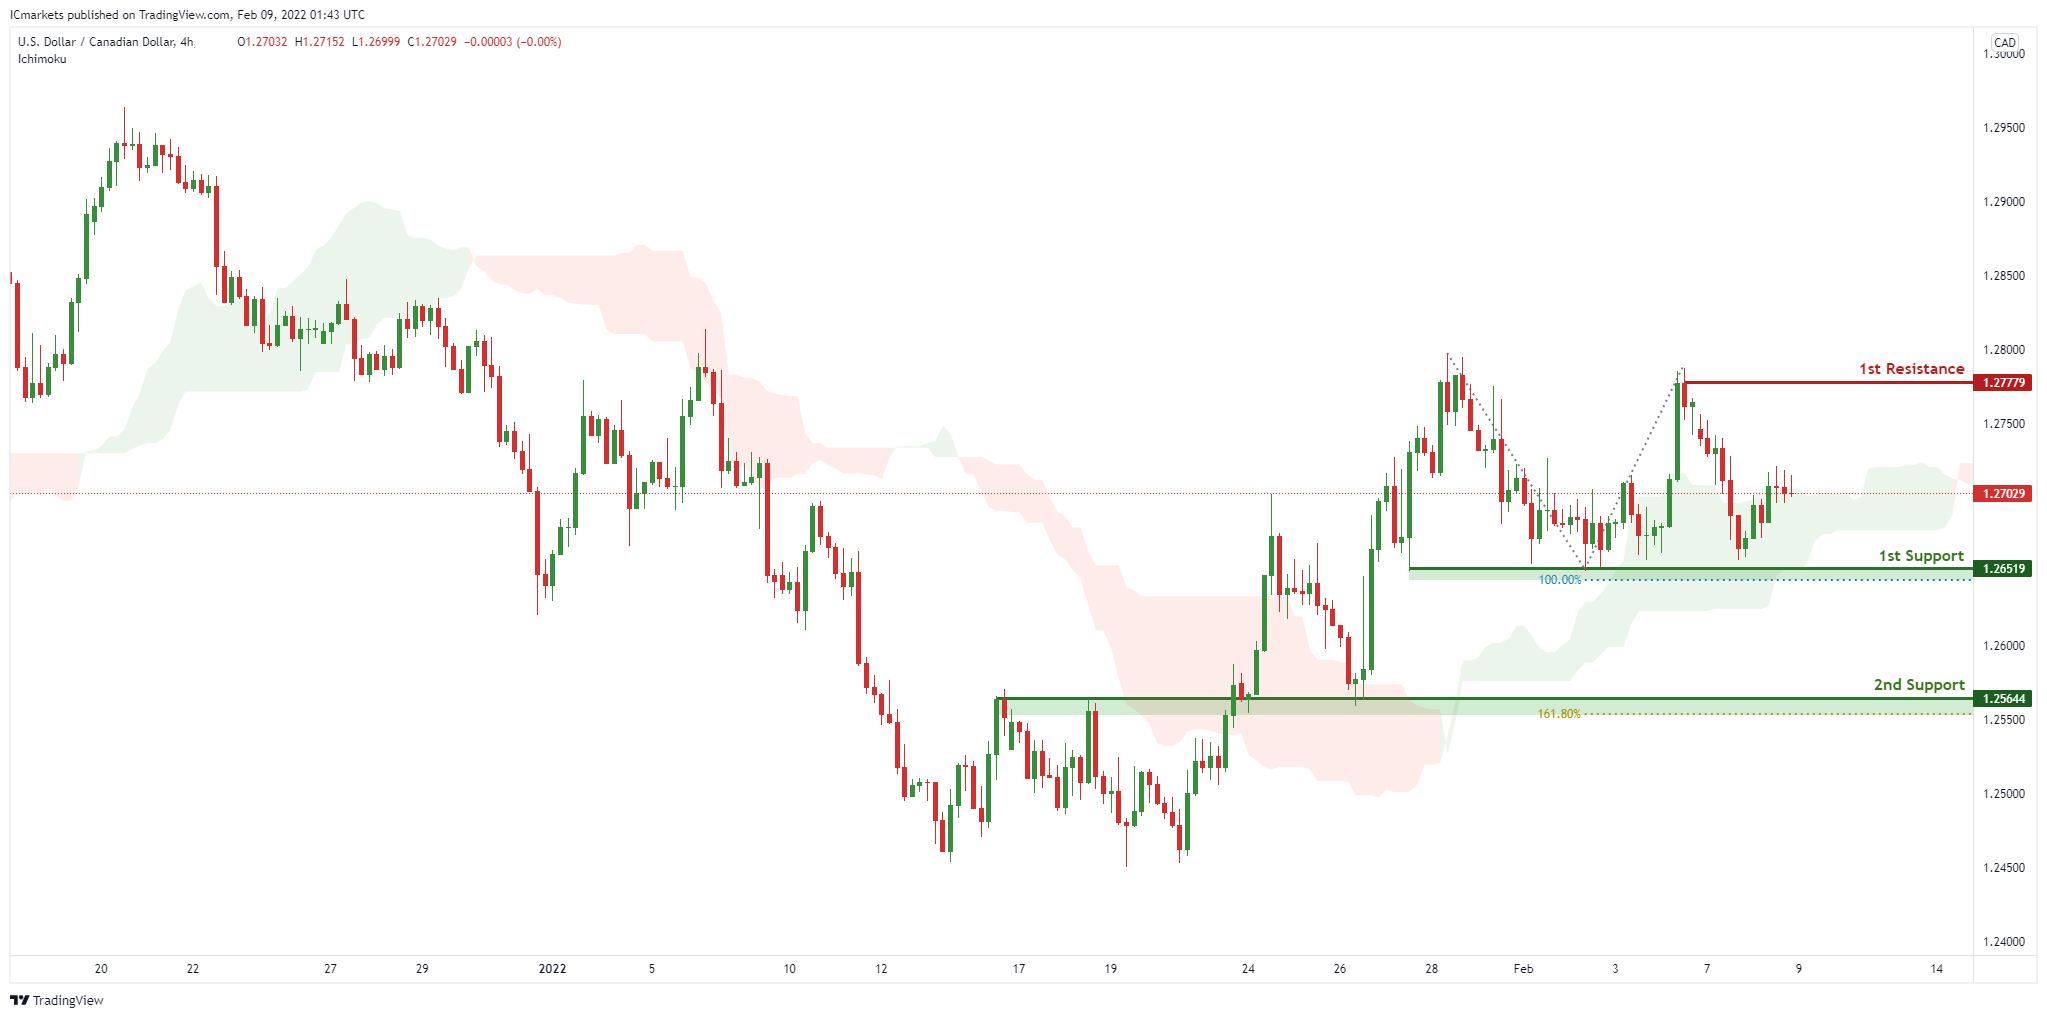
USD/CAD:
On the H4, with prices moving above the ichimoku cloud, we see the potential for a bounce from our 1st support at 1.26519 in line with horizontal swing low support and 100% Fibonacci projection towards our 1st resistance at 1.277779 in line with horizontal swing high resistance. Alternatively, price may break 1st support structure and head for 2nd support at 1.25644, in line with the horizontal overlap support.
Areas of consideration:
- H4 time frame, 1st support at 1.26519
- H4 time frame, 1st resistance at 1.277779
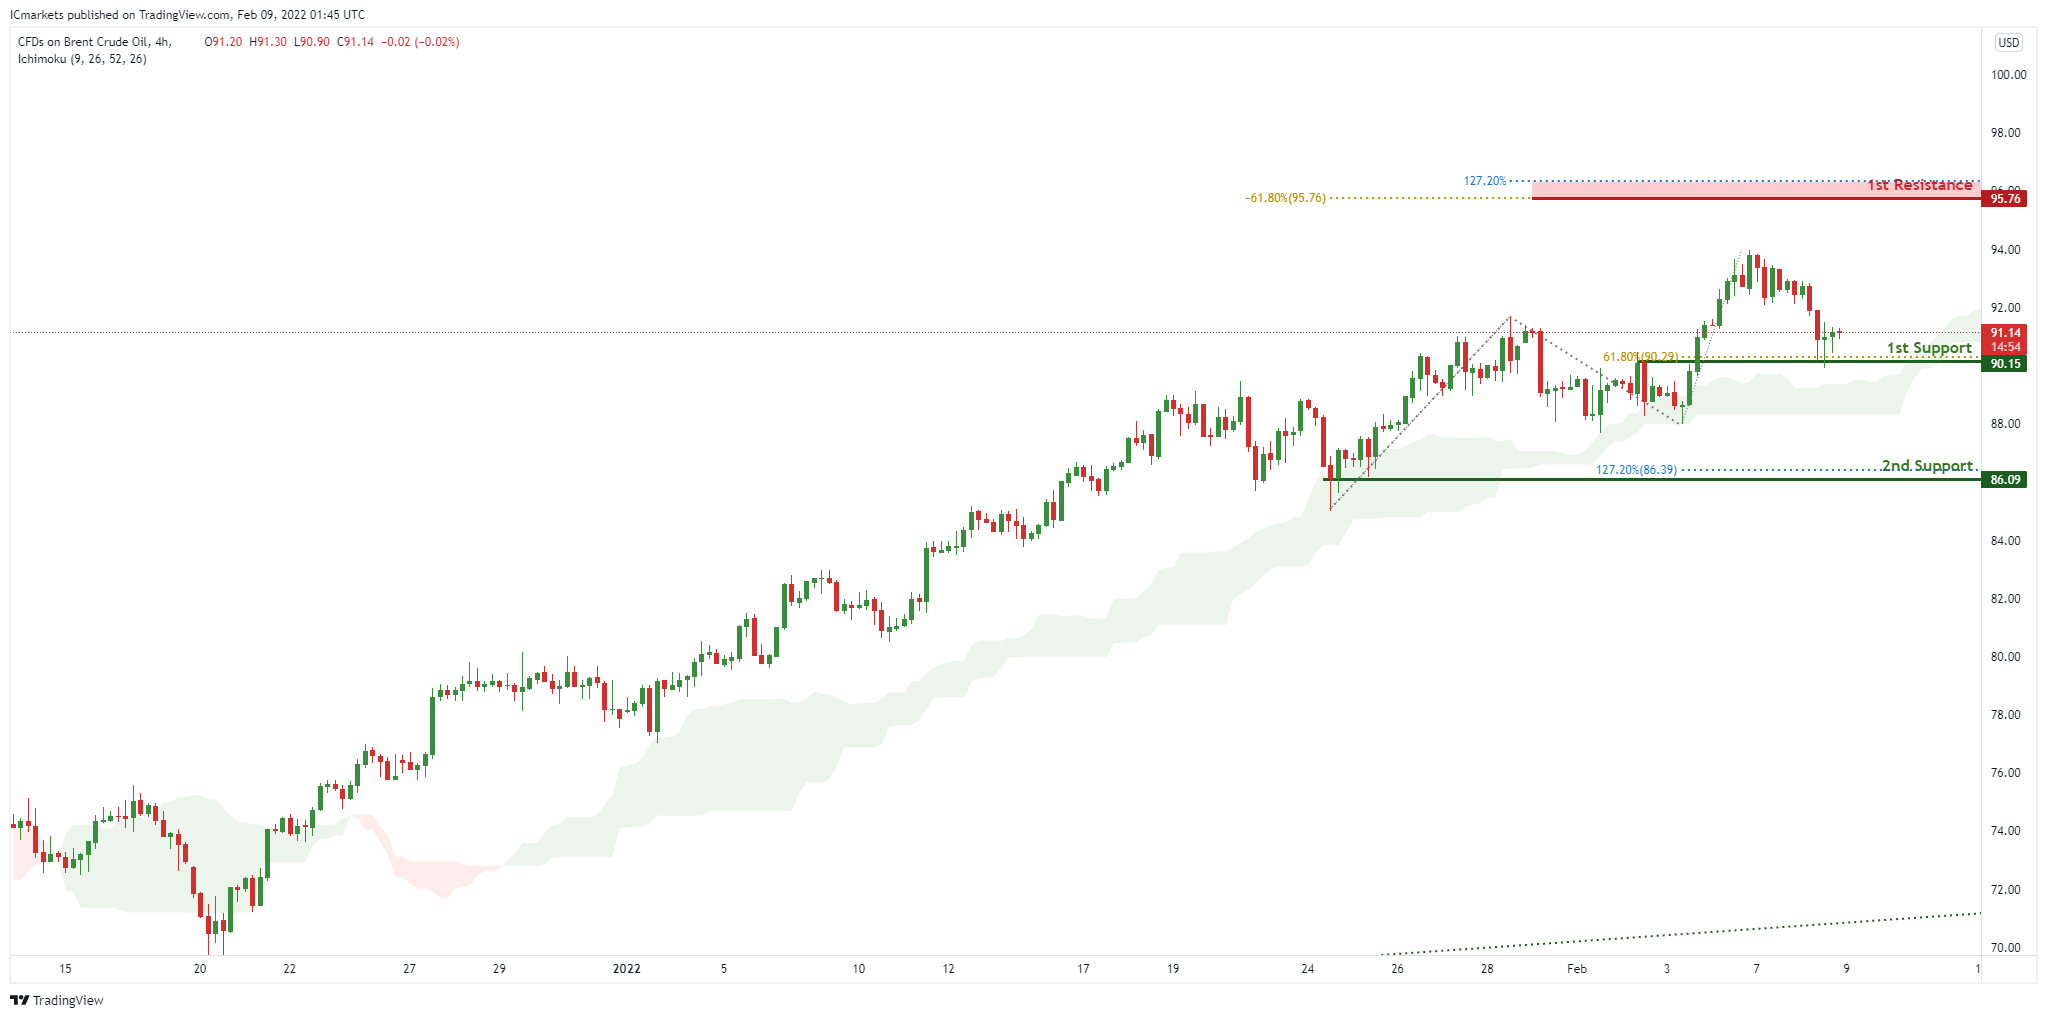
OIL:
On the H4, with prices moving above the ichimoku cloud, we see the potential for a bounce from our 1st support at 90.15 in line with horizontal overlap support towards our 1st resistance at 95.76 in line with the 127.2% Fibonacci extension and -61.8% Fibonacci expansion. Alternatively, price may break 1st support structure and head for 2nd support at 86.09, in line with the horizontal swing low support and 127.2% Fibonacci extension.
Areas of consideration:
- H4 time frame, 1st resistance of 95.76
- H4 time frame, 1st support of 90.15
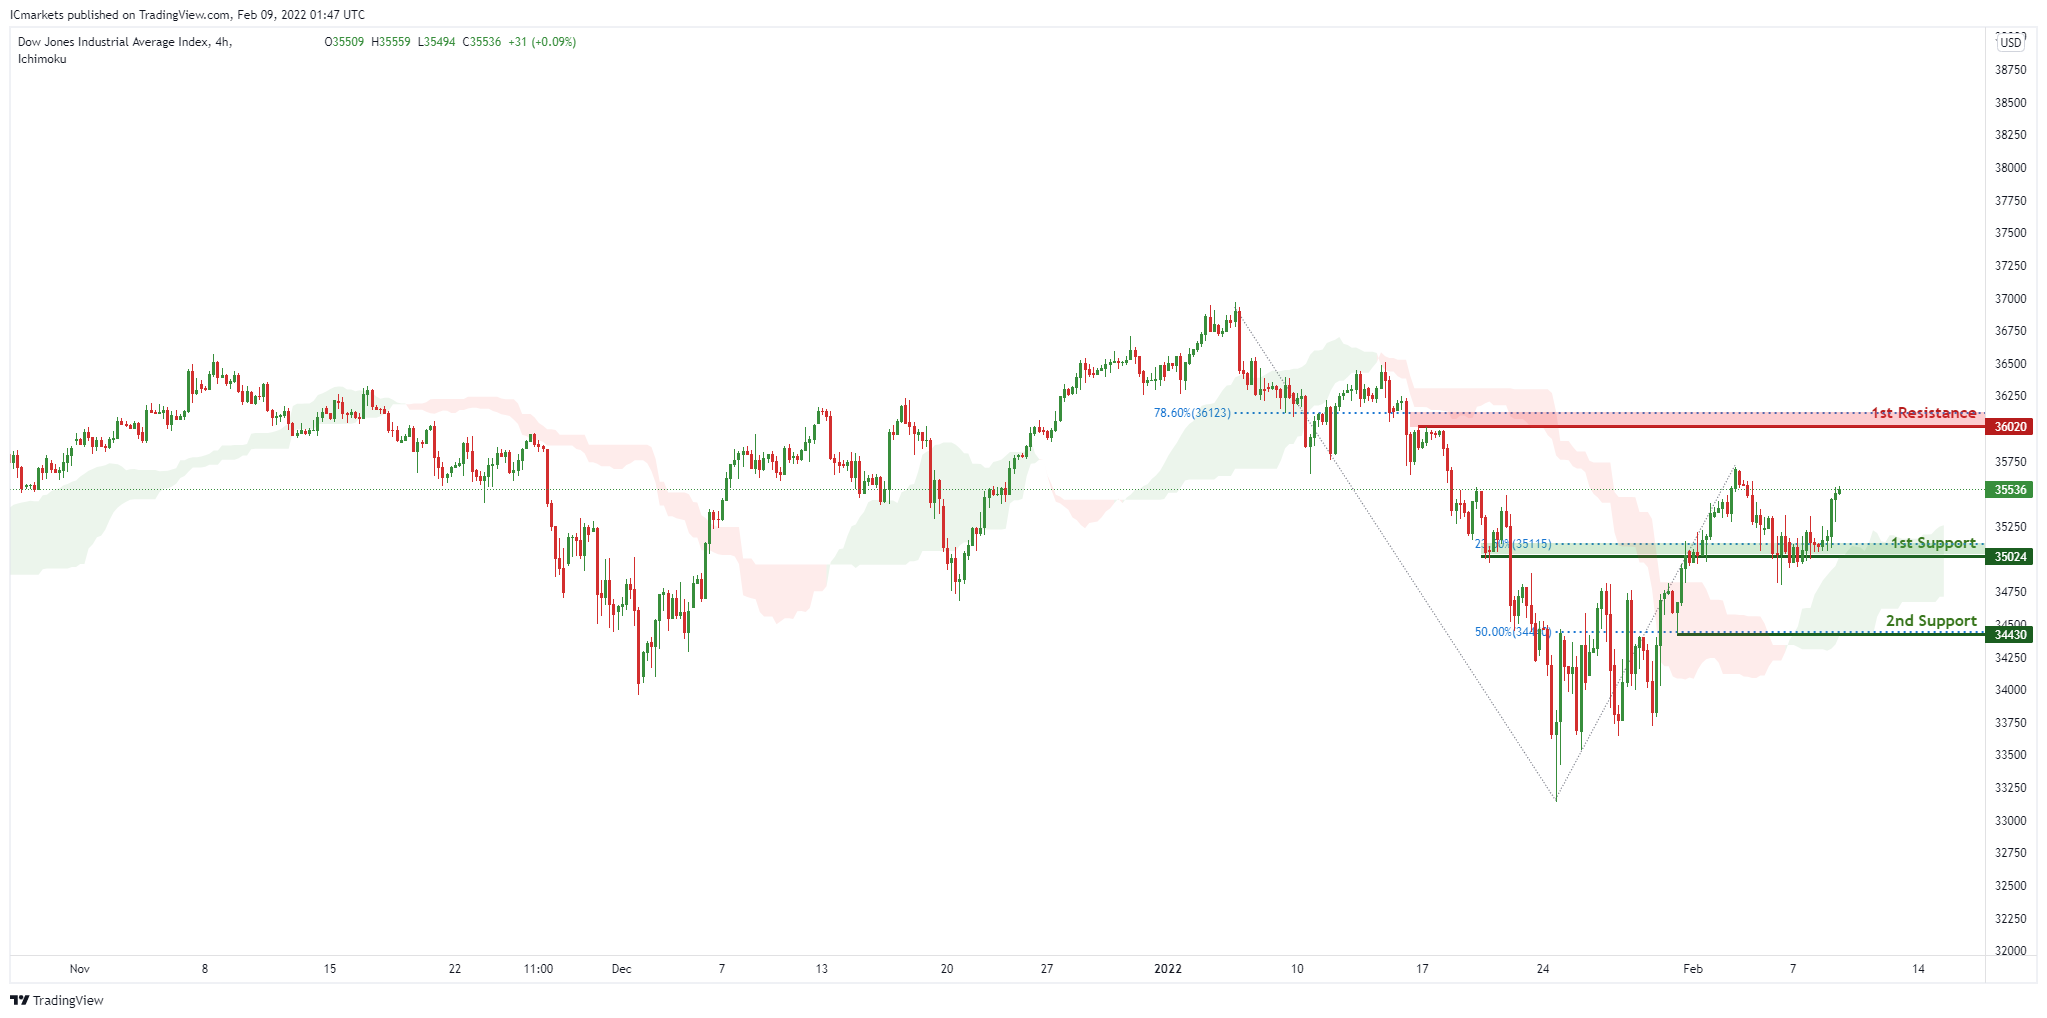
Dow Jones Industrial Average:
On the H4, with price moving above the ichimoku cloud, signifying an overall bullish momentum. We can expect price to rise to our 1st resistance at 36020 in line horizontal graphical swing high resistance and 78.6% Fibonacci retracement from our 1st support in line with horizontal overlap support and 23.6% Fibonacci retracement level at 35024. Alternatively, price may break 1st support structure and head for 2nd support, which coincides with 50% Fibonacci retracement level at 34430.
Areas of consideration:
- H4 time frame, 1st resistance of 36020
- H4 time frame, 1st support of 35024


