
DXY:
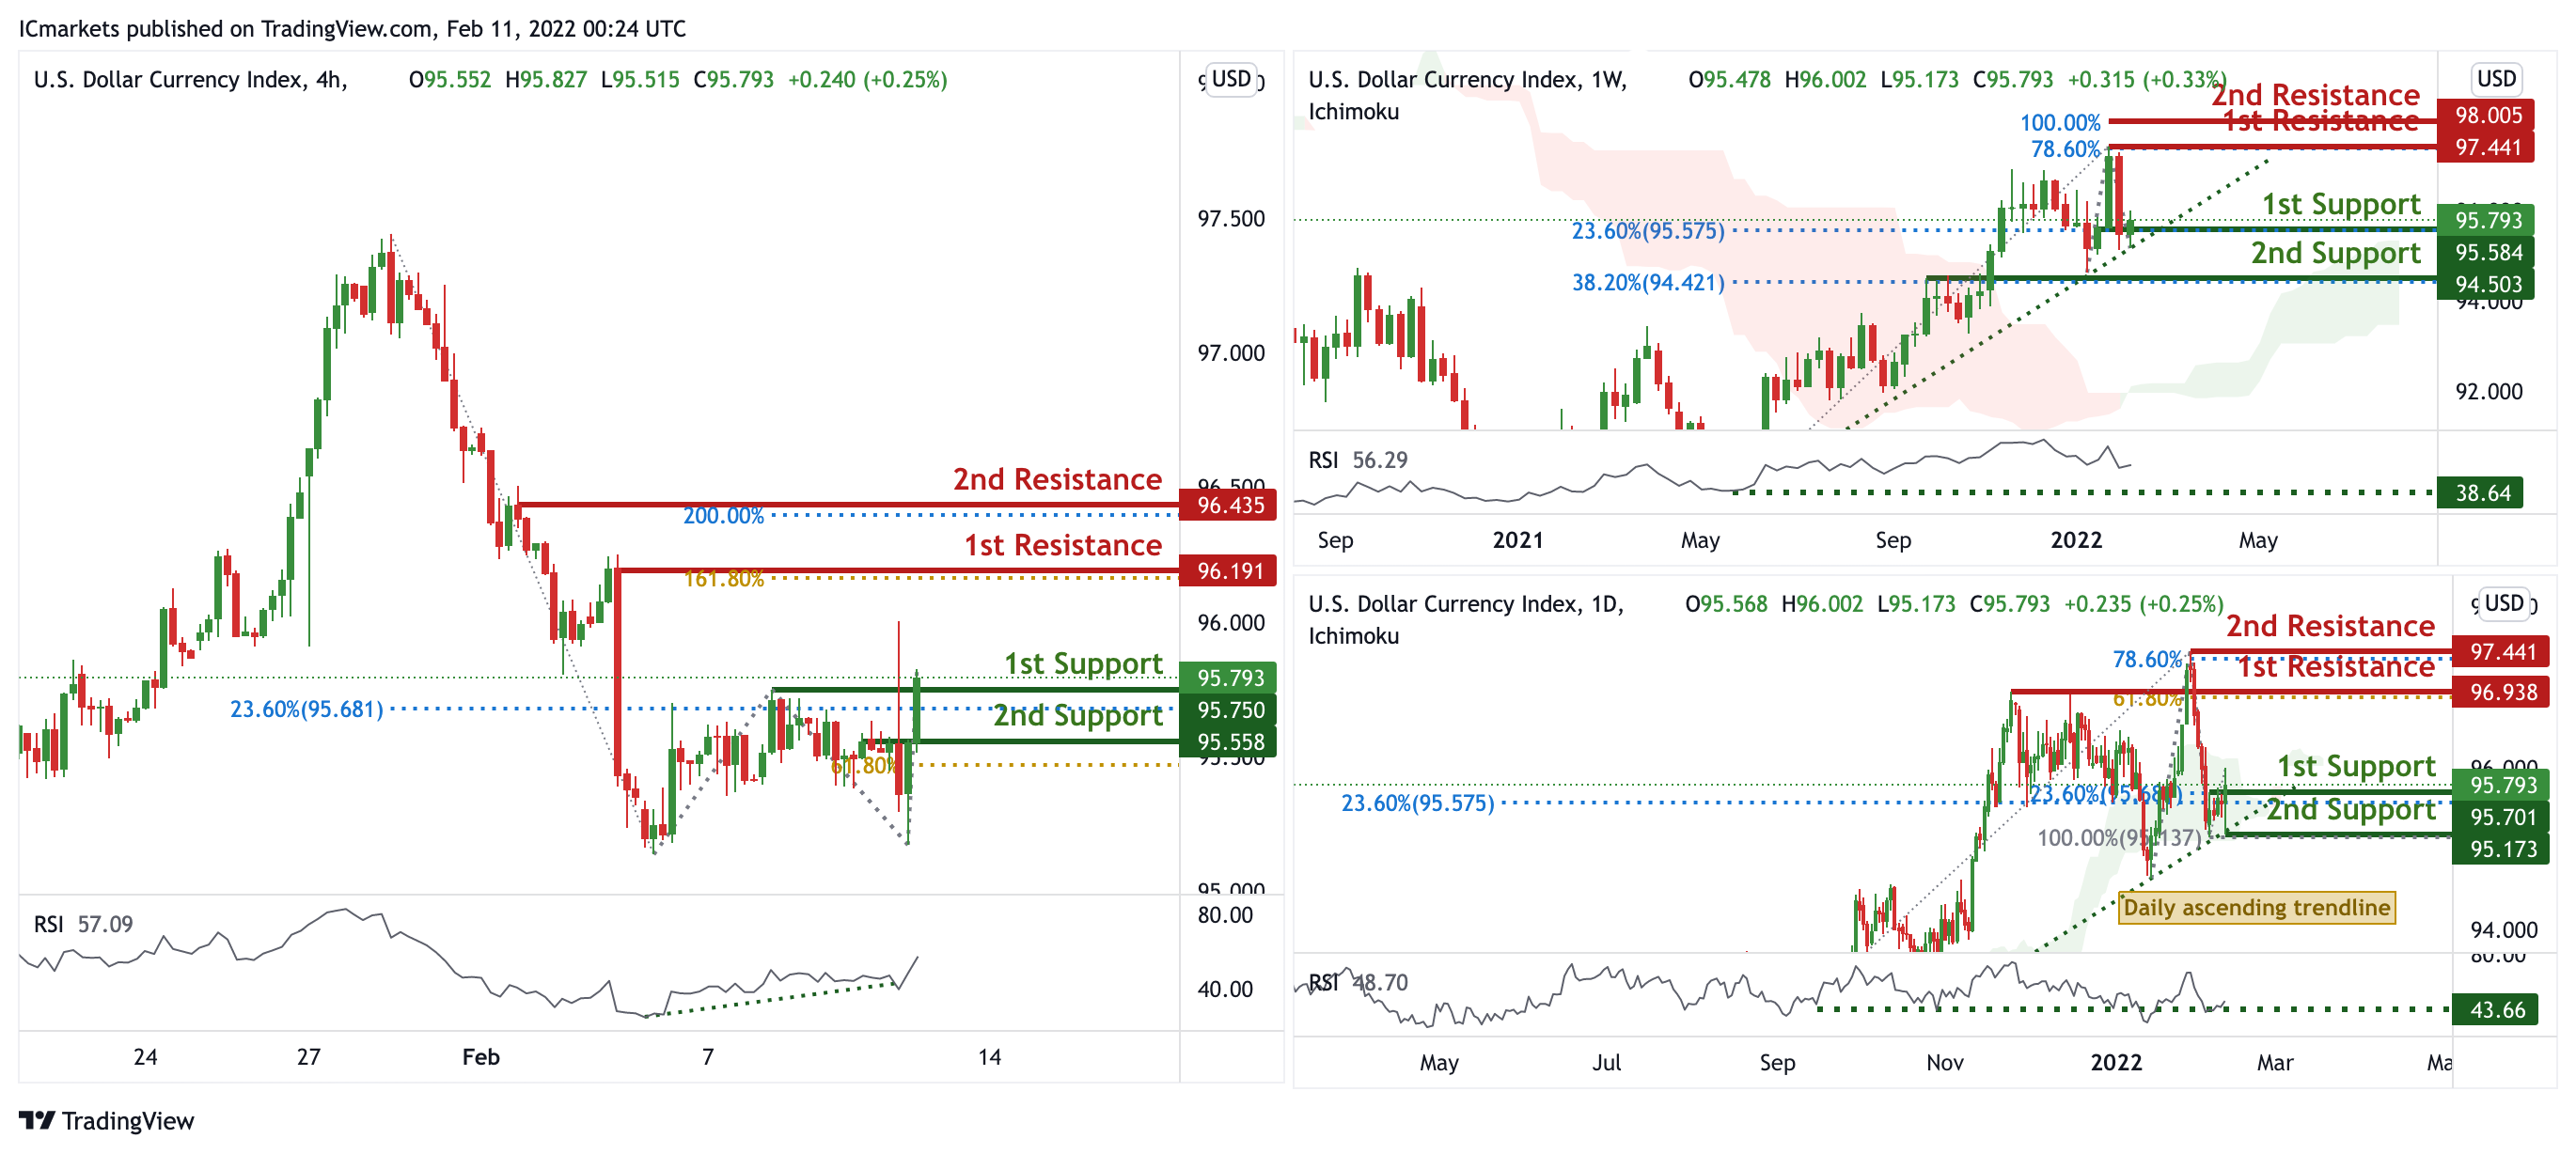
On the weekly, prices are on bullish momentum and abiding to an ascending trendline support. We see the potential for a bounce from our ascending trendline and 1st support at 95.793 in line with 23.6% Fibonacci retracement towards our 1st resistance at 97.441 in line with 78.6% Fibonacci extension. Prices are trading above our Ichimoku Cloud support and RSI are close to levels where bounces previously occurred, further supporting our bias. On the daily, prices have recently bounced off our ascending trendline support and abiding to our daily ascending trendline. We see the potential for further bullish continuation from our 1st support at 95.701 in line with 23.6% Fibonacci retracement towards our 1st resistance at 96.938 in line with 61.8% Fibonacci extension. RSI are at levels where bounces previously occurred and also prices trading above our ichimoku cloud support, backing our bullish bias. On the H4 timeframe, prices are on bullish momentum and have formed a potential double bottom. We see the potential for further bullish continuation from our 1st support at 95.793 in line with 50% Fibonacci retracement and graphical overlap towards our 1st resistance at 96.191 in line with 161.8% Fibonacci Projection. Our bullish bias is further supported by our RSI portraying bullish momentum.
Areas of consideration:
- H4 time frame, 1st resistance at 96.191
- H4 time frame, 1st support at 95.793
XAU/USD (GOLD):
On the weekly, prices have approached a strong graphical overlap and resistance, and are also consolidating in a triangle. We see the potential for a dip from 1st resistance at 1834.195 in line with 61.8% Fibonacci extension and 78.6% Fibonacci retracement towards our 1st support at 1792.359 in line with 61.8% Fibonacci retracement. RSI are at levels where dips previously occurred and also prices are trading below our ichimoku cloud support, further supporting our bearish bias. On the daily, prices were on bullish momentum and currently at a strong graphical overlap and resistance. We see the potential for a dip from our 1st resistance at 1828.775 in line with 61.8% Fibonacci retracement towards our 1st support at 1805.840 in line with 61.8% Fibonacci retracement. RSI is at levels where dips previously occurred, backing our bearish bias.
On the H4 chart, prices are at a pivot and strong graphical overlap resistance. We see potential for a pullback from our 1st resistance at 1836.379 in line with 78.6% Fibonacci retracement and 78.6% Fibonacci extension towards our 1st support at 1824.397 in line with 23.6% Fibonacci retracement and 38.2% Fibonacci retracement. RSI are at levels where dips previously occurred.
Areas of consideration:
- 4h 1st support at 1826.785
- 4h 1st resistance at 1837.740

GBP/USD
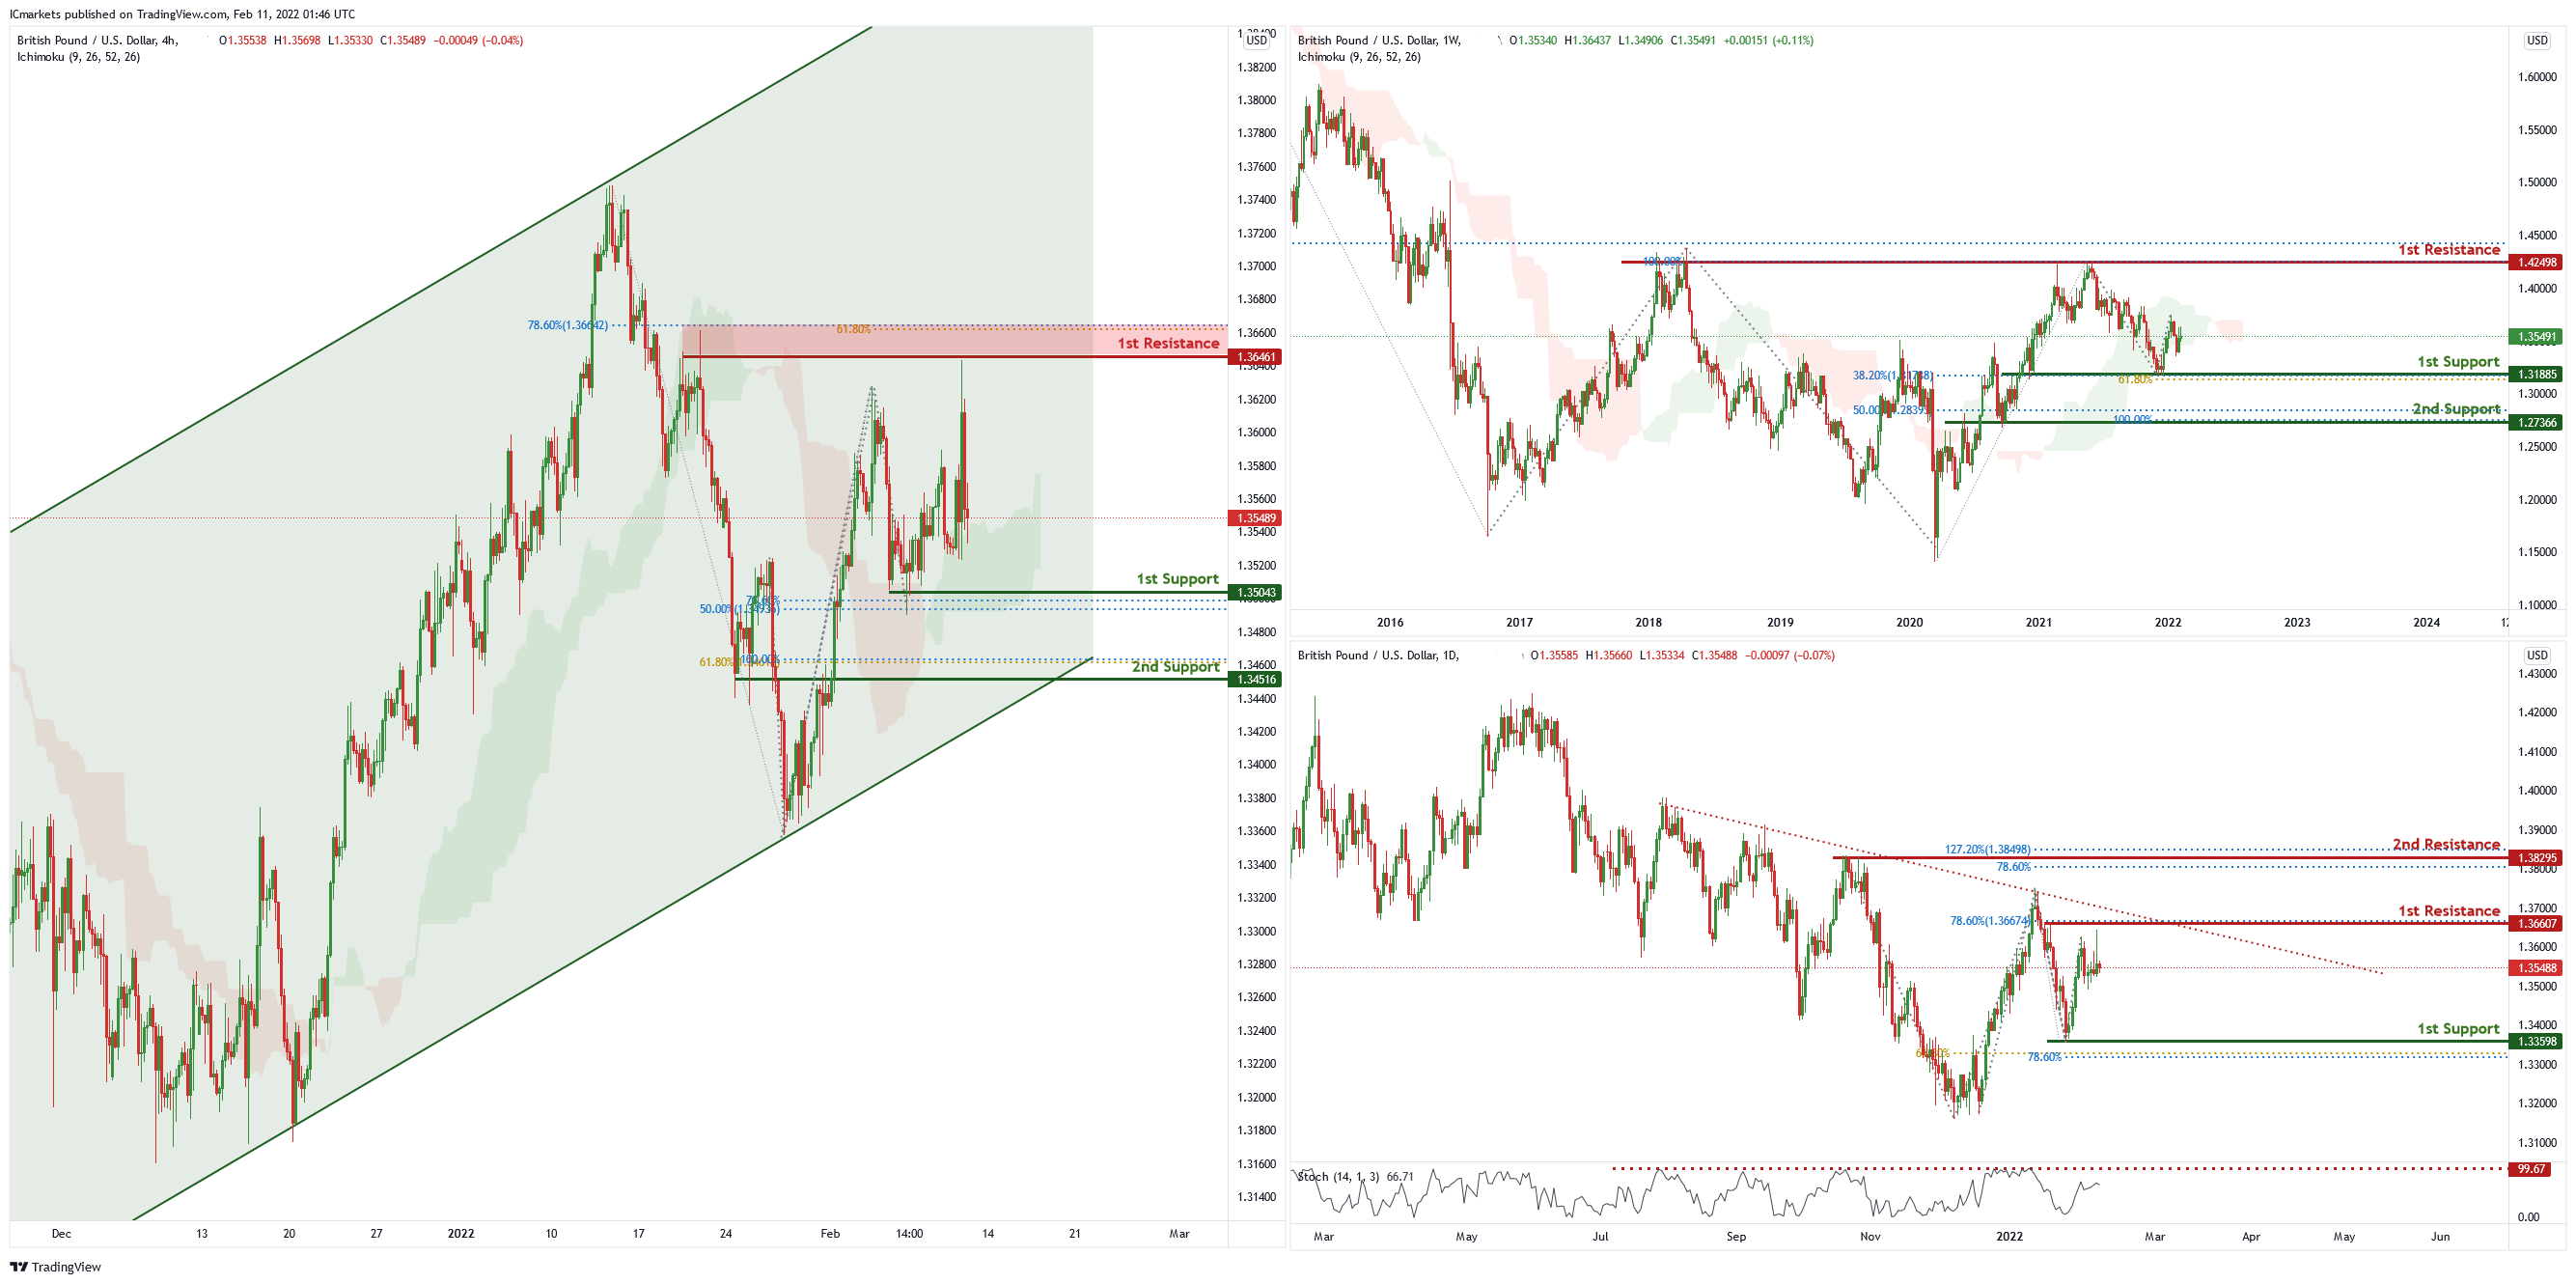
On the weekly chart , price has recently bounced off the 1st support level of 1.31885 which is also 38.2% Fibonacci retracement and 61.8% Fibonacci projection. Price can potentially go to the 1st resistance level of 1.42498 which is also 100% Fibonacci projection and 50% Fibonacci retracement. Our bullish bias is supported by the ichimoku cloud indicator.
On the daily chart , price is abiding by a descending trendline and near the 1st resistance level of 1.36607 which is 78.6% Fibonacci retracement. Price can potentially dip to the 1st support level of 1.33598 which is also 61.8% Fibonacci projection and 78.6% Fibonacci retracement. Our bearish bias is supported by the stochastic indicator as it is near resistance level.
In the H4 chart , price is trading in an ascending channel and near 1st support level of 1.35043 which is also 50% Fibonacci retracement and 78.6% Fibonacci projection. Price can potentially continue its bullish momentum to the 1st resistance level of 1.36461 in line with 61.8% Fibonacci projection and 78.6% Fibonacci retracement. Our bullish bias is supported by the ichimoku cloud indicator as price is trading above it.
Areas of consideration:
- H4 1st resistance 1.36461
- H4 1st support 1.35043
USD/CHF:
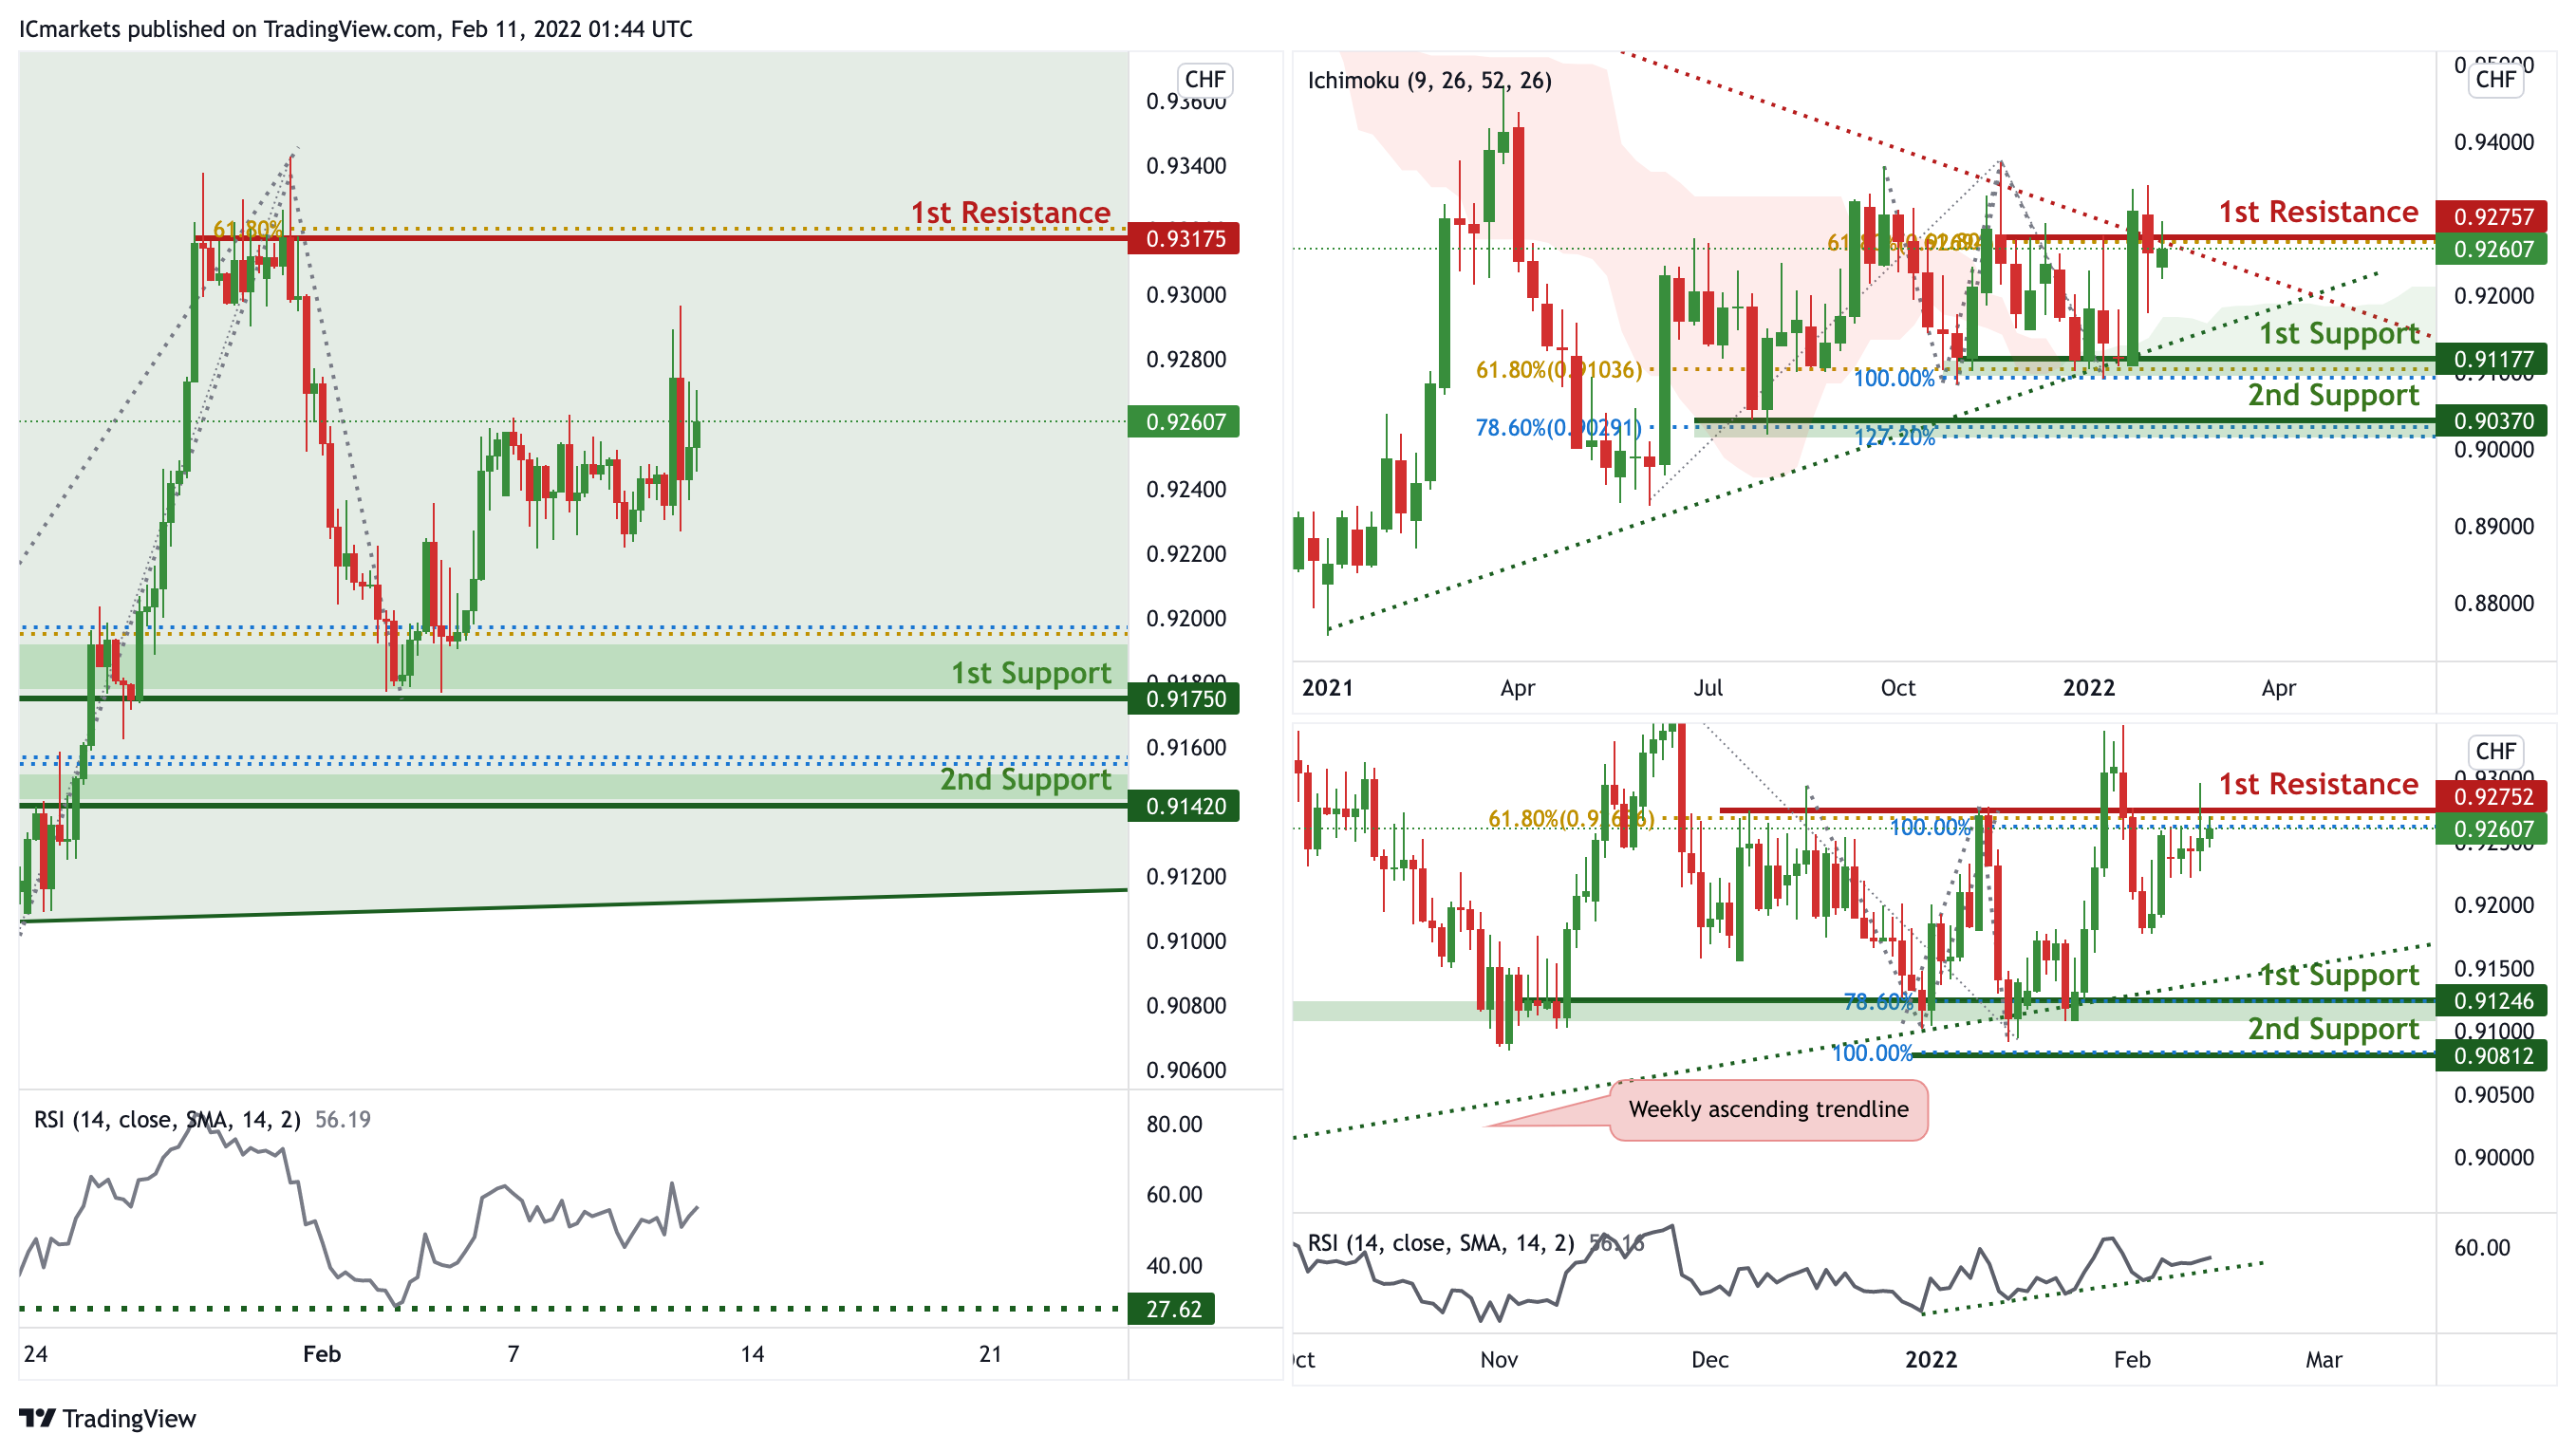
On the weekly, prices are on bearish momentum and abiding to our descending trendline. We see the potential for a dip from our 1st resistance at 0.93206 in line with 78.6% Fibonacci extension towards our 1st support at 0.91845 in line with 61.8% Fibonacci retracement. RSI is showing bearish momentum.
On the daily chart, prices are hovering in between 2 levels. We see the potential for a dip if prices approach our 1st resistance at 0.93720 in line with 100% Fibonacci extension towards our 1st support at 0.92713 which is a graphical overlap. RSI are at levels where dips previously occurred. Traders should wait for prices to swing higher or lower before entering.
On the H4 timeframe,in reference to last week’s analysis price indeed bounced at the 1st Support level. Price is abiding to the daily ascending channel signifying an overall bullish momentum. We can expect the price to bounce from 1st Support in line with 78.6% Fibonacci projection and 61.8% fibonacci retracement towards 1st Resistance in line with 61.8% Fibonacci projection and previous swing high. Our bullish bias is further supported by the RSI indicator where it is at the support level. Traders should wait for prices to swing higher or lower before entering.
Areas of consideration:
- Watch 1st Support at 0.91750
- Watch 1st Resistance at 0.93175
EUR/USD :
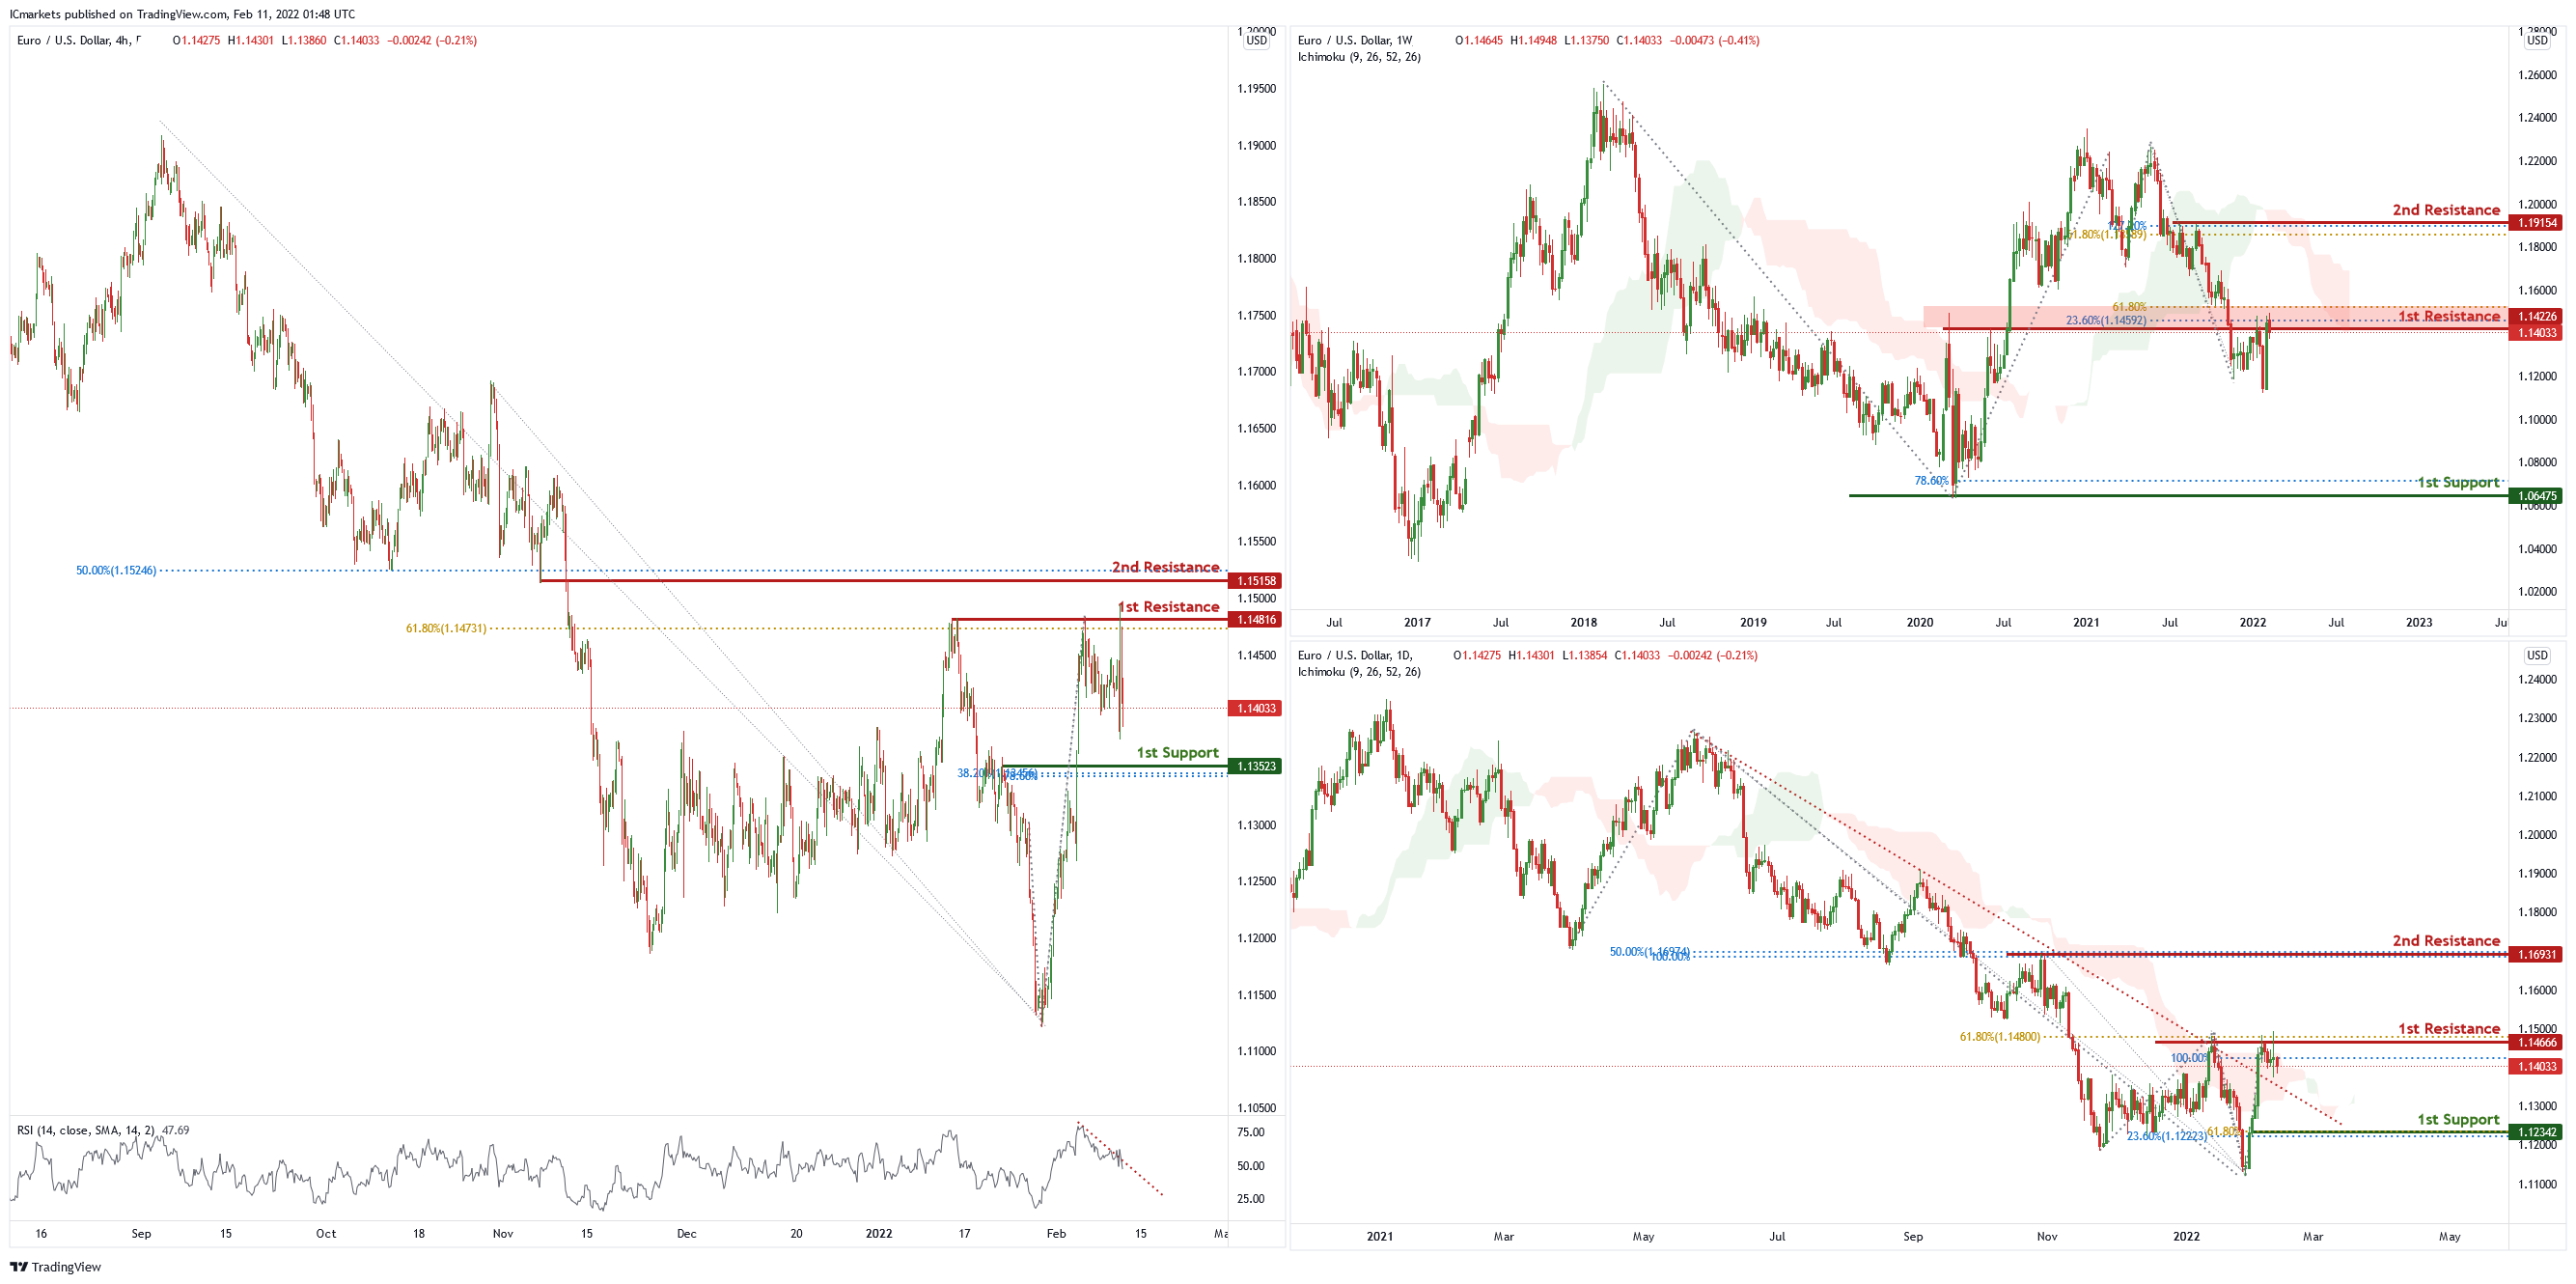
On the weekly chart, price is near 1st resistance level of 1.14226 which is also 61.8% Fibonacci projection and 23.6% Fibonacci retracement. Price can potentially dip to the 1st support level of 1.06475 which is 78.6% Fibonacci projection. Our bearish bias is supported by the ichimoku cloud indicator as price is trading below it.
On the daily chart, price has broken out of the descending trendline and is near 1st resistance level of 1.14666 which is also 100% Fibonacci projection and 61.8% Fibonacci retracement. Price can potentially go to the 2nd resistance level of 1.16931 which is 50% retracement and 100% projection. Our bullish bias is supported by the ichimoku cloud indicator as price is trading above the cloud.
On the H4 chart, price is near the 1st resistance level of 1.14816 which is also 61.8% Fibonacci retracement. Price can potentially dip to the 1st support level of 1.13523 in line with 38.2% Fibonacci retracement and 78.6% Fibonacci projection. Our bearish bias is supported by the RSI indicator as it is abiding by a descending trendline
Areas of consideration :
- H4 1st support at 1.13523
- H4 1st resistance at 1.14816
USD/JPY
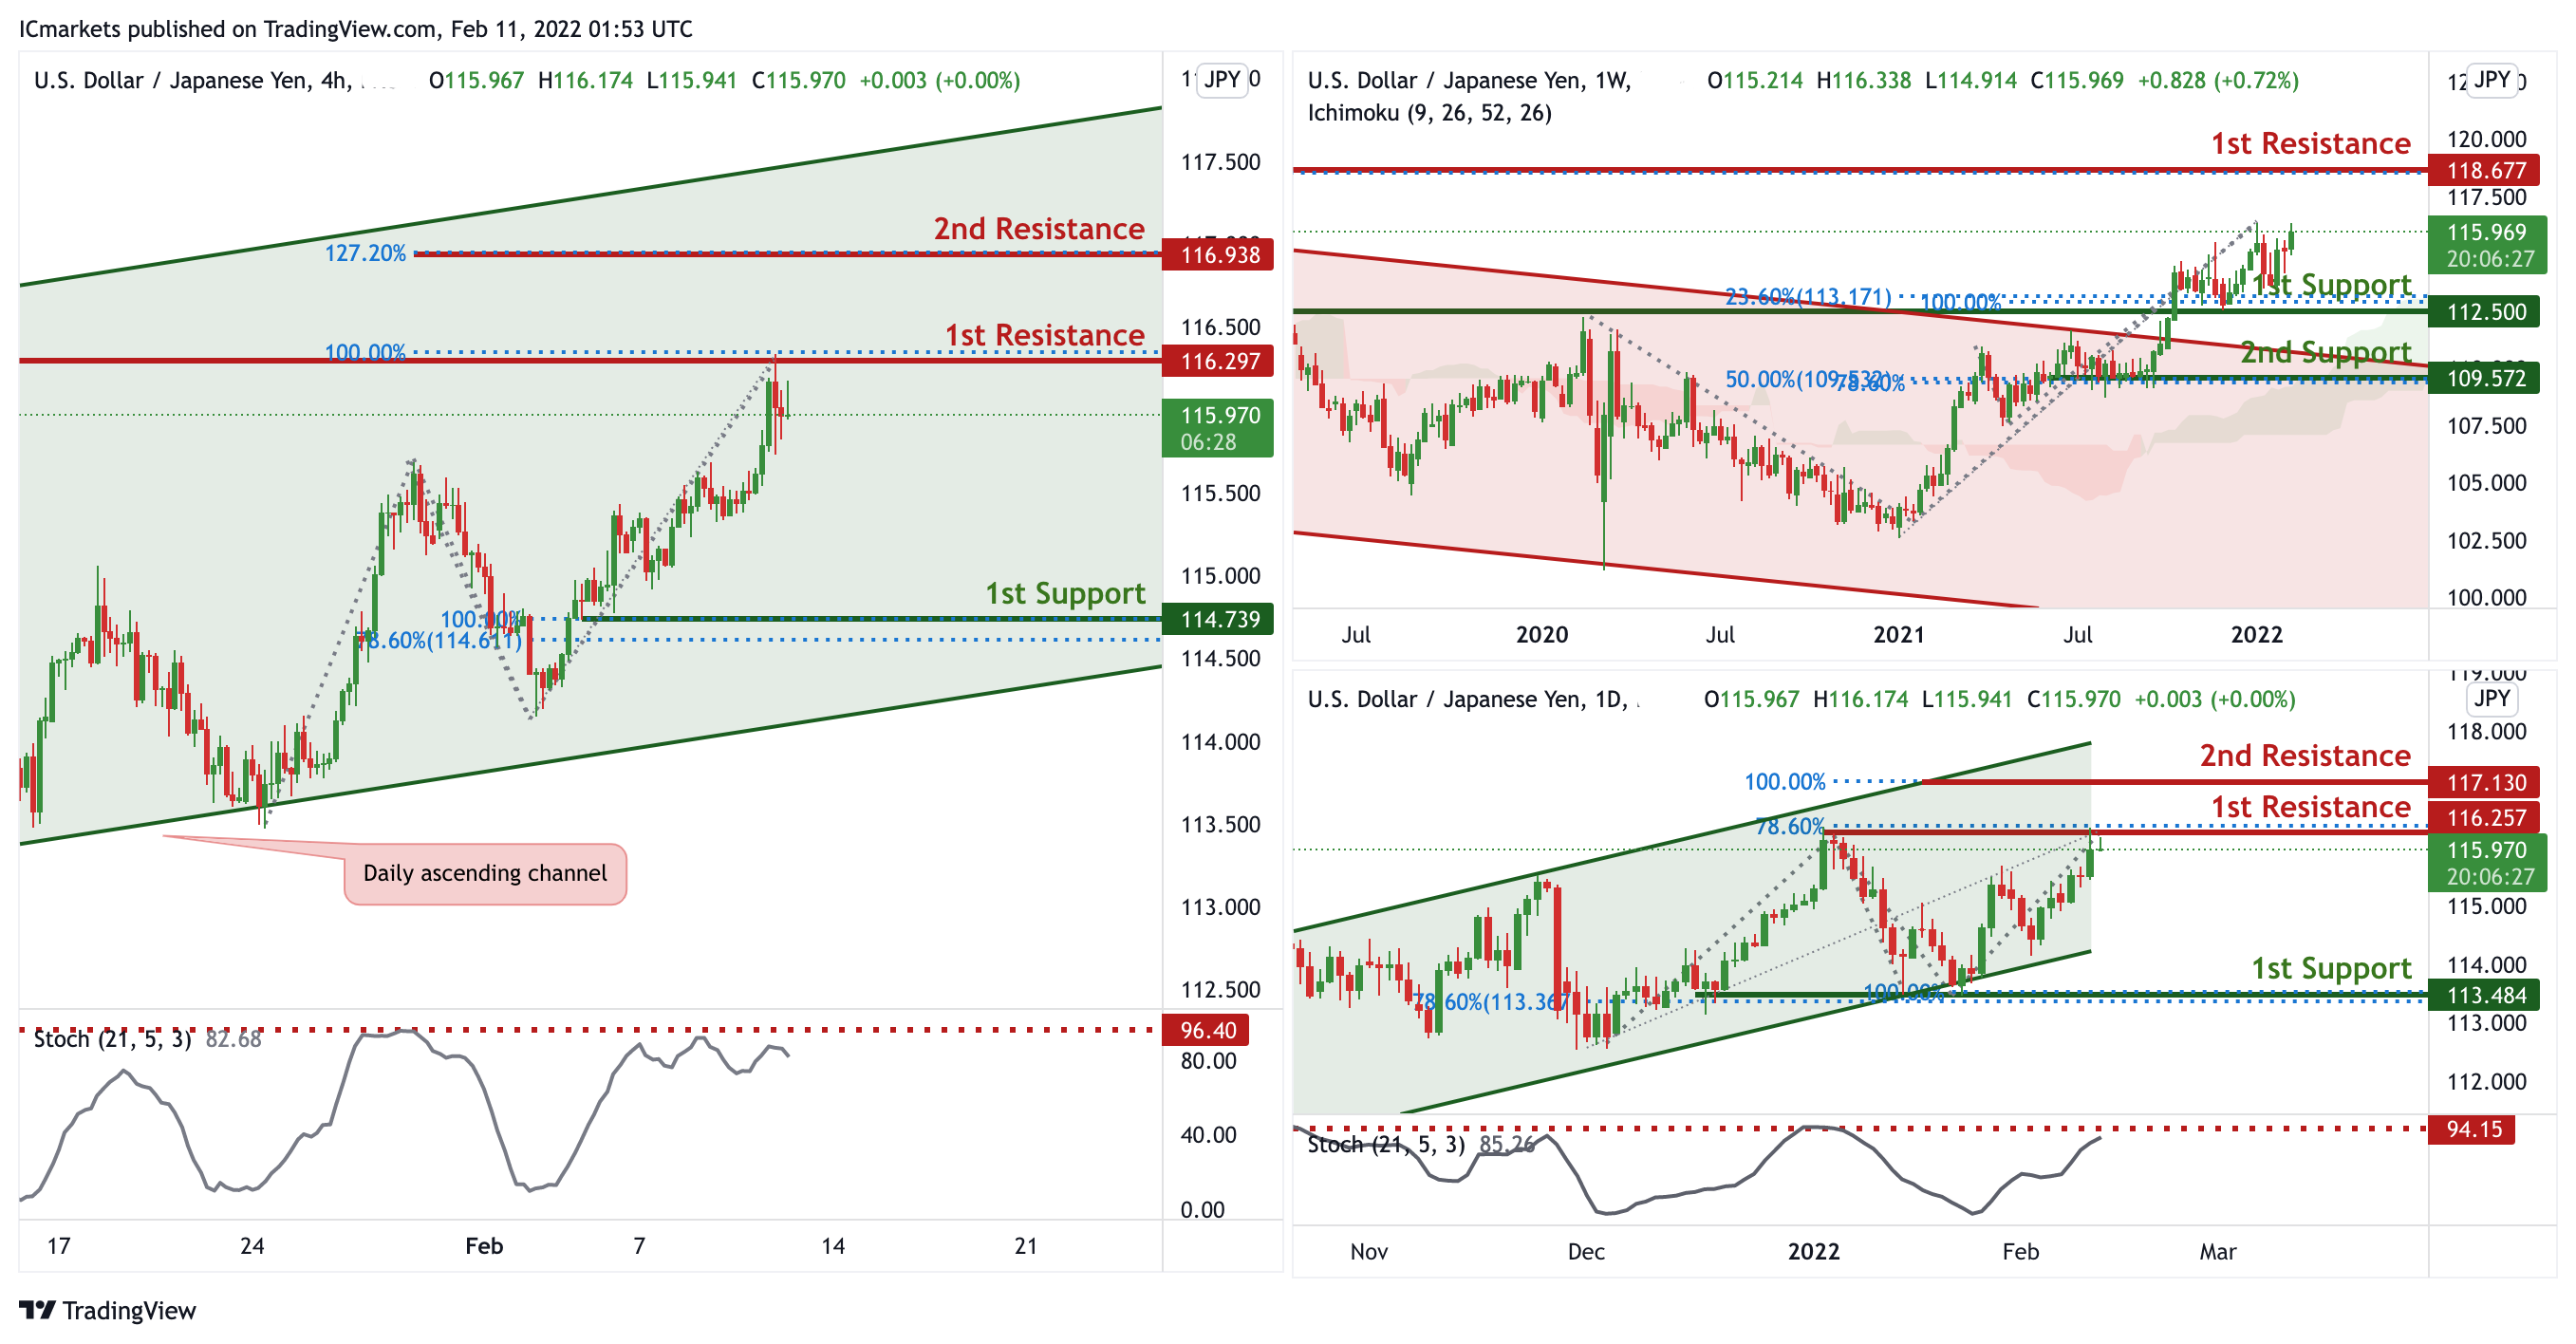
On the weekly chart, price has broken out of the descending channel and near support level of 112.500 which is also 23.6% Fibonacci retracement and 100% Fibonacci projection. Price can potentially go to the 1st resistance level of 118.677 which is also 78.6% Fibonacci retracement. Our bullish bias is supported by the ichimoku cloud indicator as price is trading above it.
In reference to last week’s analysis, price indeed touched the 1st Resistance at 116.25. On the daily chart price is trading in an ascending channel, signifying an overall bullish momentum. However, price is at a horizontal resistance, we can expect price to make a short-term bearish drop from 1st Resistance in line with 78.6% Fibonacci projection and previous swing high. Price could potentially drop to 1st Support in line with 100% Fibonacci projection and 78.6% Fibonacci retracement. Our short-term bearish bias is further supported by the stochastic indicator where the %K line is approaching the resistance level.
On the H4 chart,in reference to last week’s analysis, price indeed bounced at 1st Support and it is reaching our potential 1st Resistance level @ 115.598.
Price is trading in an ascending channel signifying an overall bullish momentum, however, we can expect a short-term bearish drop from 1st Resistance level in line with horizontal resistance and 100% Fibonacci projection towards 1st Support in line with 100% Fibonacci projection and 78.6% Fibonacci retracement. Our bearish bias is further supported by the stochastic indicator where the %K line is at the resistance level.
Areas of consideration:
- H4 1st support at 113.484
- H4 1st resistance at 116.257
AUD/USD:
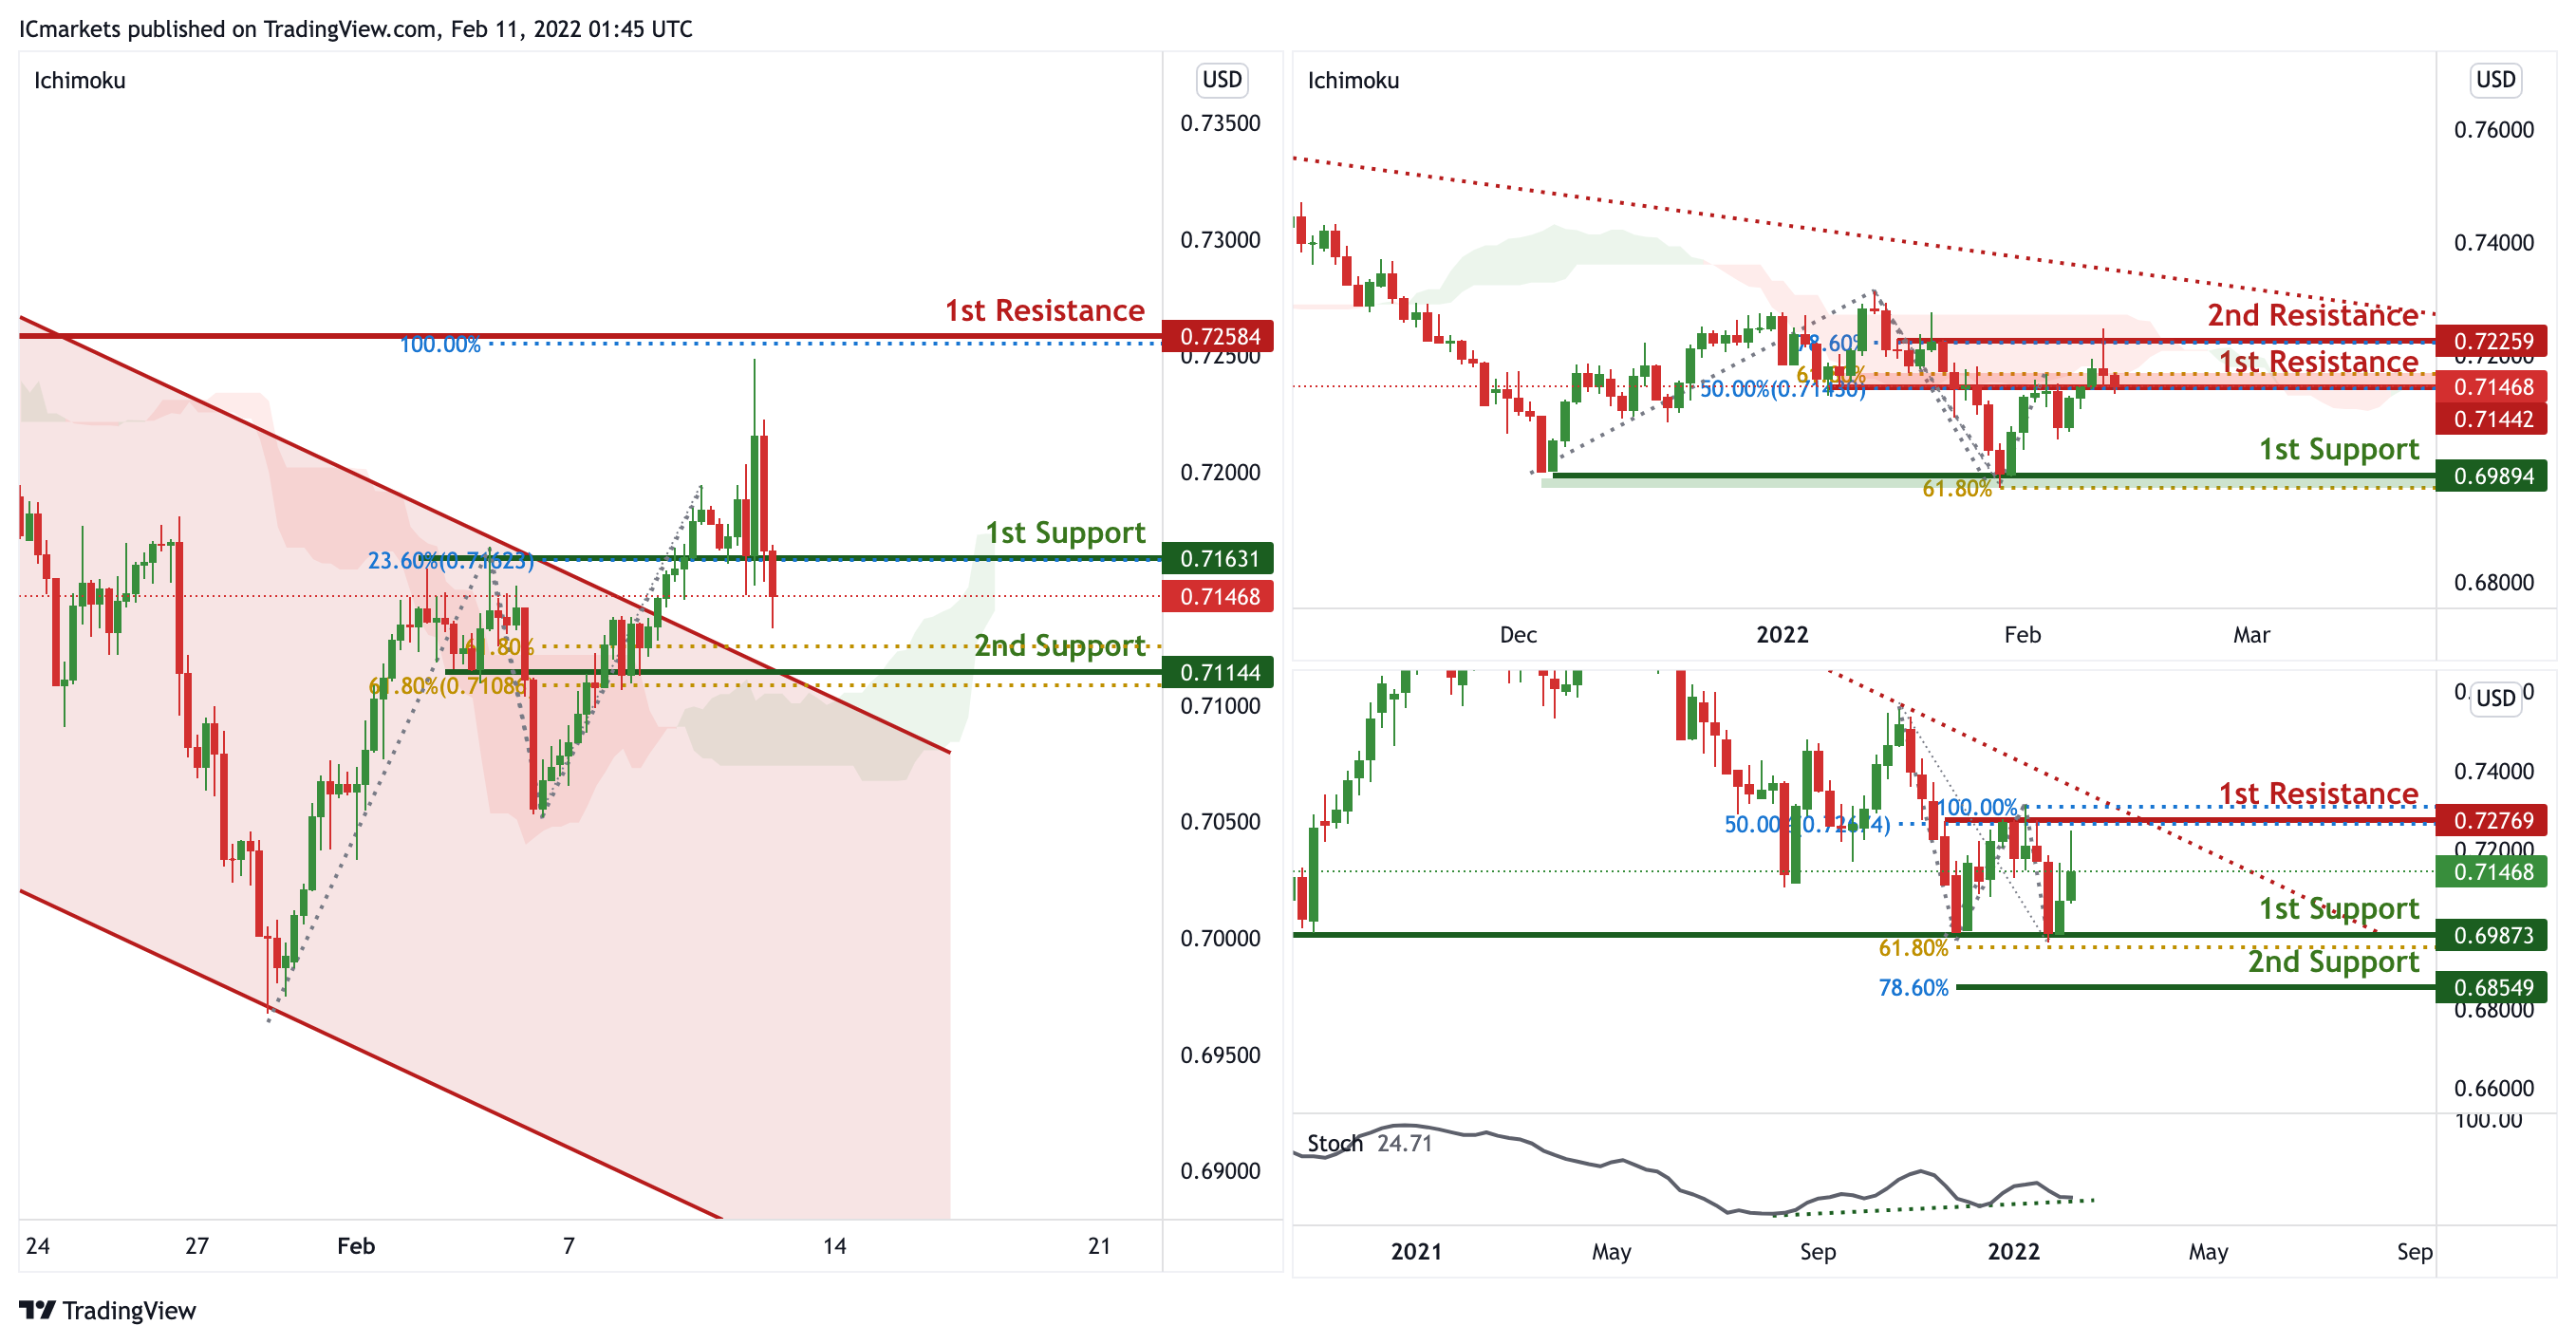
On the weekly, price is abiding to the descending trendline resistance , signifying an overall bearish momentum. However, the price bounced up at the horizontal support. We can expect price to reach 1st Resistance in line with 50% Fibonacci retracement and 100% Fibonacci projection. Traders can wait for price to swing higher or lower before entering.
On the Daily timeframe, price is abiding to the descending trendline , signifying an overall bearish momentum. We can expect the price to drop from 1st Resistance in line with 50% Fibonacci retracement and 61.8% Fibonacci projection towards 1st Support in line with horizontal support and 61.8% Fibonacci projection.
Price broke out of the descending channel, signifying an overall bullish momentum. We can expect price to bounce from 1st Support in line with 23.6% Fibonacci retracement and graphical overlap support towards 1st Resistance in line with previous swing high and 100% Fibonacci projection. Our bullish bias is further supported by the Ichimoku indicator where the prices are holding above the cloud.
Areas of consideration:
- H4 1st Support level 0.71631
- H4 1st resistance level 0.72584
NZD/USD:
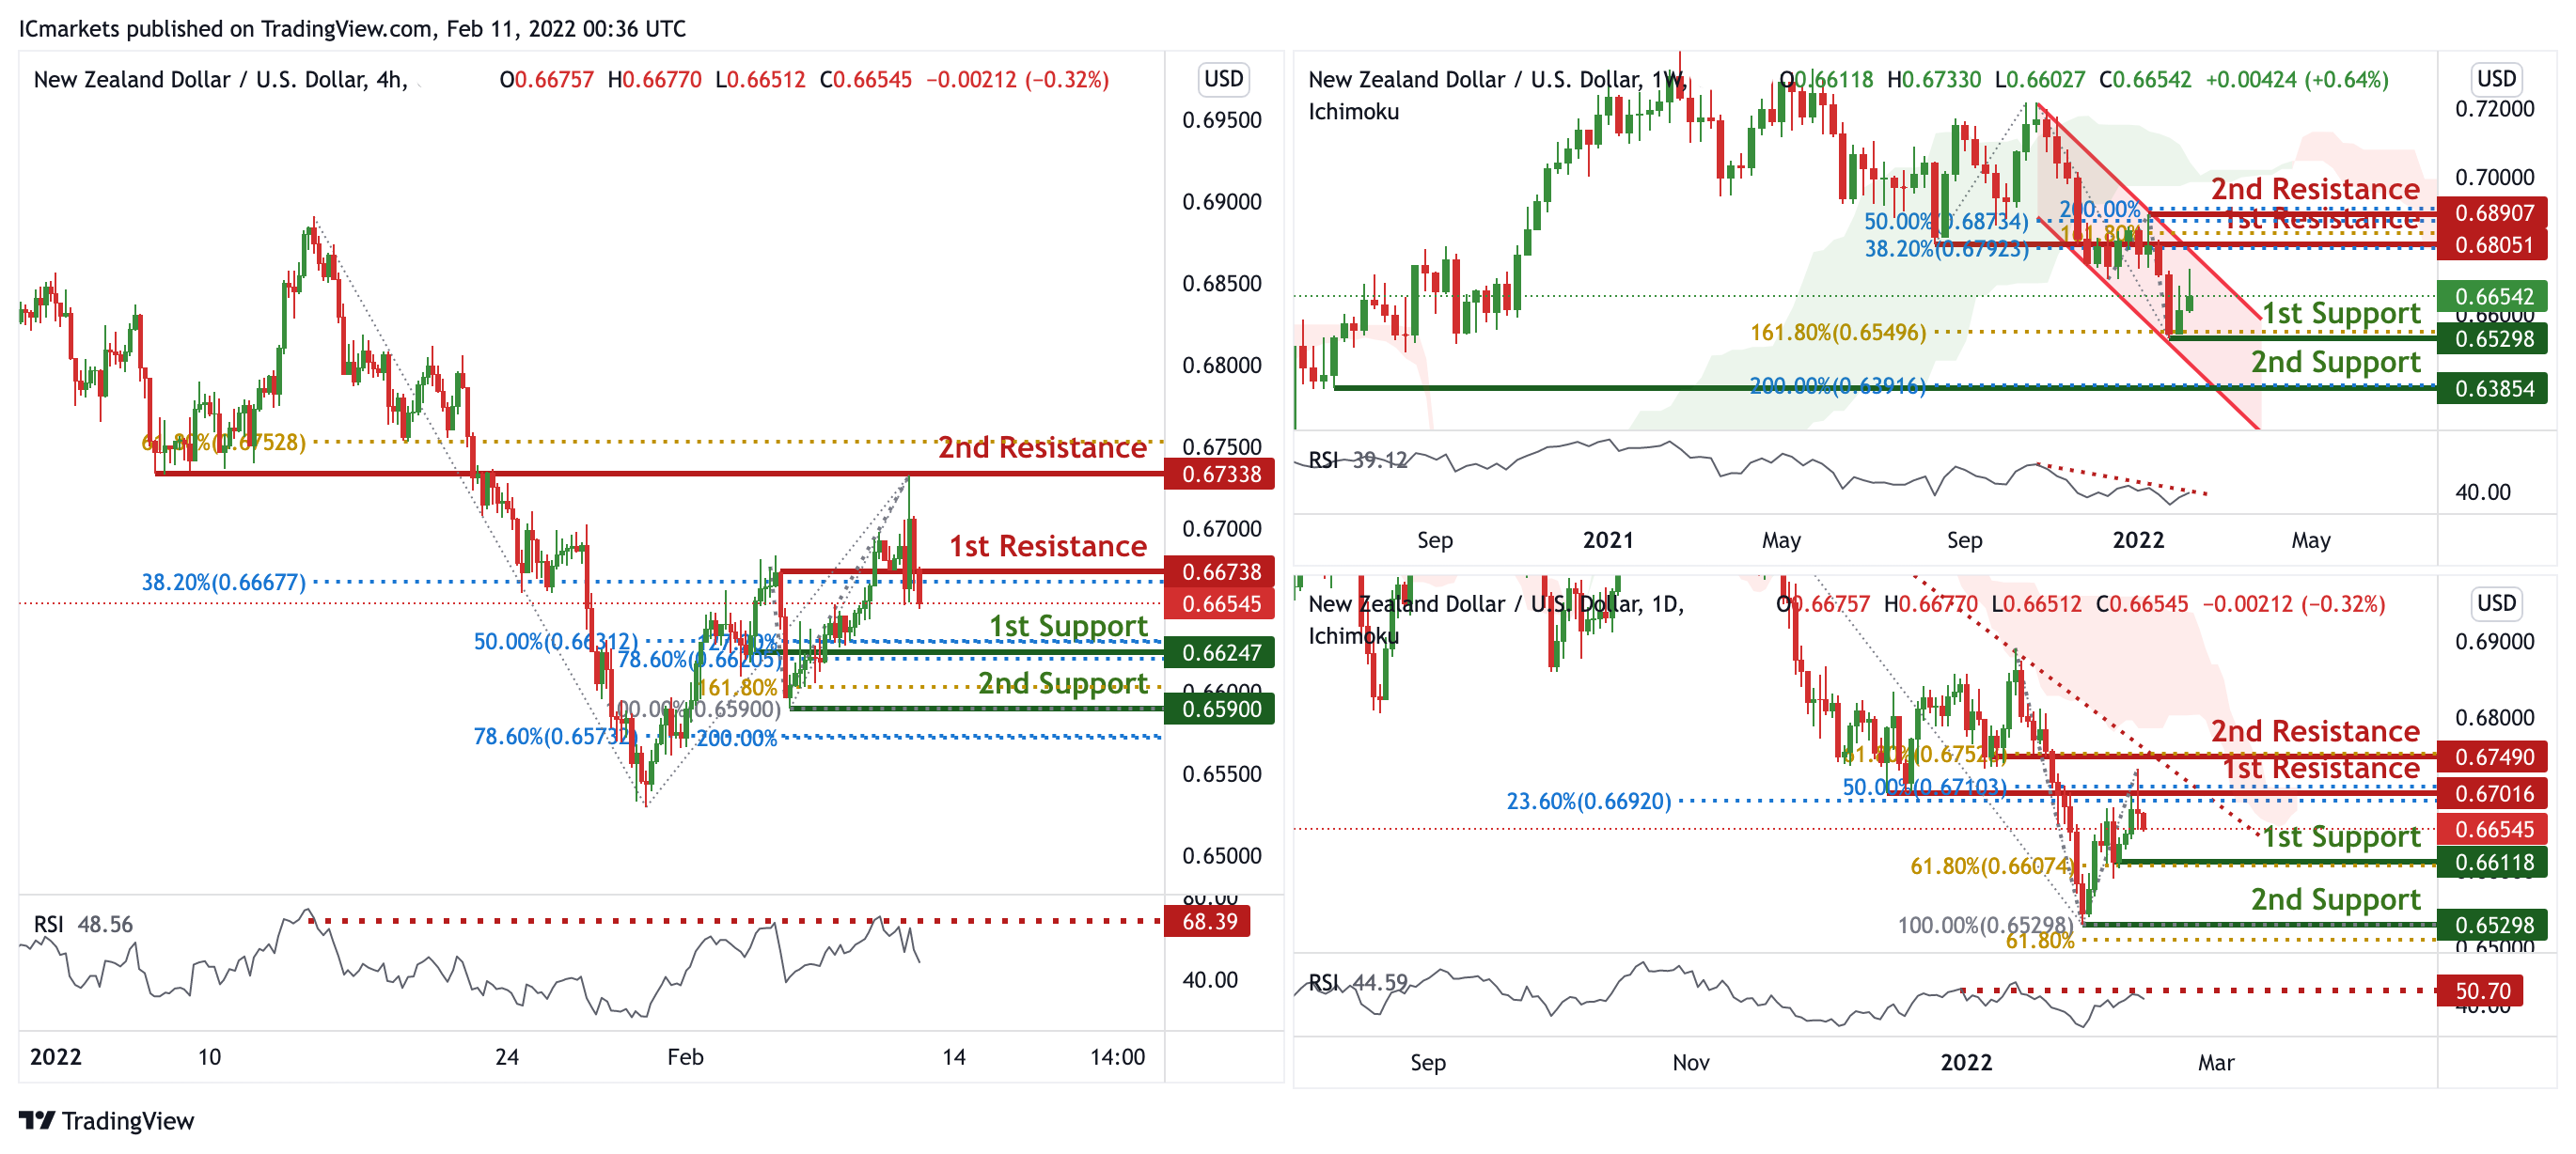
On the weekly, prices are on bearish momentum and consolidating in a bearish channel. We see the potential for a dip from our 1st resistance at 0.68051 in line with 38.2% Fibonacci retracement and 161.8% Fibonacci Projection towards our 1st support at 0.65298 in line with 161.8% Fibonacci Projection. Prices are trading below our Ichimoku cloud resistance and RSI is on bearish momentum, further supporting our bearish bias. On the daily, prices are on bearish momentum and abiding to our descending trendline. We see the potential for a dip from our 1st resistance at 0.67016 in line with 50% Fibonacci retracement and 23.6% Fibonacci retracement towards our 1st support at 0.66118 in line with 61.8% Fibonacci retracement. Prices sre trading below our ichimoku cloud resistance and also RSI is at levels where dips previously occurred, supporting our bearish bias.
On the H4 timeframe, prices have dipped beyond our strong graphical overlap and are on bearish momentum. We see potential for bearish continuation from our 1st resistance at 0.66738 in line with 38.2% Fibonacci retracement towards our 1st support at 0.66247 in line with 50% Fibonacci retracement, 78.6% Fibonacci extensions and 23.6% Fibonacci retracement. Our bias is further supported by RSI being at levels where dips previously occurred. Alternatively, our stop loss will be placed at 2nd resistance at 0.67338 in line with 61.8% Fibonacci retracement.
Areas of consideration:
- H4 time frame, 1st resistance at 0.66738
- H4 time frame, 1st support at 0.66247
USD/CAD:
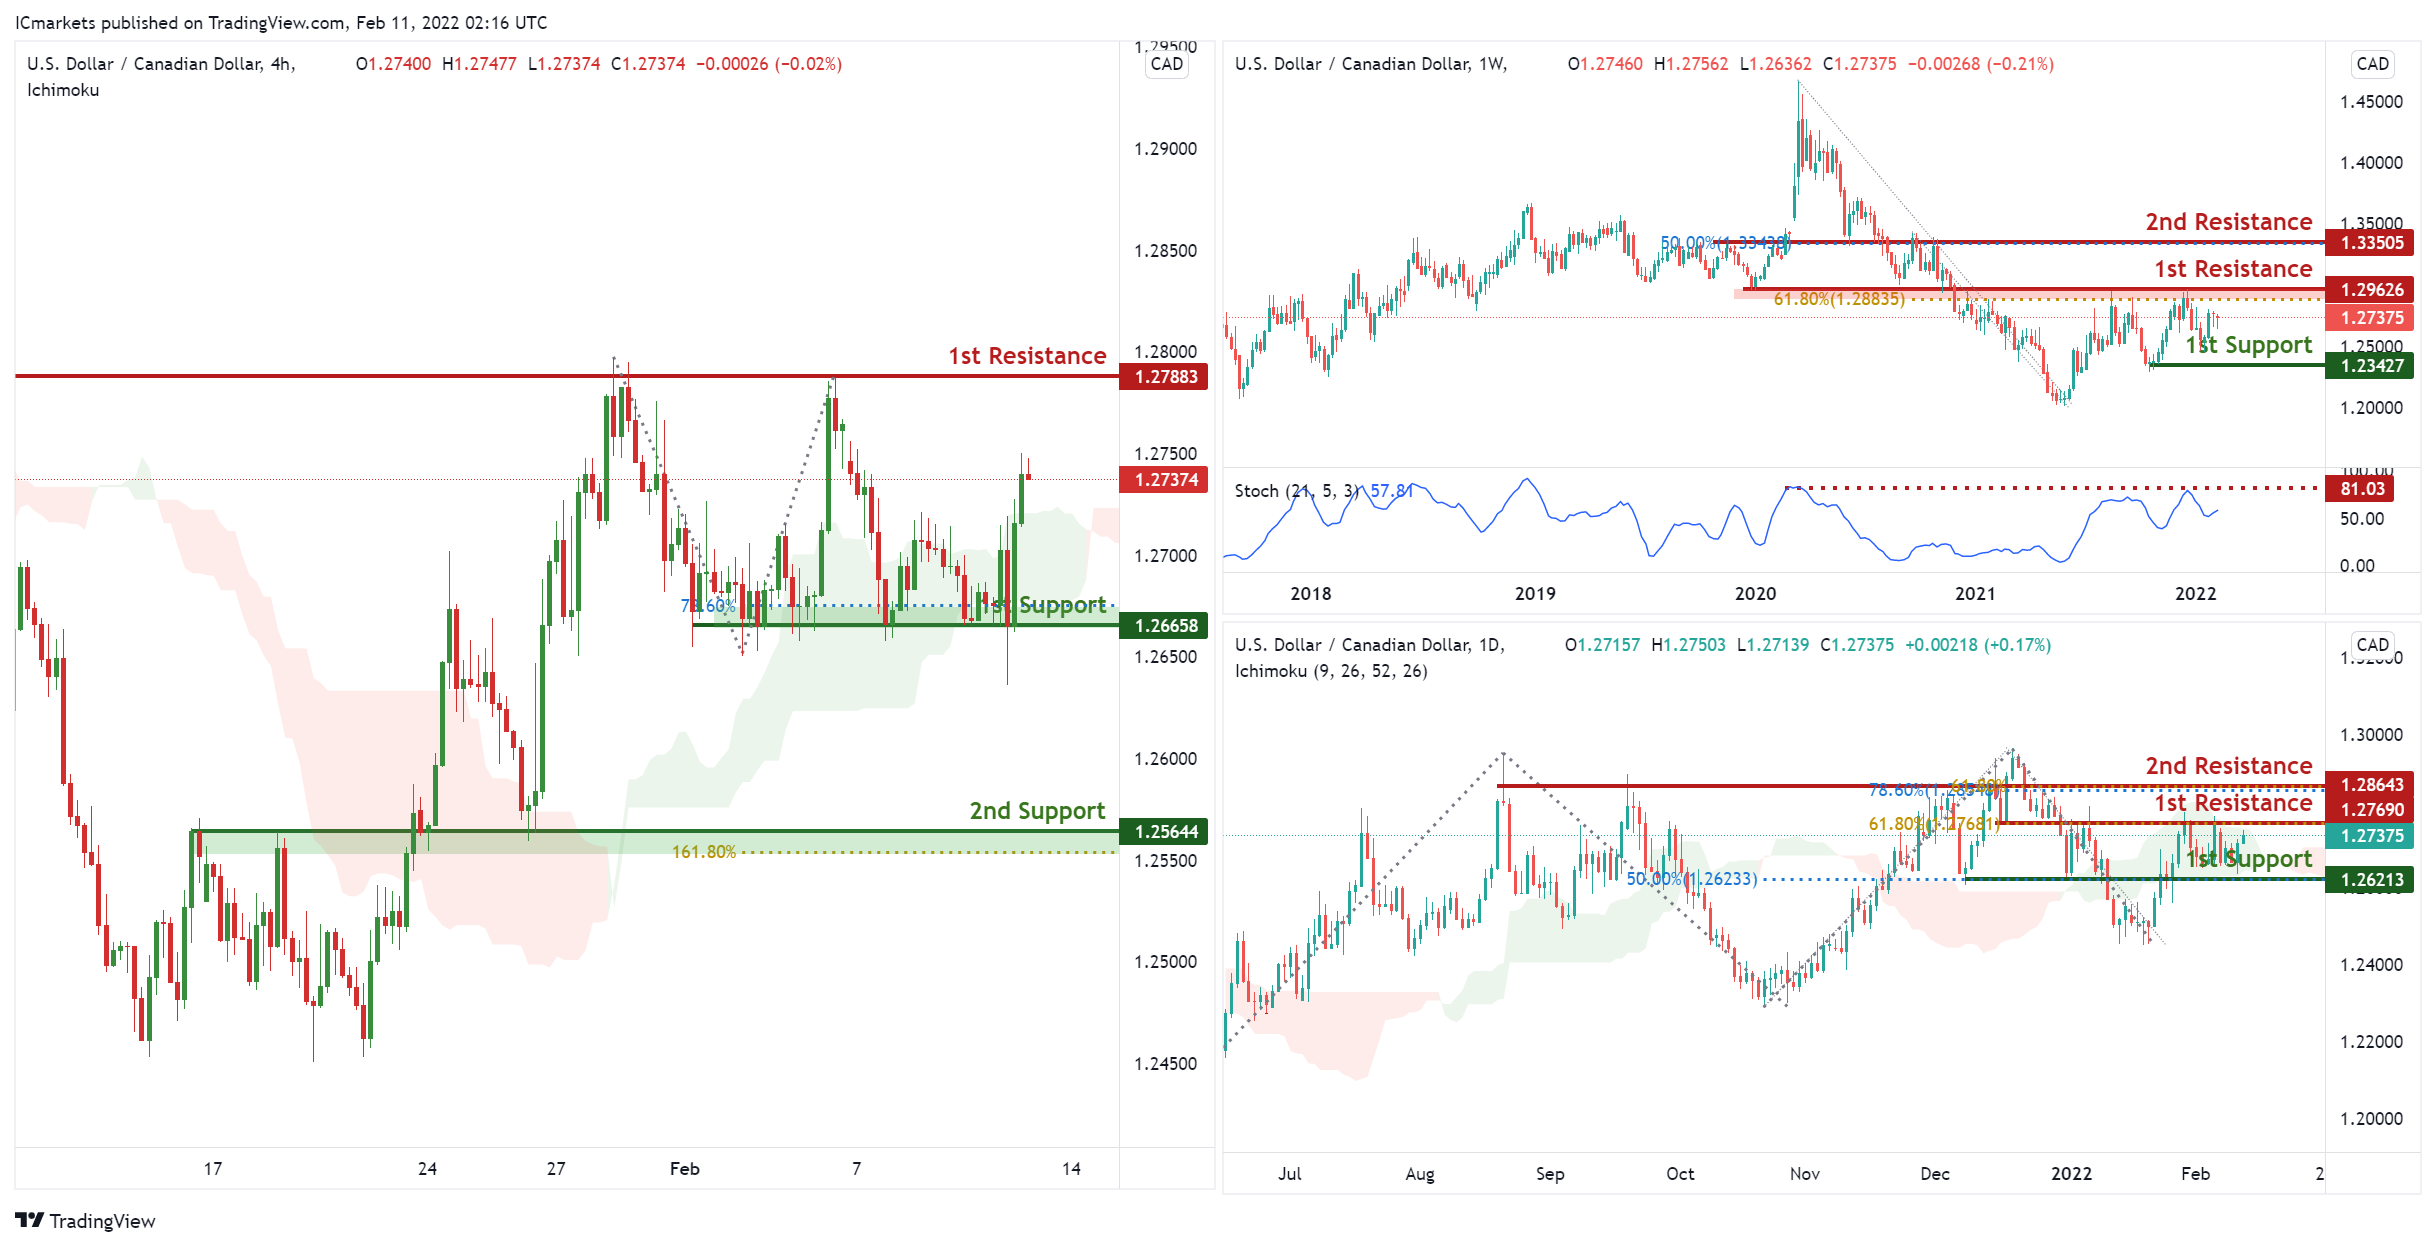
On the Weekly, with prices expected to reverse off the stochastics resistance, we see a potential drop to our 1st support at 1.25644 in line with horizontal overlap support from our 1st resistance at 1.26664 in line with horizontal overlap resistance. Alternatively, price may break 1st resistance structure and head for 2nd resistance at 1.27779, in line with the horizontal swing high resistance.
On the Daily, with prices approaching the resistance of the ichimoku cloud, we see a potential drop to our 1st support at 1.25644 in line with horizontal overlap support and 50% Fibonacci retracement from our 1st resistance at 1.26664 in line with horizontal overlap resistance and 61.8% Fibonacci retracement . Alternatively, price may break 1st resistance structure and head for 2nd resistance at 1.27779, in line with the horizontal swing high resistance.
On the H4, with price moving above the ichimoku cloud, signifying an overall bullish momentum. We can expect price to rise to our 1st resistance at 36251 in line horizontal graphical swing high resistance and 161.8% Fibonacci extension from our 1st support in line with horizontal overlap support at 35680. Alternatively, price may break 1st support structure and head for 2nd support, which coincides with horizontal swing low support at 34978.
Areas of consideration:
- H4 time frame, 1st support at 1.25644
- H4 time frame, 1st resistance at 1.26664
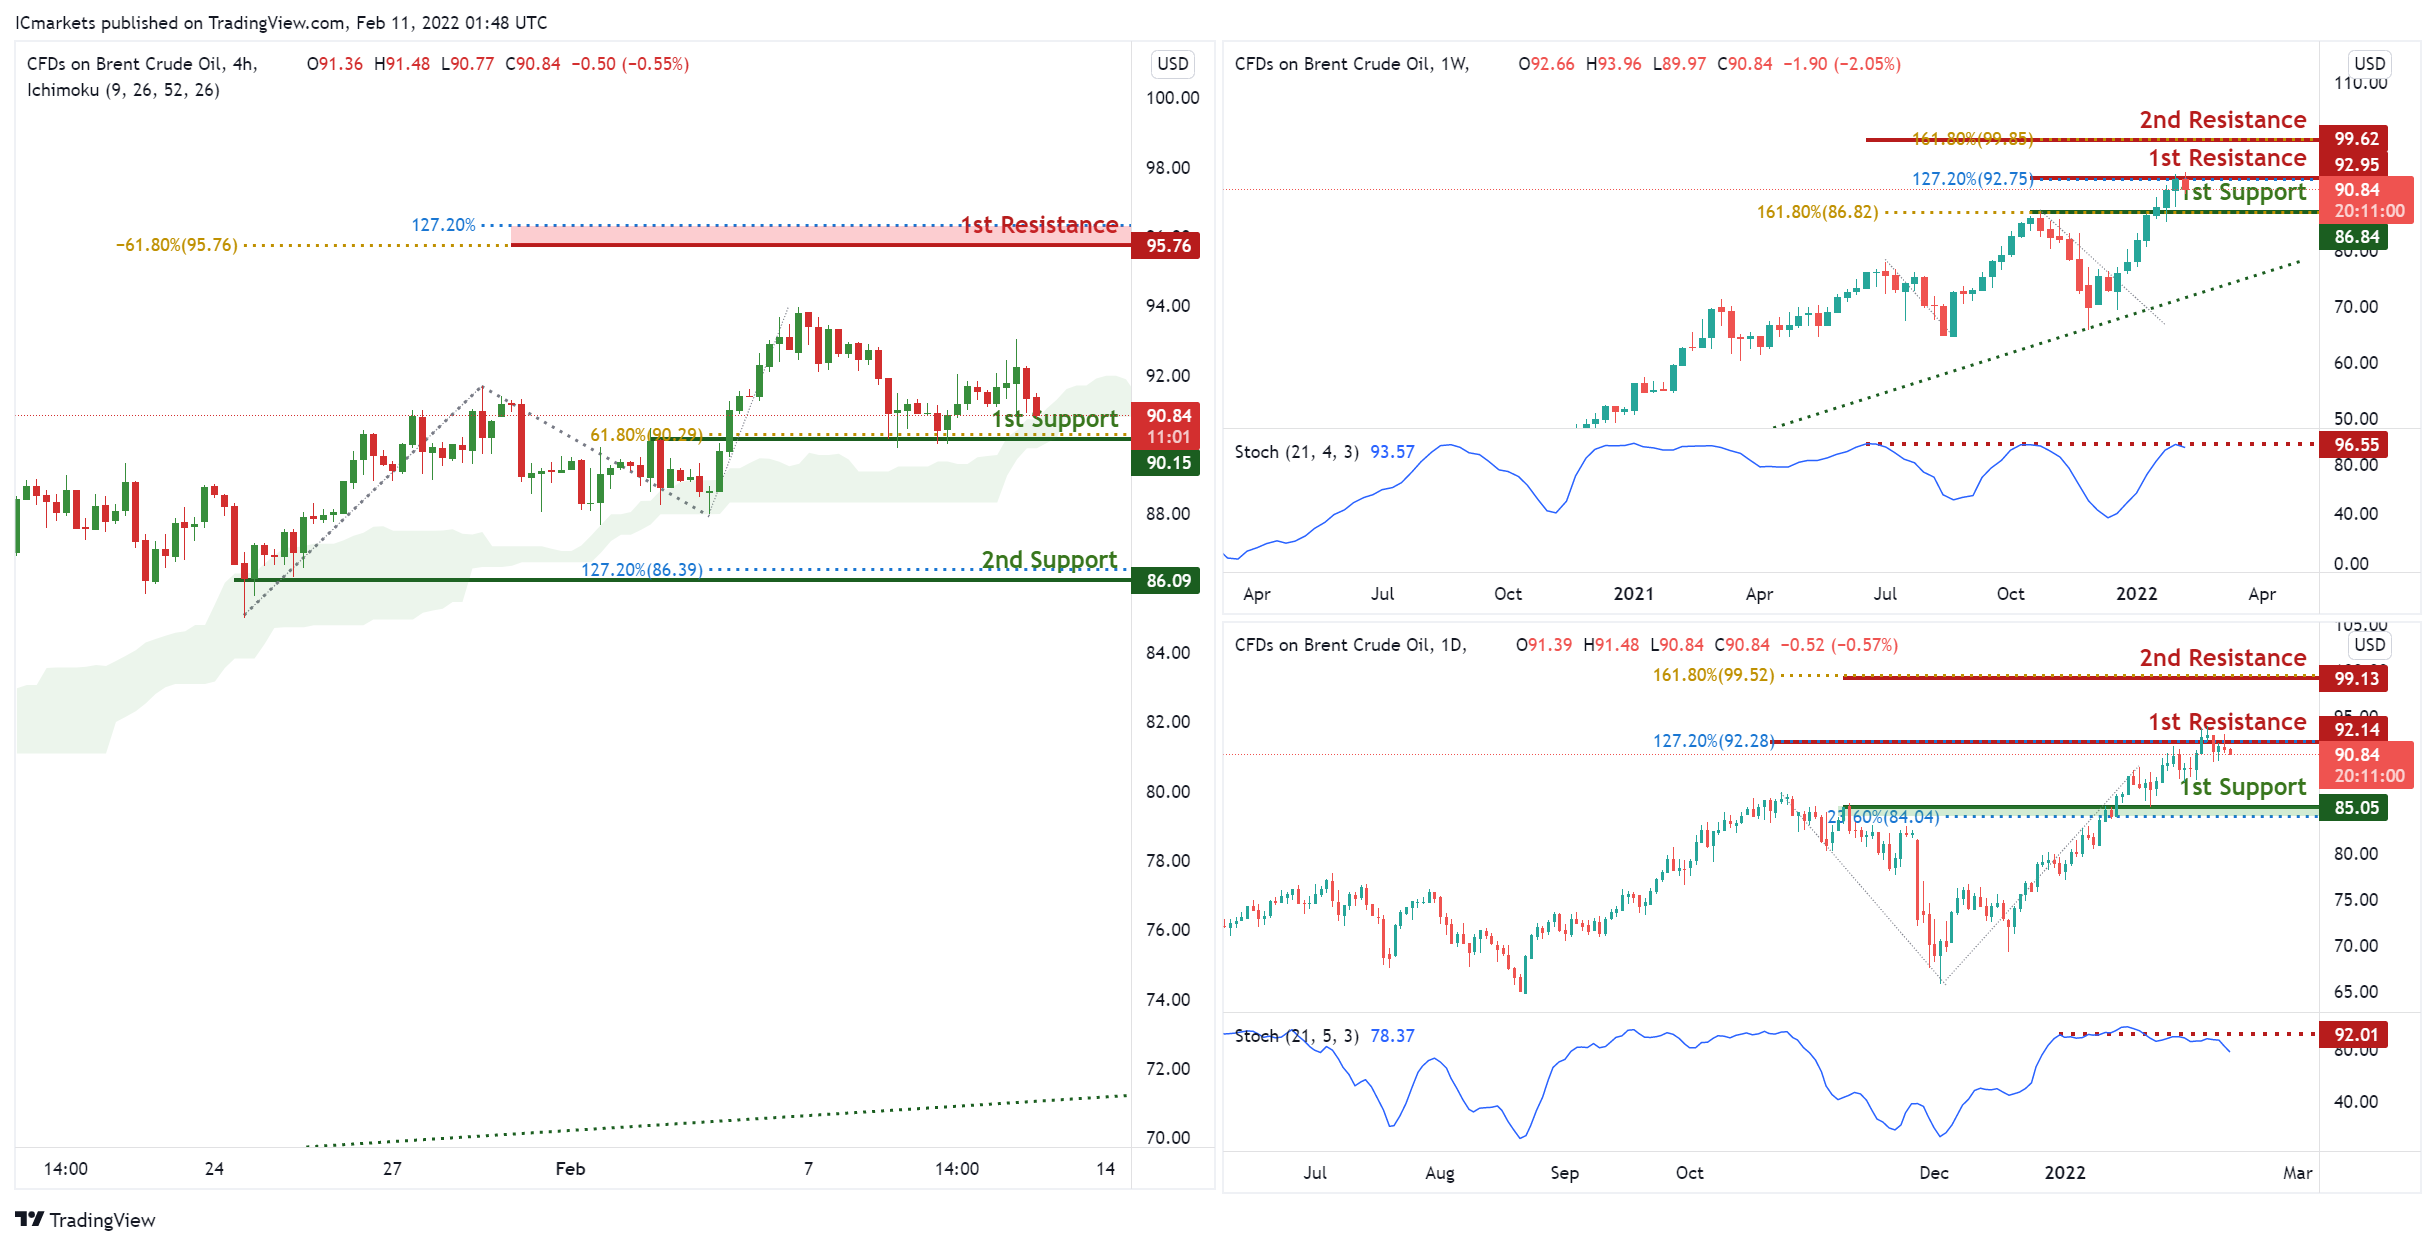
OIL:
On the Weekly, with prices expected to reverse off the stochastics resistance, we see a potential drop to our 1st support at 86.84 in line with horizontal overlap support and 127.2% Fibonacci extension from our 1st resistance at 92.95 in line with horizontal overlap resistance. Alternatively, price may break 1st resistance structure and head for 2nd resistance at 99.62, in line with the horizontal swing high resistance and 161.8% Fibonacci extension.
On the Daily, with prices expected to reverse off the stochastics resistance, we see a potential drop to our 1st support at 85.05 in line with horizontal overlap support and 23.6% Fibonacci retracement from our 1st resistance at 92.14 and 127.2% Fibonacci extension in line with horizontal swing high resistance. Alternatively, price may break 1st resistance structure and head for 2nd resistance at 99.13, in line with the horizontal swing high resistance.
On the H4, with prices moving above the ichimoku cloud, we see the potential for a bounce from our 1st support at 90.15 in line with horizontal overlap support towards our 1st resistance at 95.76 in line with the 127.2% Fibonacci extension and -61.8% Fibonacci expansion. Alternatively, price may break 1st support structure and head for 2nd support at 86.09, in line with the horizontal swing low support and 127.2% Fibonacci extension.
Areas of consideration:
- H4 time frame, 1st resistance of 95.76
- H4 time frame, 1st support of 90.15
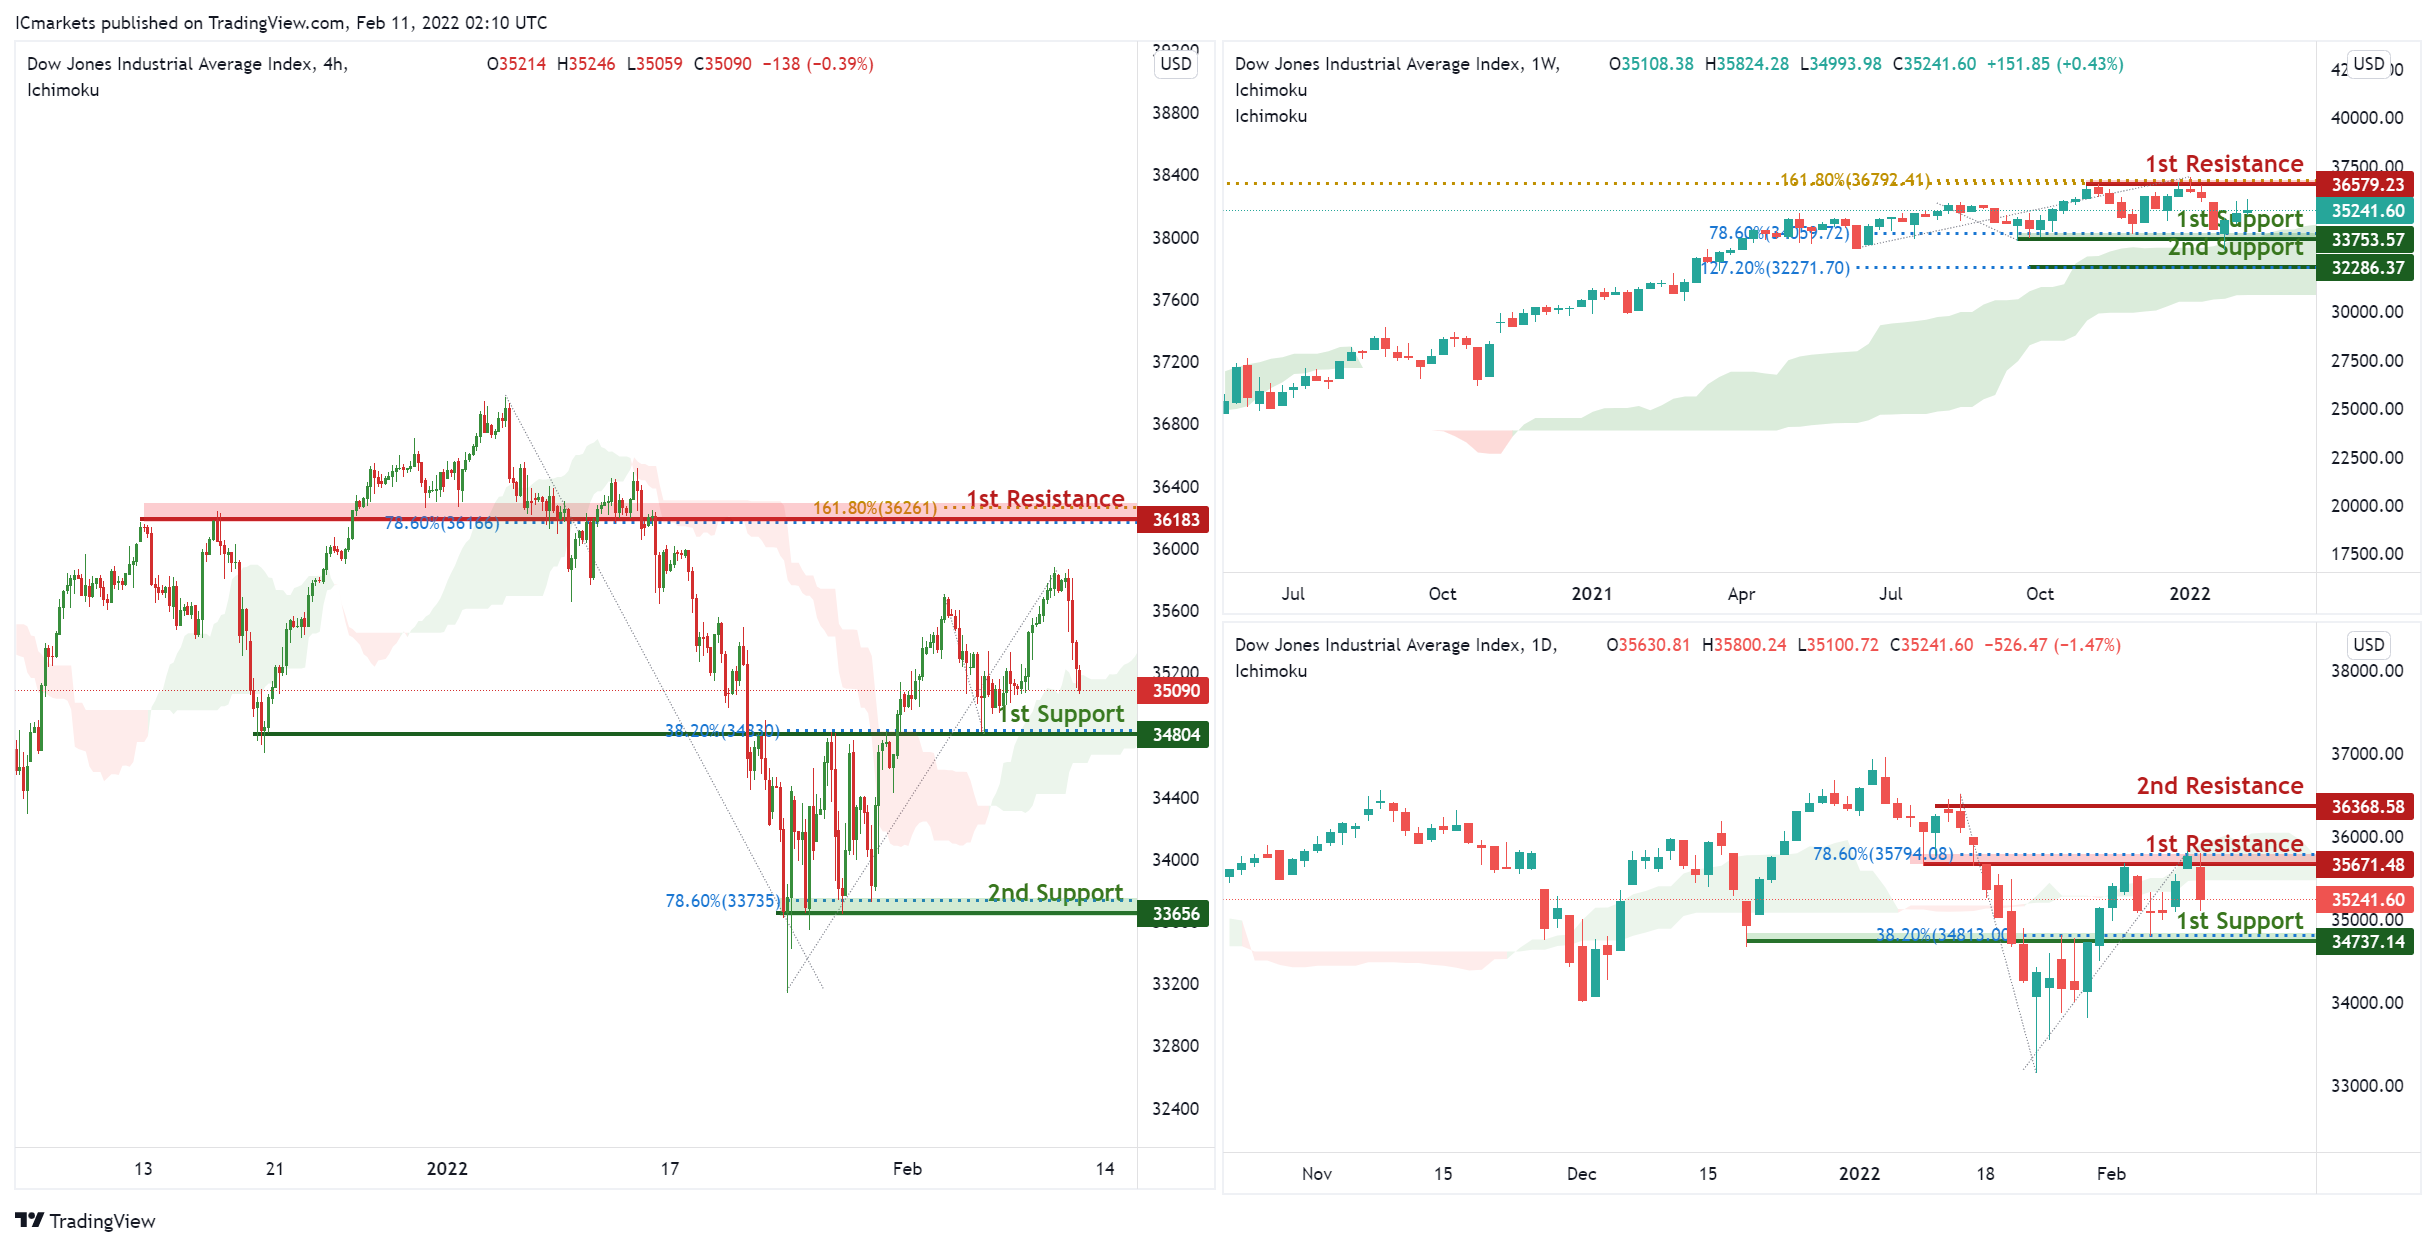
Dow Jones Industrial Average:
On the Weekly, with price moving above the ichimoku cloud, signifying an overall bullish momentum. We can expect price to rise to our 1st resistance at 36579 in line horizontal graphical swing high resistance and 161.8% Fibonacci extension from our 1st support in line with horizontal swing low support at 33753. Alternatively, price may break 1st support structure and head for 2nd support, which coincides with horizontal swing low support at 32286.
On the Daily, with price moving above the ichimoku cloud, signifying an overall bullish momentum. We can expect price to rise to our 1st resistance at 36251 in line horizontal graphical swing high resistance and 161.8% Fibonacci extension from our 1st support in line with horizontal overlap support at 35680. Alternatively, price may break 1st support structure and head for 2nd support, which coincides with horizontal swing low support at 34978.
On the H4, with price moving above the ichimoku cloud, signifying an overall bullish momentum. We can expect price to rise to our 1st resistance at 36251 in line horizontal graphical swing high resistance and 161.8% Fibonacci extension from our 1st support in line with horizontal overlap support at 35680. Alternatively, price may break 1st support structure and head for 2nd support, which coincides with horizontal swing low support at 34978.
Areas of consideration:
- H4 time frame, 1st resistance of 36251
- H4 time frame, 1st support of 35680


