
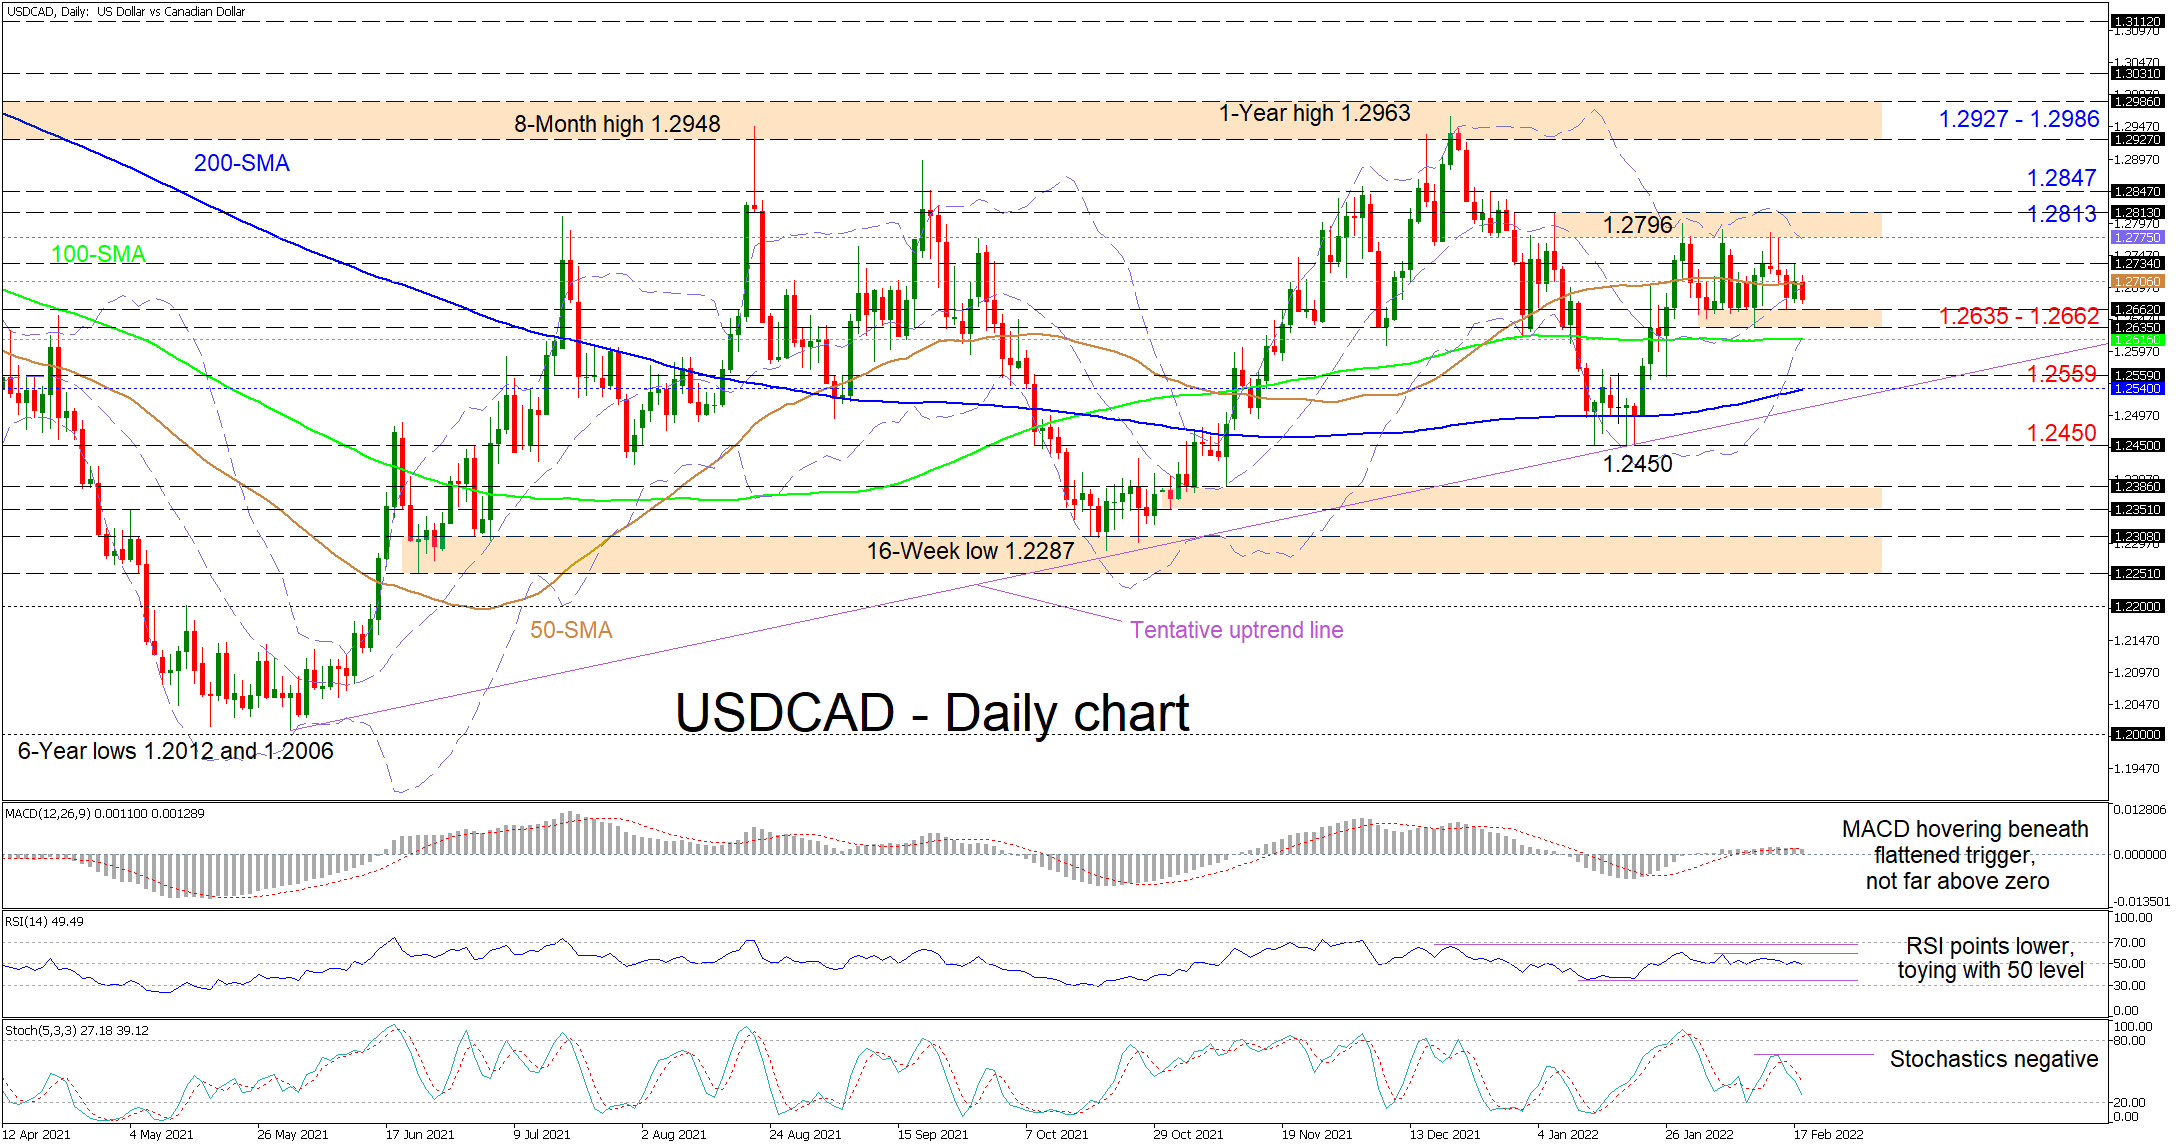
USDCAD is trading just beneath the horizontal 50-day simple moving average (SMA) around 1.2706 as a three-week consolidation period seems to have the pair chained between the 1.2635 and 1.2796 boundaries. The overall neutral trajectories of the SMAs suggest that the price trend has dissolved, hinting that the pair may continue to drift for a while longer.
The short-term oscillators are conveying conflicting messages in directional momentum. The MACD, slightly north of the zero threshold, is trailing marginally underneath its firming red signal line, while the RSI is flirting with the 50 level. That said, the negatively charged stochastic oscillator is promoting additional negative price moves on the lower side of the range.
In the negative scenario, preliminary downside constraints could occur at the 1.2635-1.2662 nearby base. If this floor of the sideways pattern gives way, prompt tough support may then come from the converged lower Bollinger band and 100-day SMA at 1.2616, before sellers target the region between the 1.2559 trough and the 200-day SMA at 1.2540. A further break of this key support band, which is overlapped by the tentative uptrend line pulled from the 6-year low of 1.2006, could be a tough blow towards the more than six-month gradual climb in the pair. Yet, the bears would need to slide beneath the January 19 trough of 1.2450 to spark worries about growing negative tendencies in the pair.
On the other hand, if buyers re-emerge and overstep the mid-Bollinger band at 1.2706 – coupled with the flattening 50-day SMA – the yesterday’s high of 1.2734 could delay the test of the 1.2775-1.2796 ceiling of the range. That said, to strengthen upside momentum, the bulls would need to surpass this resistance section, which extends slightly higher up until the January 6 high of 1.2813. From here, overstepping the neighbouring 1.2847 barrier too could then propel the price higher towards the 1.2927-1.2986 resistance barricade, which has capped advances in the broader picture since early November 2020.
Summarizing, USDCAD is exhibiting a neutral-to-bullish tone above the 1.2635-1.2662 base, the longer-term 100- and 200-day SMAs, and the ascending trend line. That said, a break either below 1.2635-1.2662 or above 1.2813 could reveal the next clear price direction.


