
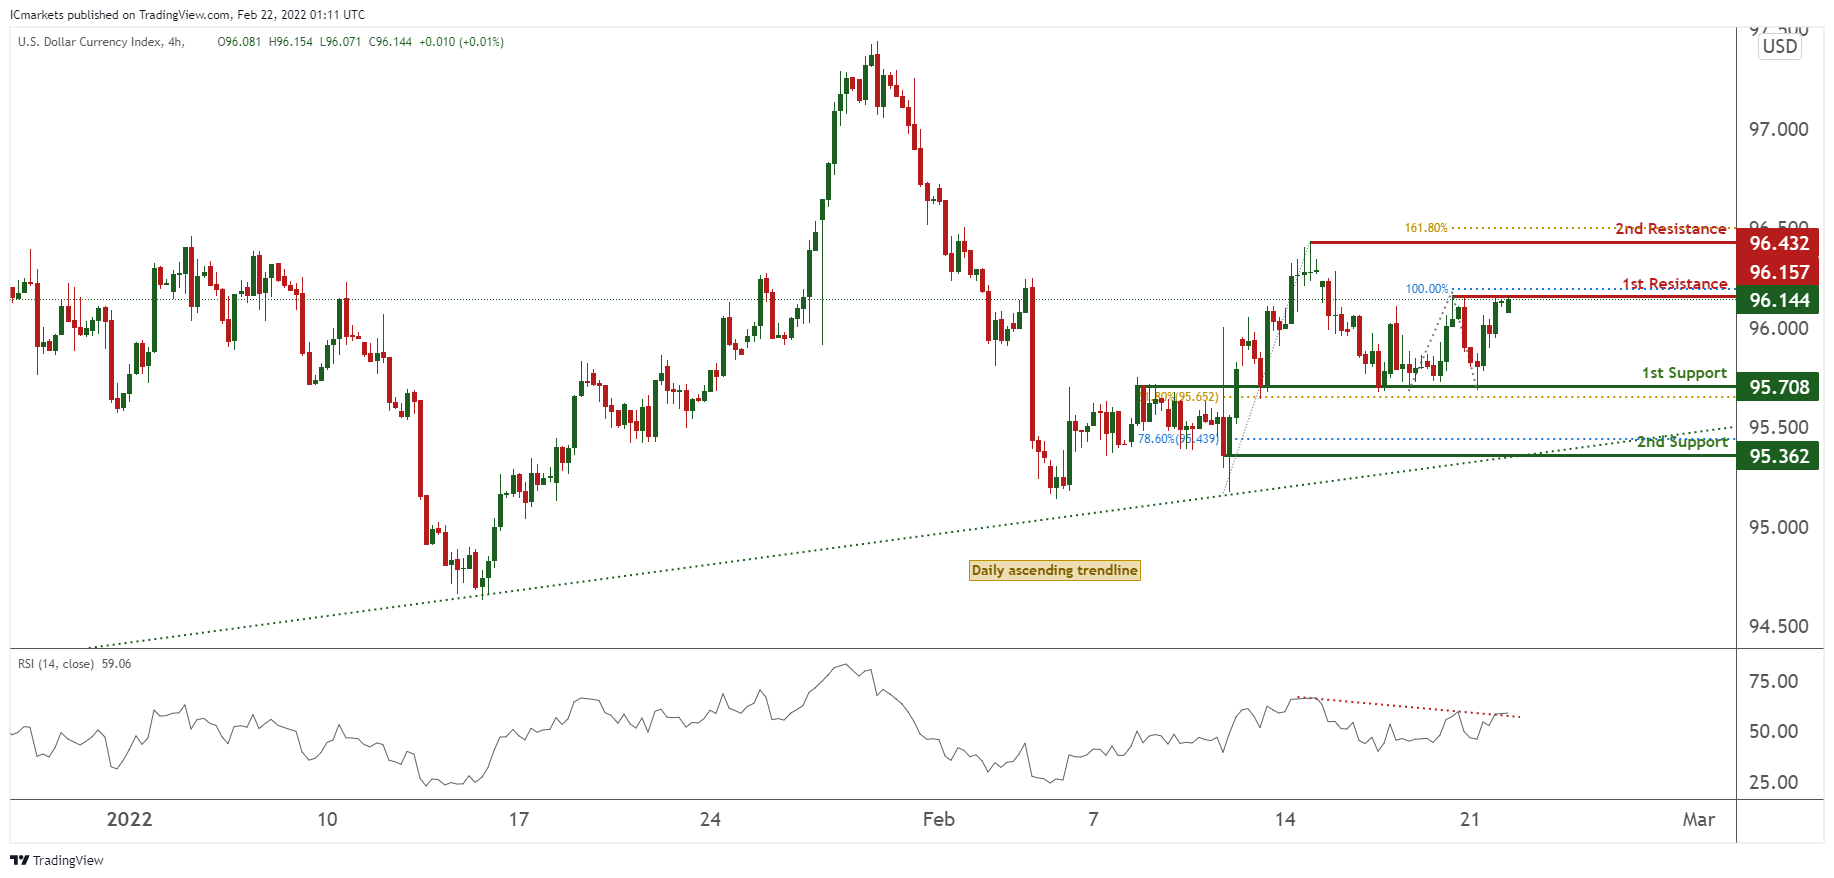
DXY:
On the H4, prices are at a pivot and recent swing high. We see potential for a short pullback from our 1st resistance at 96.157 in line with 100% Fibonacci extension towards our 1st support at 95.708 in line with 61.8% Fibonacci retracement. RSI are showing bearish momentum, further supporting our bearish bias.
Areas of consideration:
- H4 time frame, 1st resistance at 96.157
- H4 time frame, 1st support at 95.708
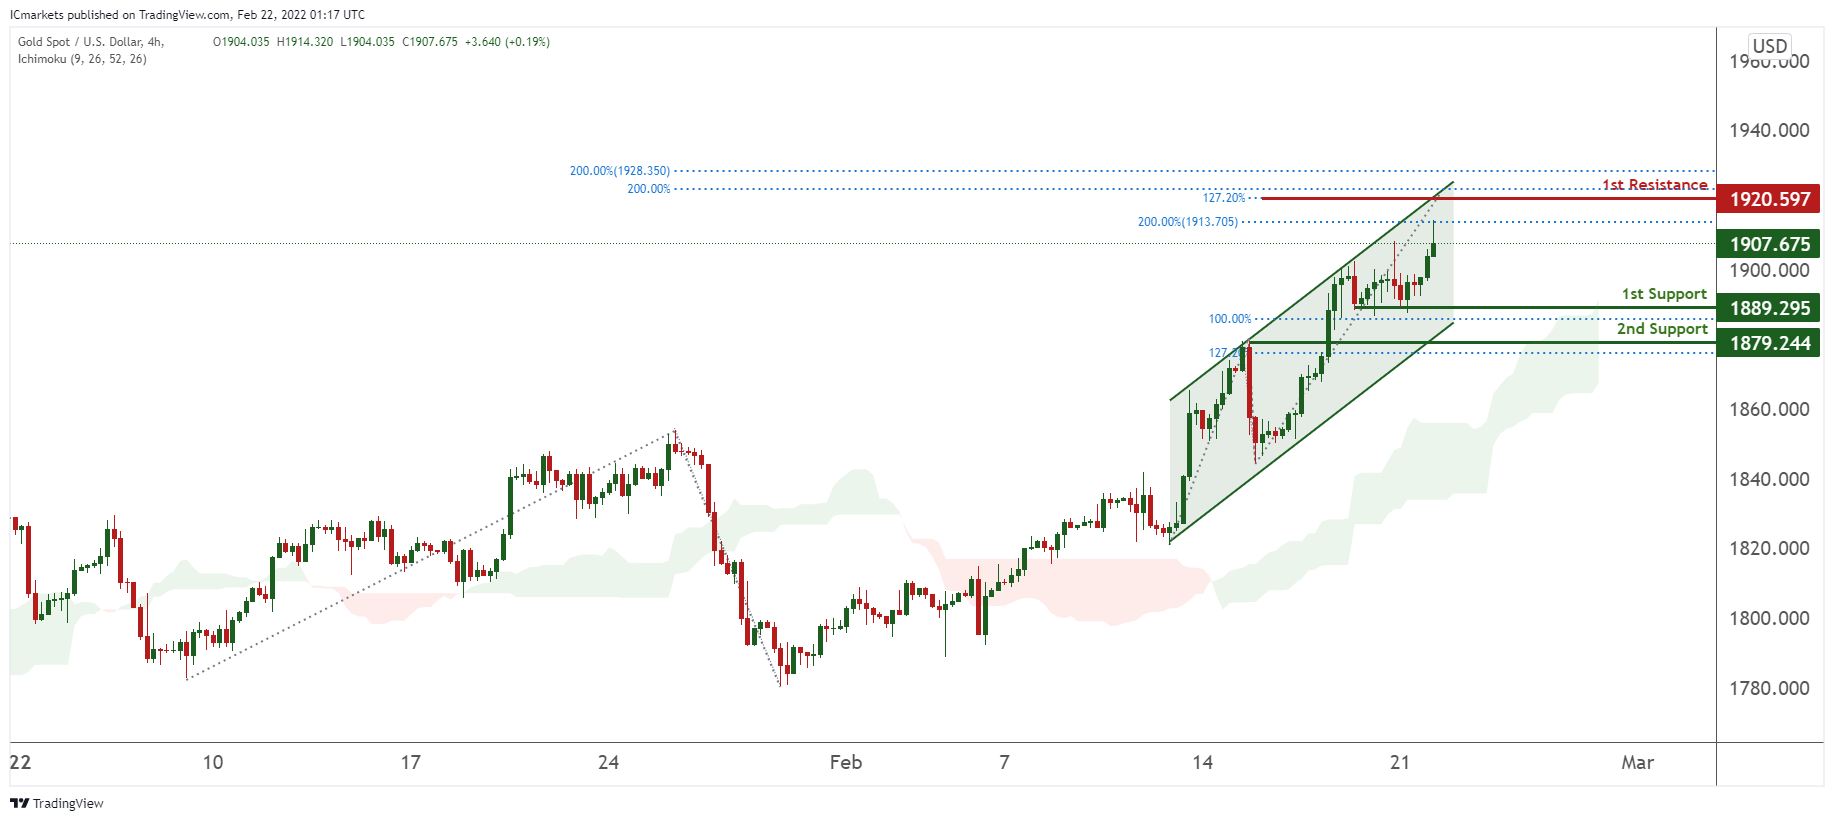
XAU/USD (GOLD):
On the H4 chart, prices are on bullish momentum and abiding to our ascending channel. We see potential for bullish continuation from our 1st support at 1889.295 in line with 100% Fibonacci extension towards our 1st resistance at 1920.597 in line with which is an area of Fibonacci confluences. Prices are trading above our Ichimoku support, further supporting our bullish bias.
Areas of consideration:
- 4h 1st support at 1889.295
- 4h 1st resistance at 1920.597
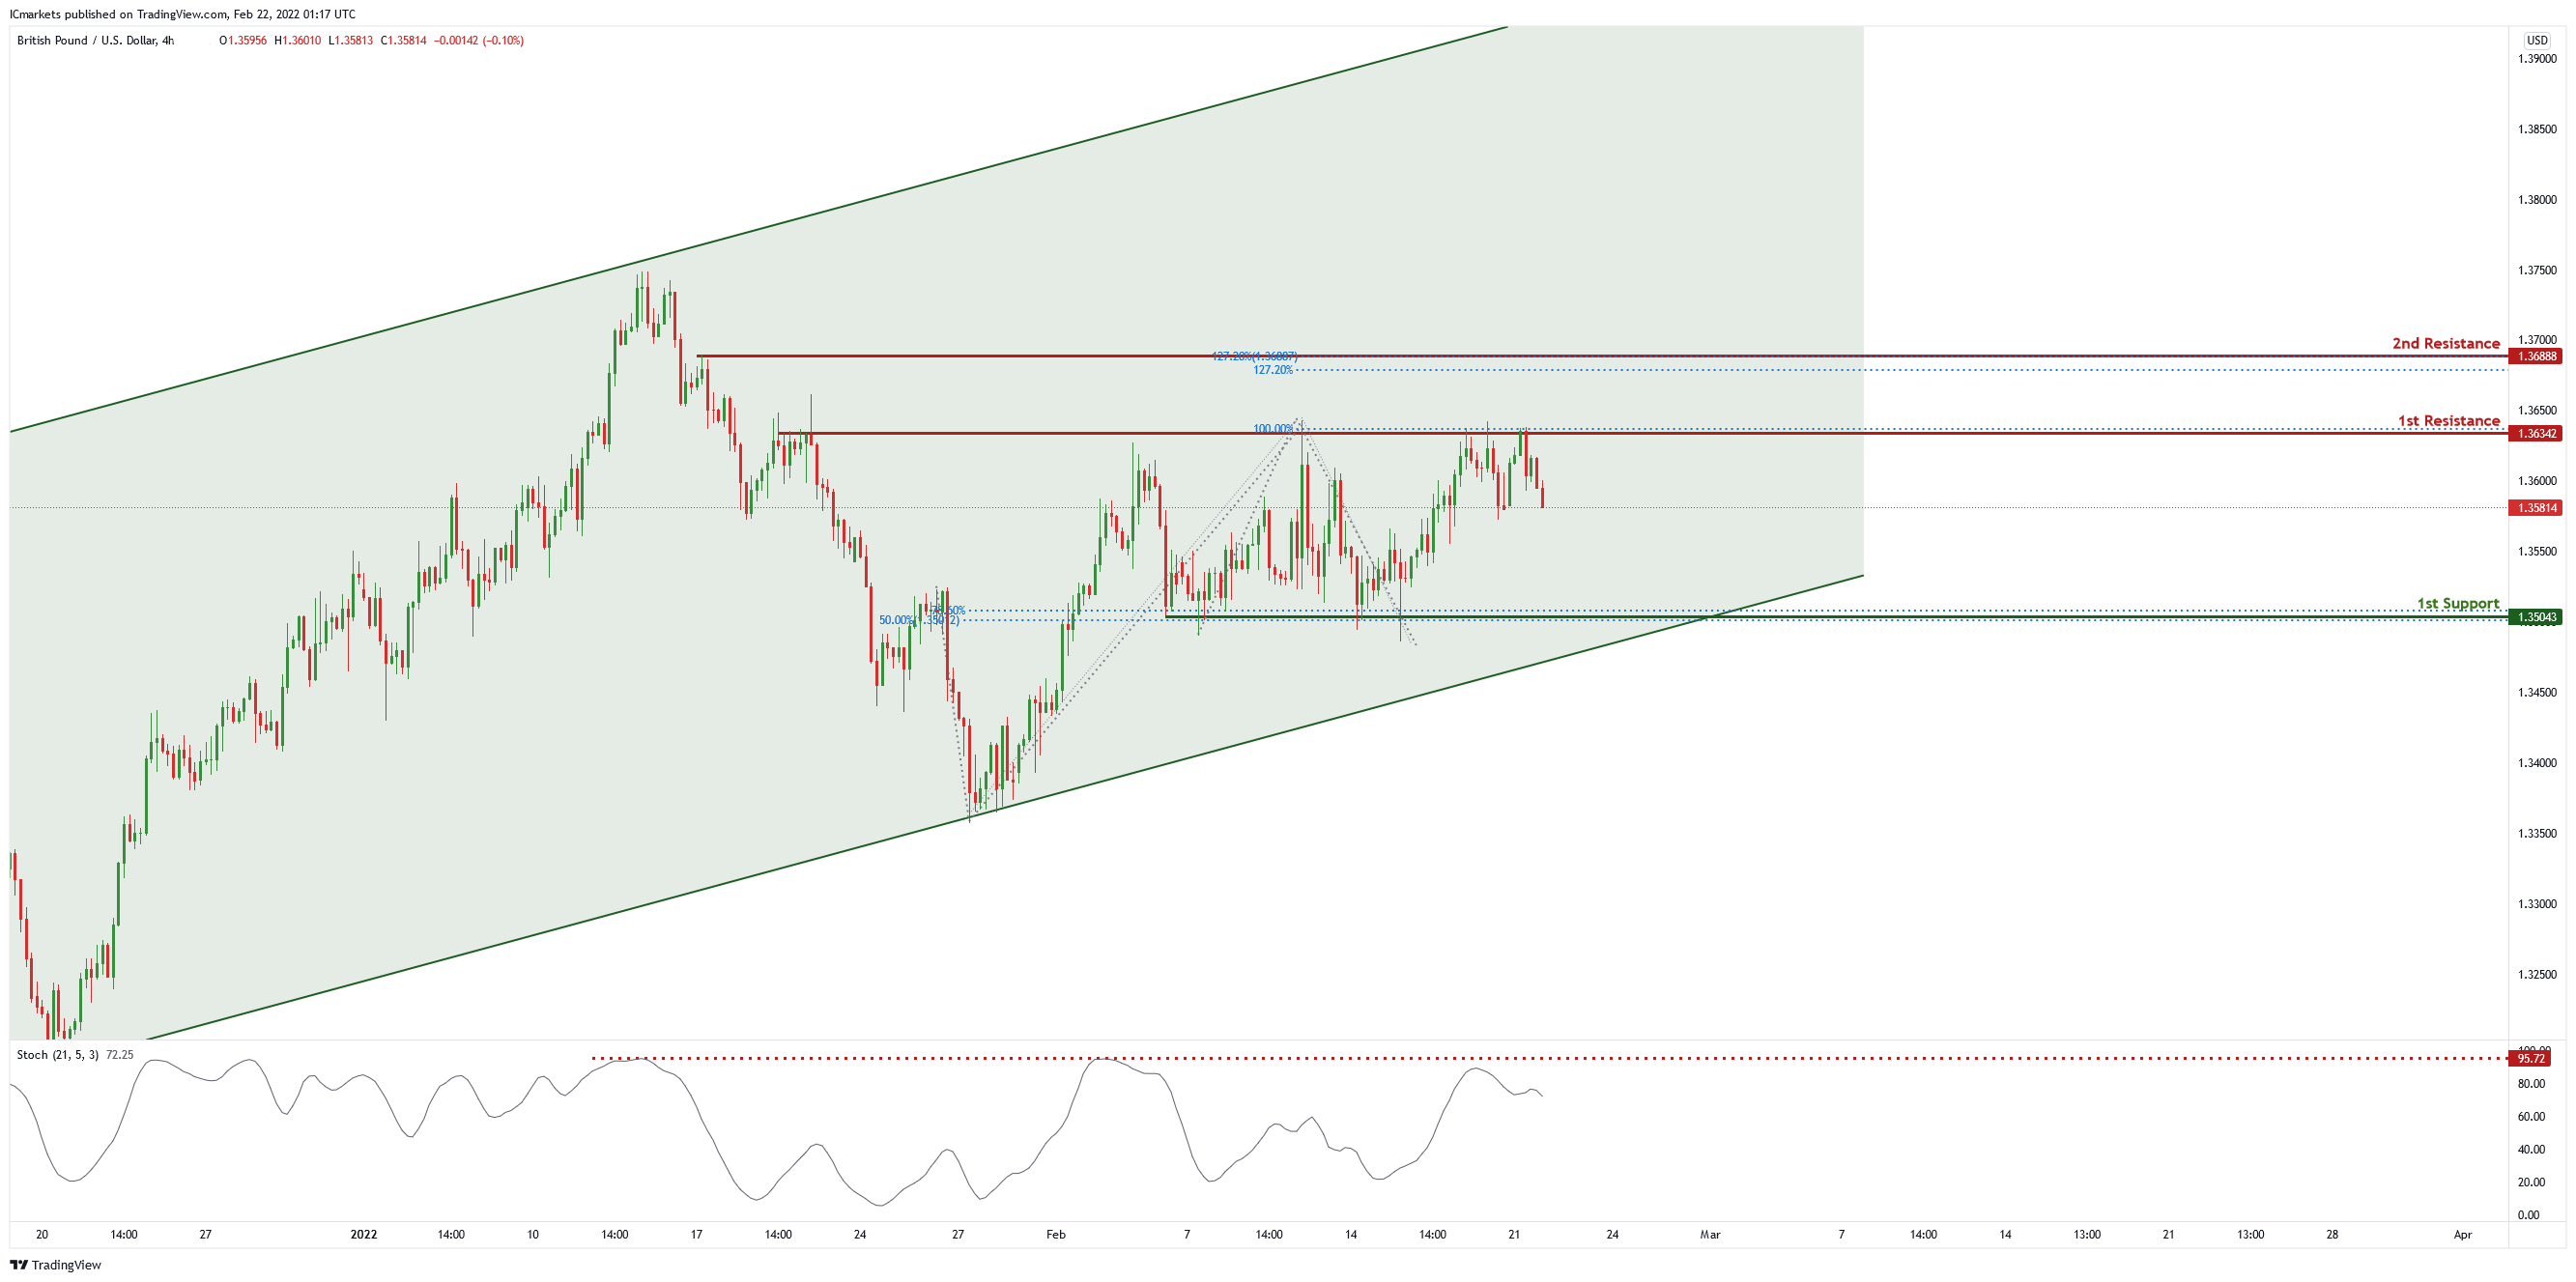
GBP/USD
On the H4 chart , price is near 1st resistance level of 1.36342 in line with 61.8% Fibonacci retracement and 100% Fibonacci projection. Price can potentially dip to the take profit level of 1.35043 in line with 50% Fibonacci retracement and 78.6% Fibonacci projection . Our bearish bias is supported by the stochastic indicator as it is near resistance level.
Areas of consideration
- H4 1st resistance at 1.36342
- H4 1st support at 1.35043
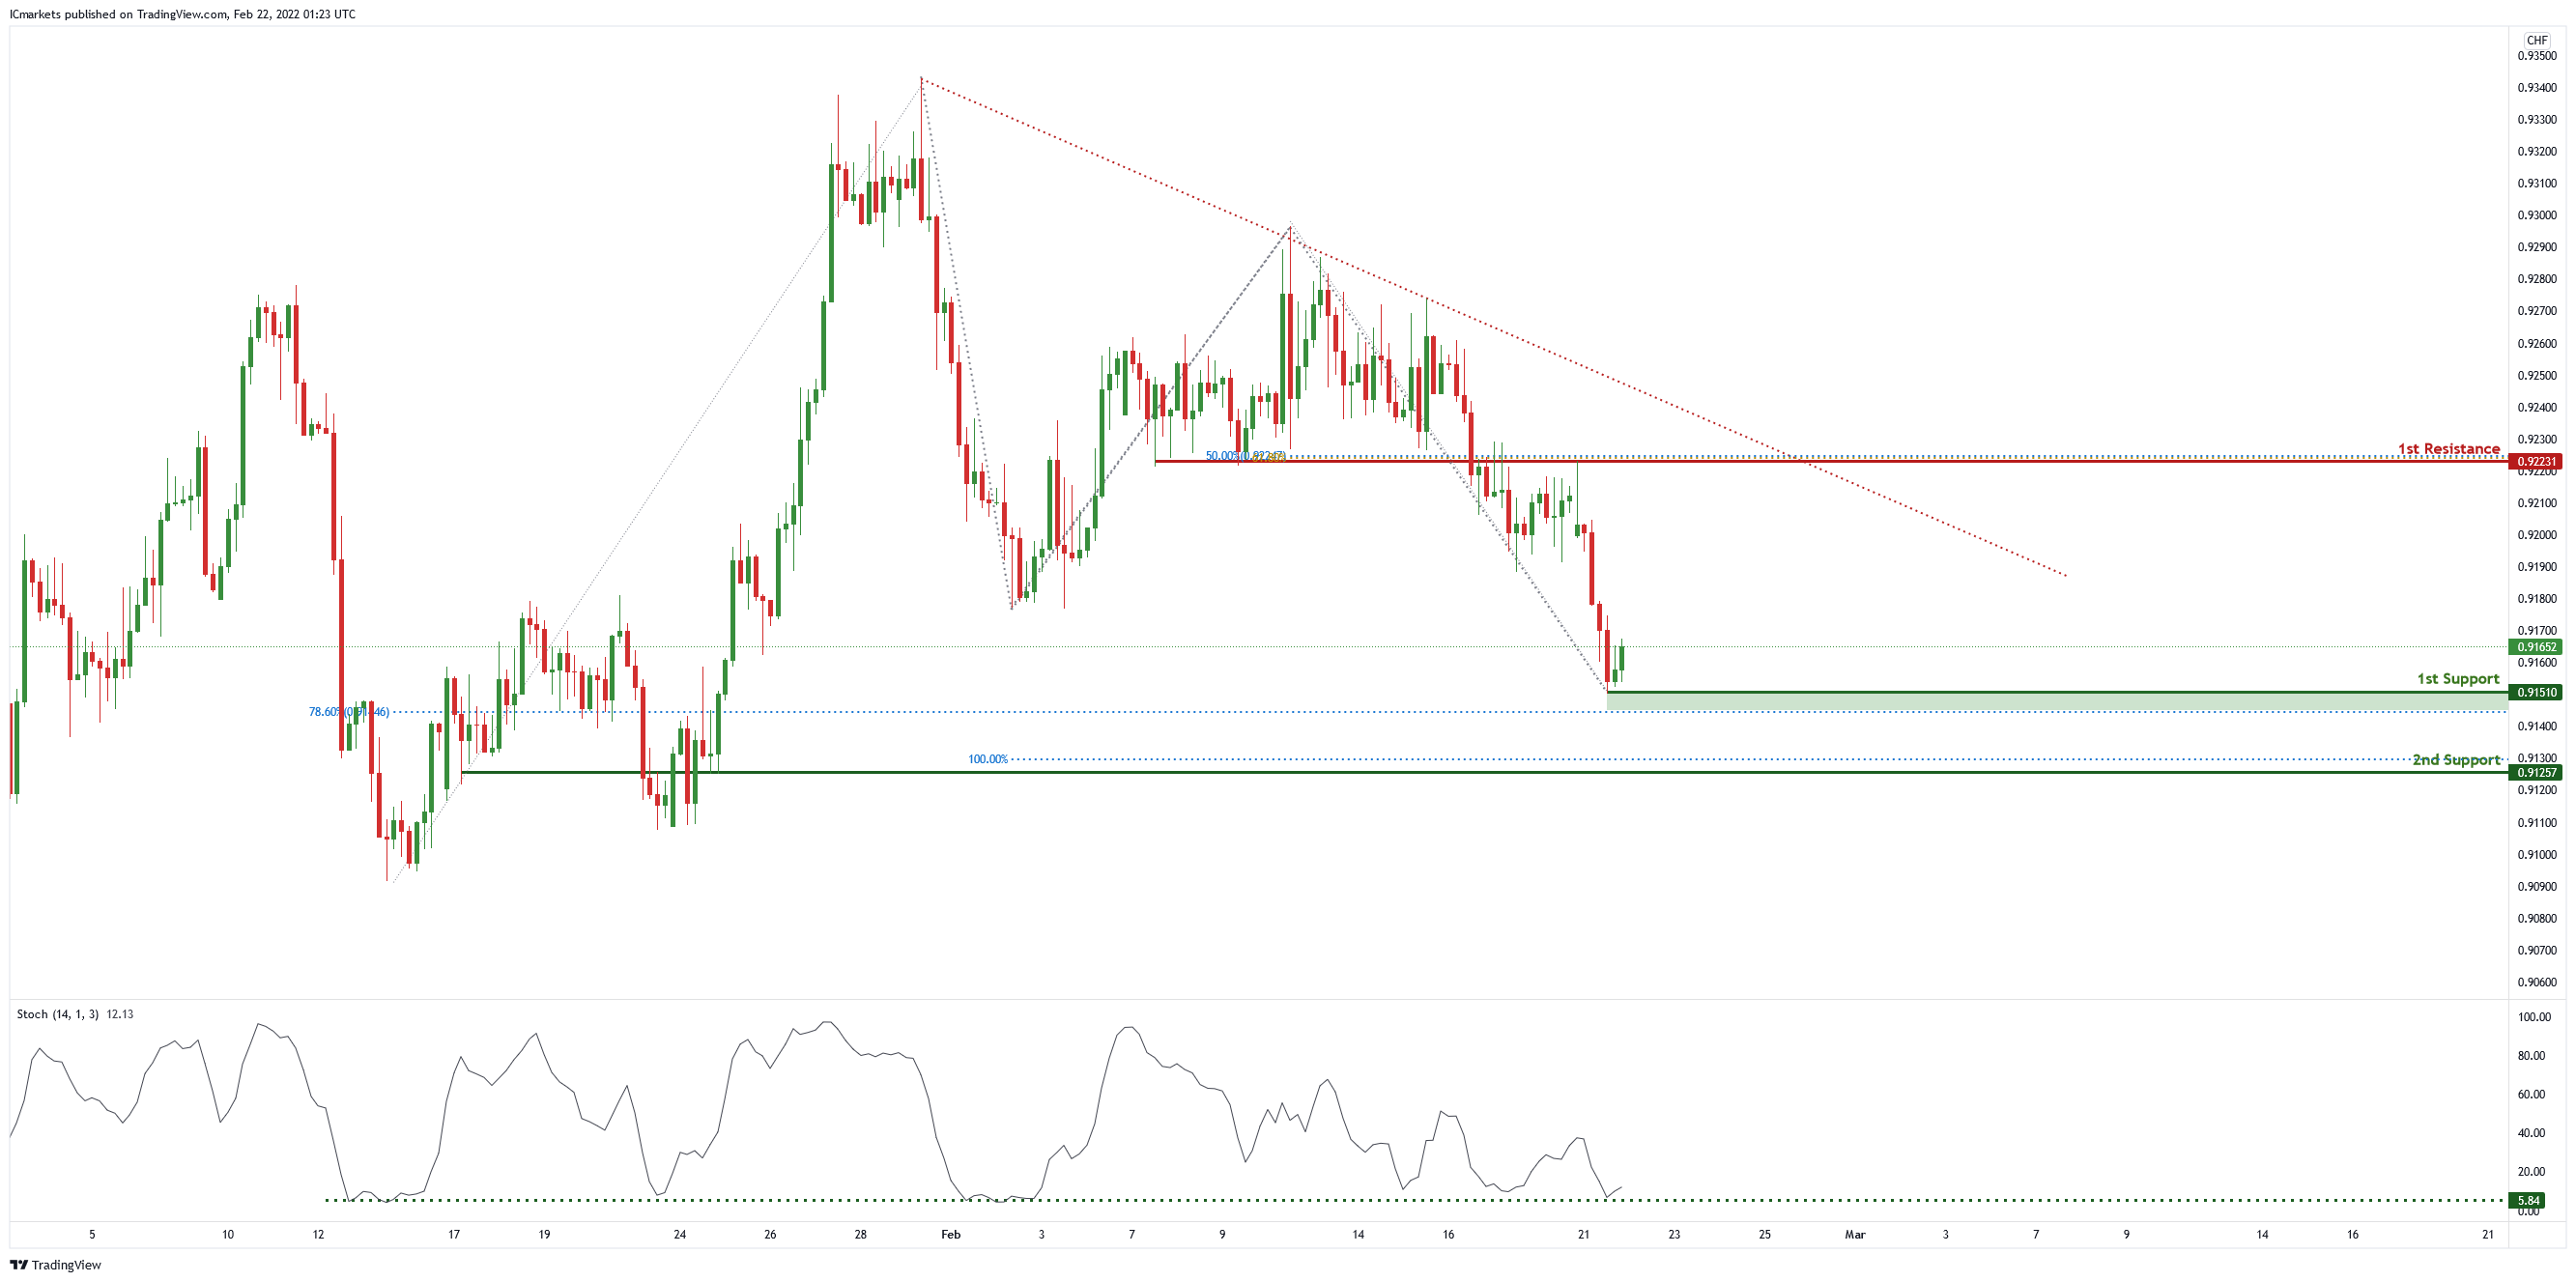
USD/CHF:
On the H4 chart price is abiding by a descending trendline and near 1st support of 0.91510 in line with 78.6% Fibonacci retracement. Price can potentially bounce to the 1st resistance of 0.92231 in line with 50% Fibonacci and 61.8% Fibonacci projection. Our bullish bias is supported by the stochastic indicator as it is at support level.
Areas of consideration :
- H4 1st resistance at 0.92231
- H4 1st support at 0.91510
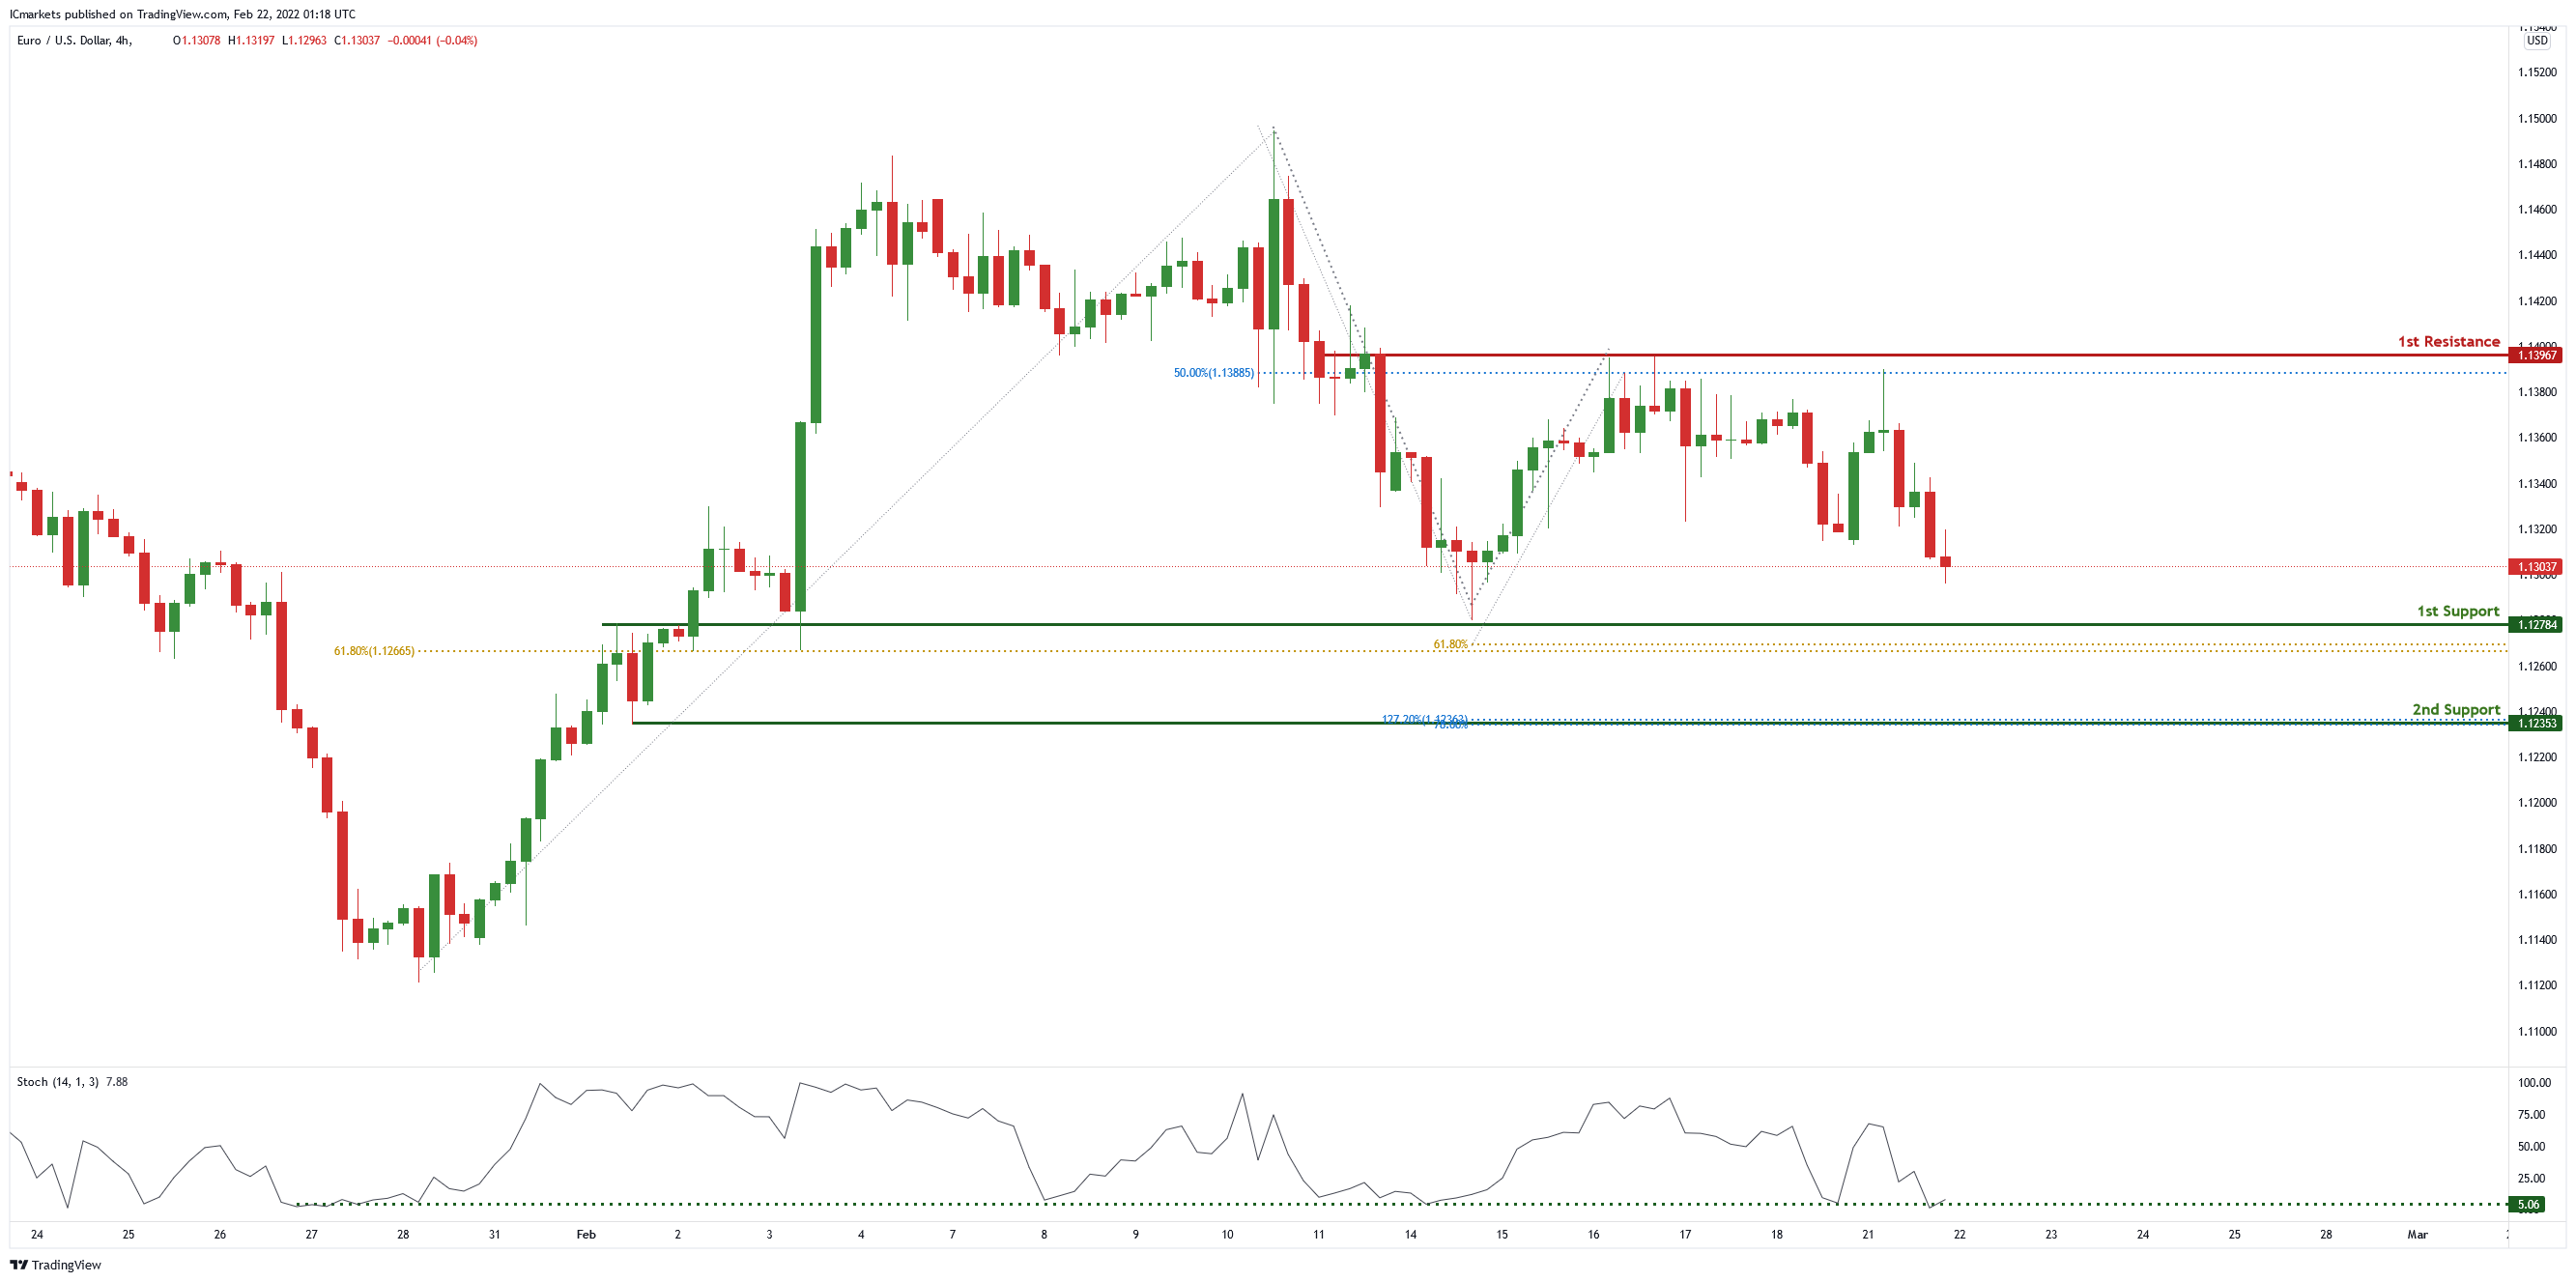
EUR/USD :
On the H4 chart price is near 1st support level of 1.12784 in line with 61.8% Fibonacci retracement and 61.8% Fibonacci projection. Price can potentially go to the 1st resistance level of 1.13967 in line with 50% Fibonacci retracement. Our bullish bias is supported by the stochastic indicator as it is at support level.
Areas on consideration :
- H4 1st support at 1.12784
- H4 1st resistance at 1.13967
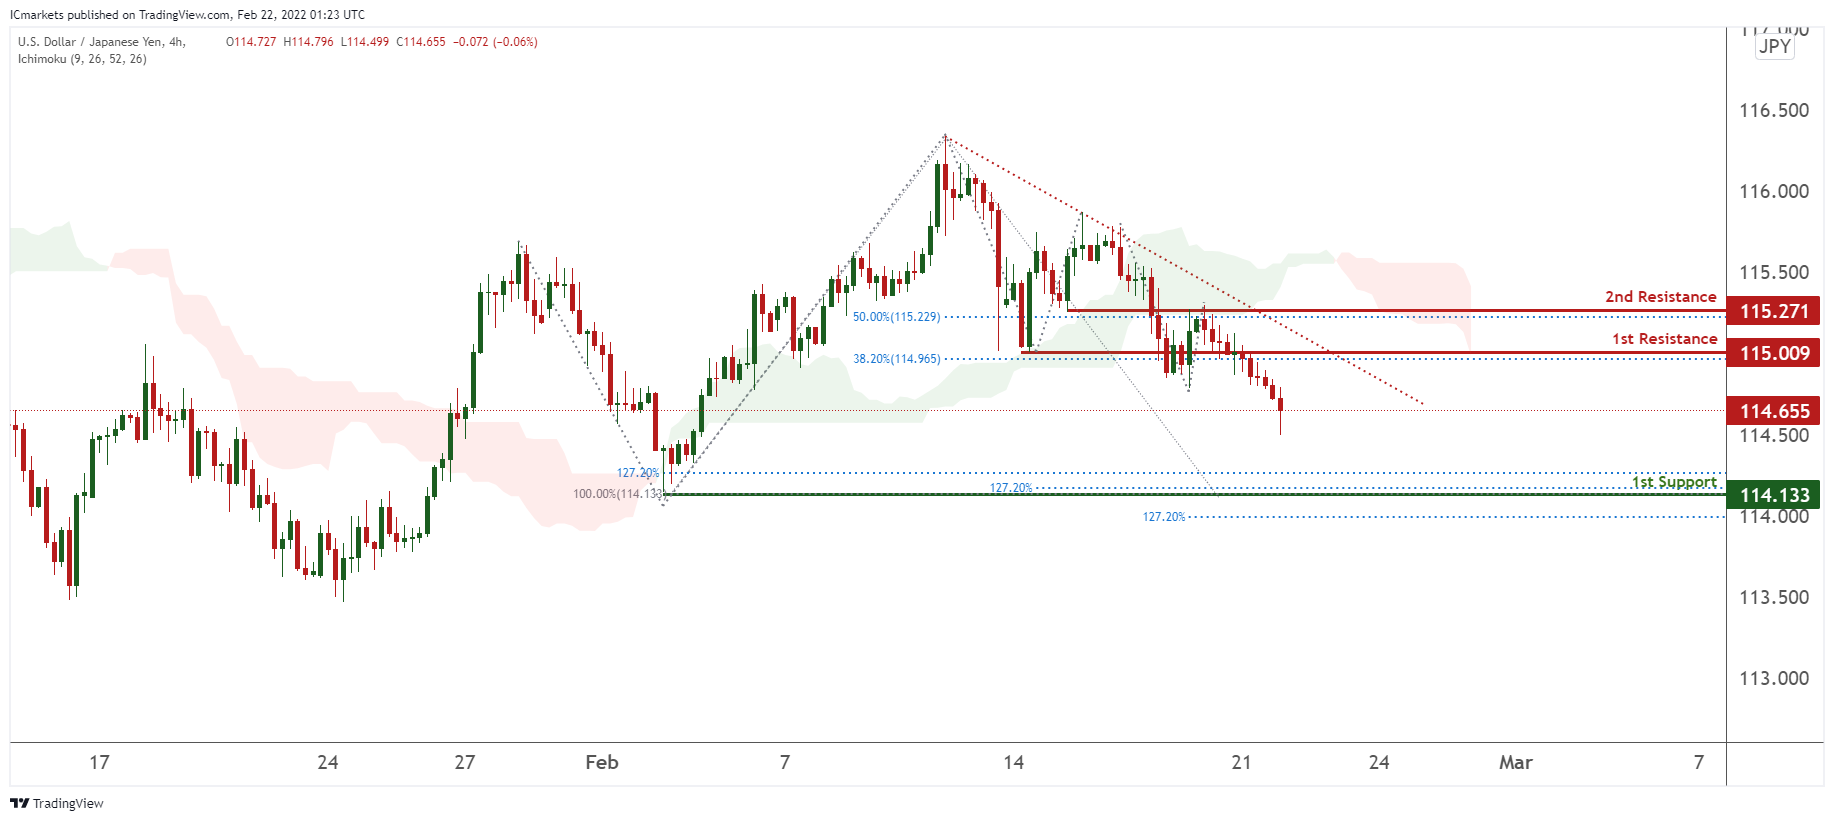
USD/JPY:
On the H4 timeframe, prices are on bearish momentum and abiding to our descending trendline. We see the possibility of bearish continuation from our 1st resistance at 115.009 in line with 38.2% Fibonacci retracement towards our 1st support at 114.133 in line which is an area of Fibonacci confluences. Our bearish bias is further supported by prices trading below our Ichimoku clouds.
Areas of consideration:
- H4 time frame, 1st resistance at 115.009
- H4 time frame, 1st support at 114.133
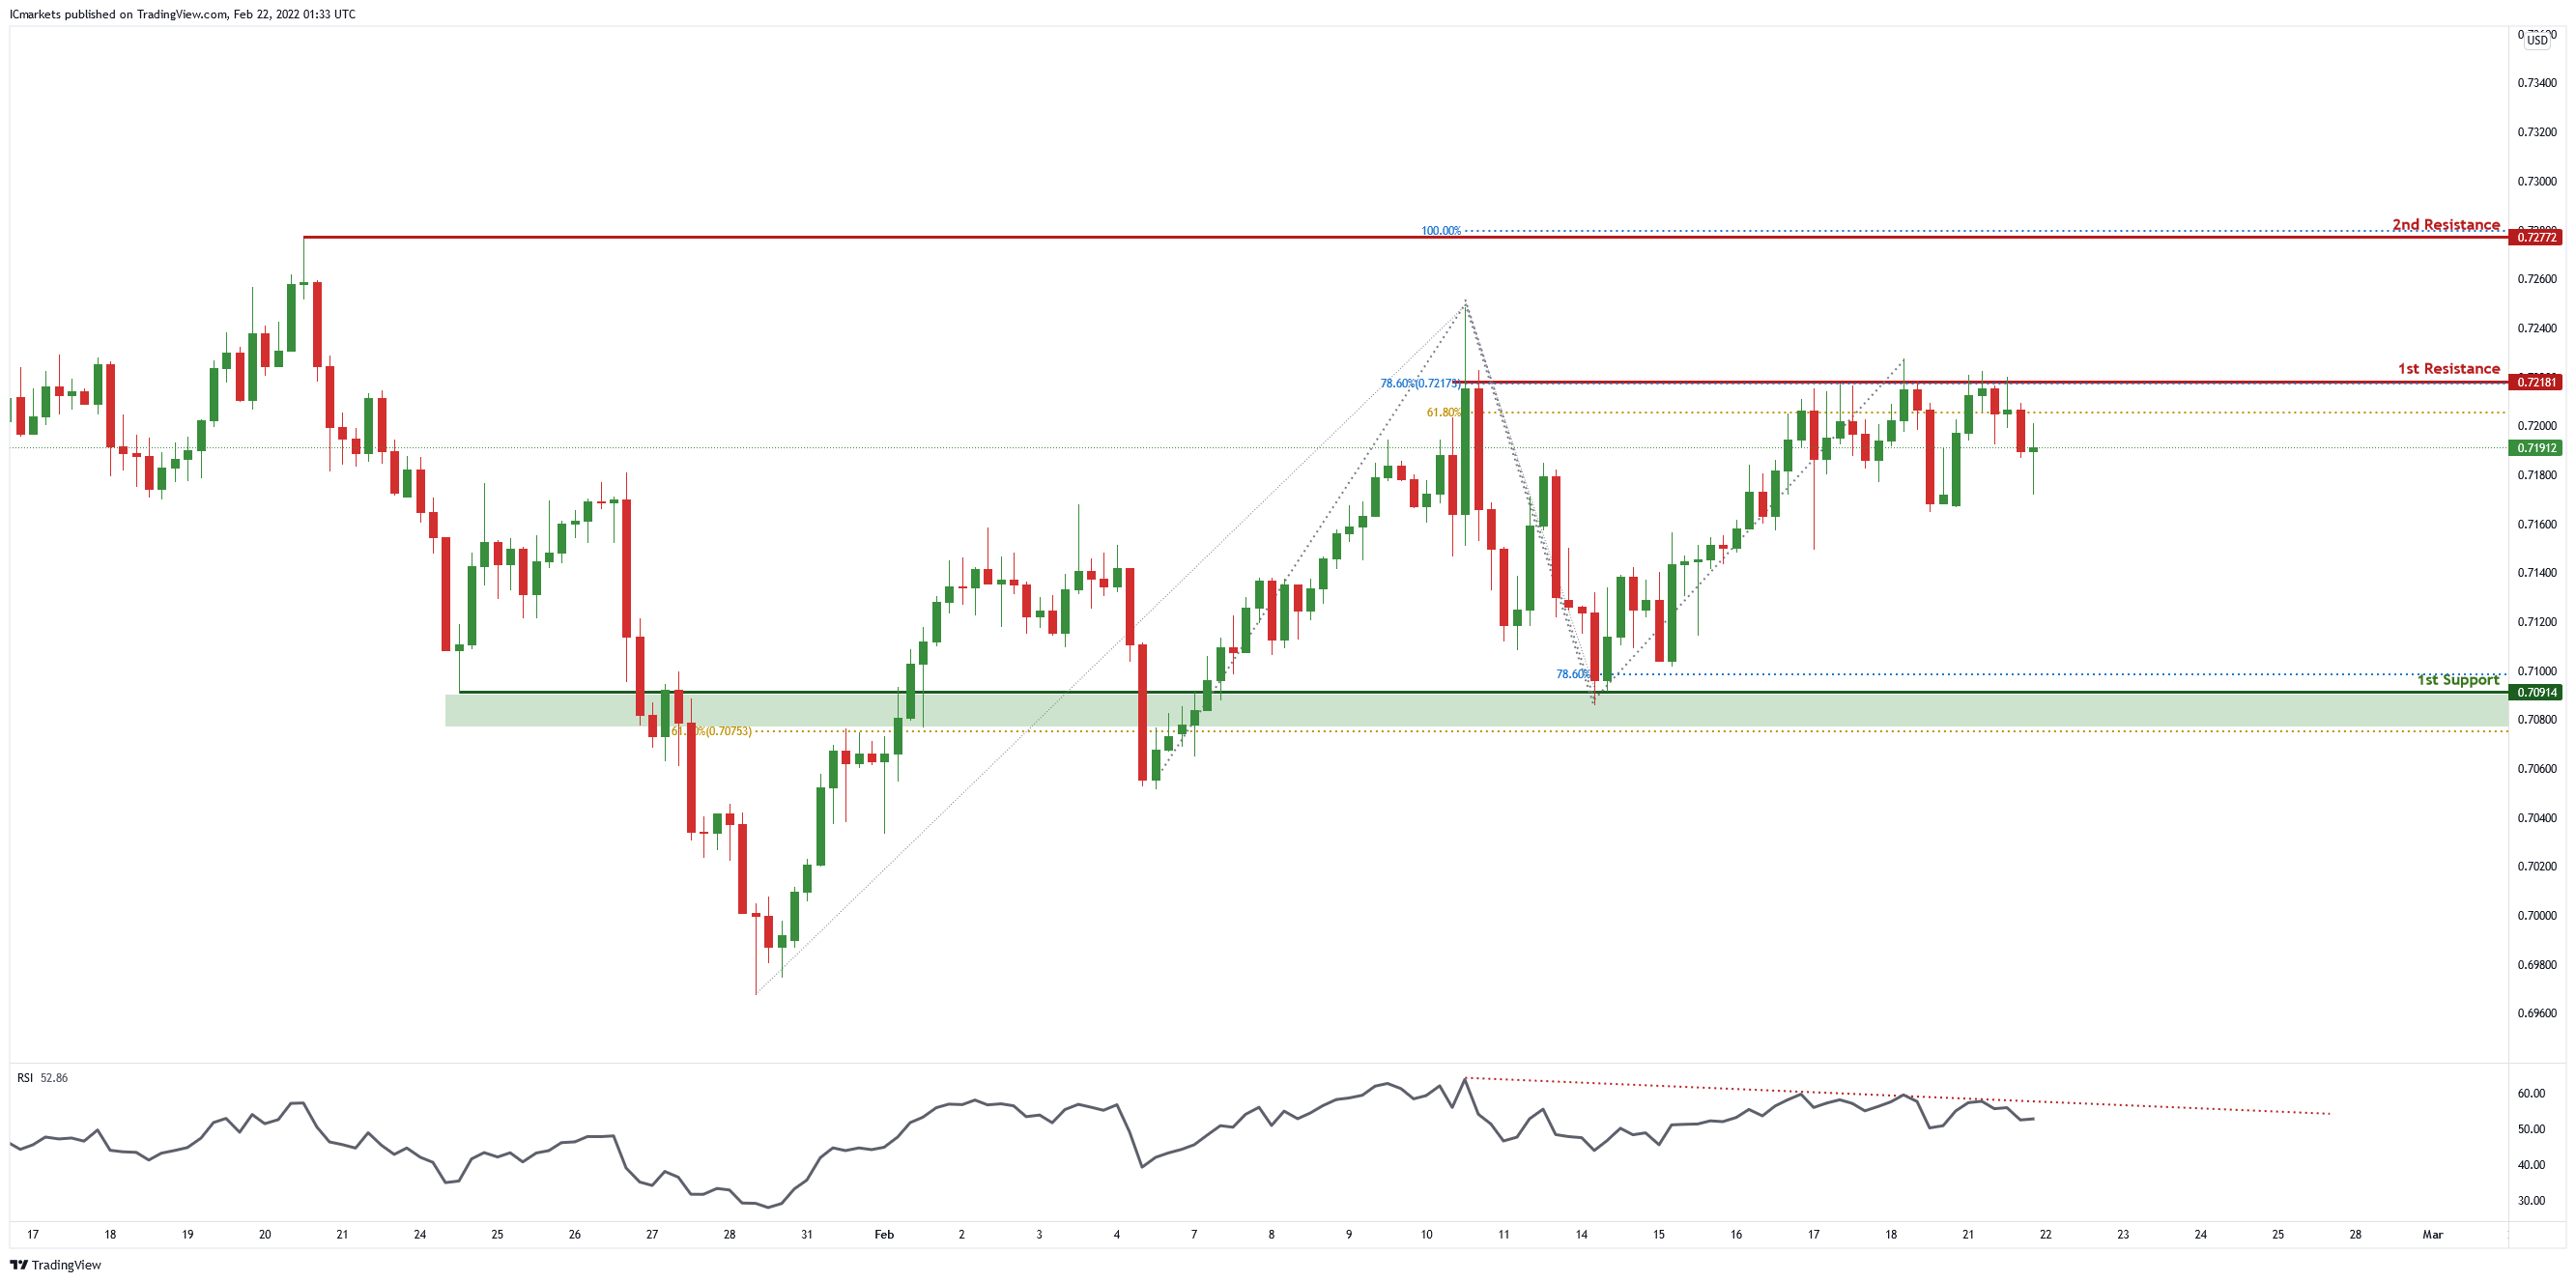
AUD/USD:
On the H4 chart , price is near 1st resistance level of 0.72181 in line with 78.6% Fibonacci projection and 61.8% Fibonacci retracement. Price can potentially dip to the 1st support level of 0.70914 in line with 78.6% Fibonacci projection and 61.8% Fibonacci retracement. Our bearish bias is supported by RSI indicator as it is abiding by a descending trendline
Areas of consideration:
- H4 1st resistance at 0.72181
- H4 1st support at 0.70914
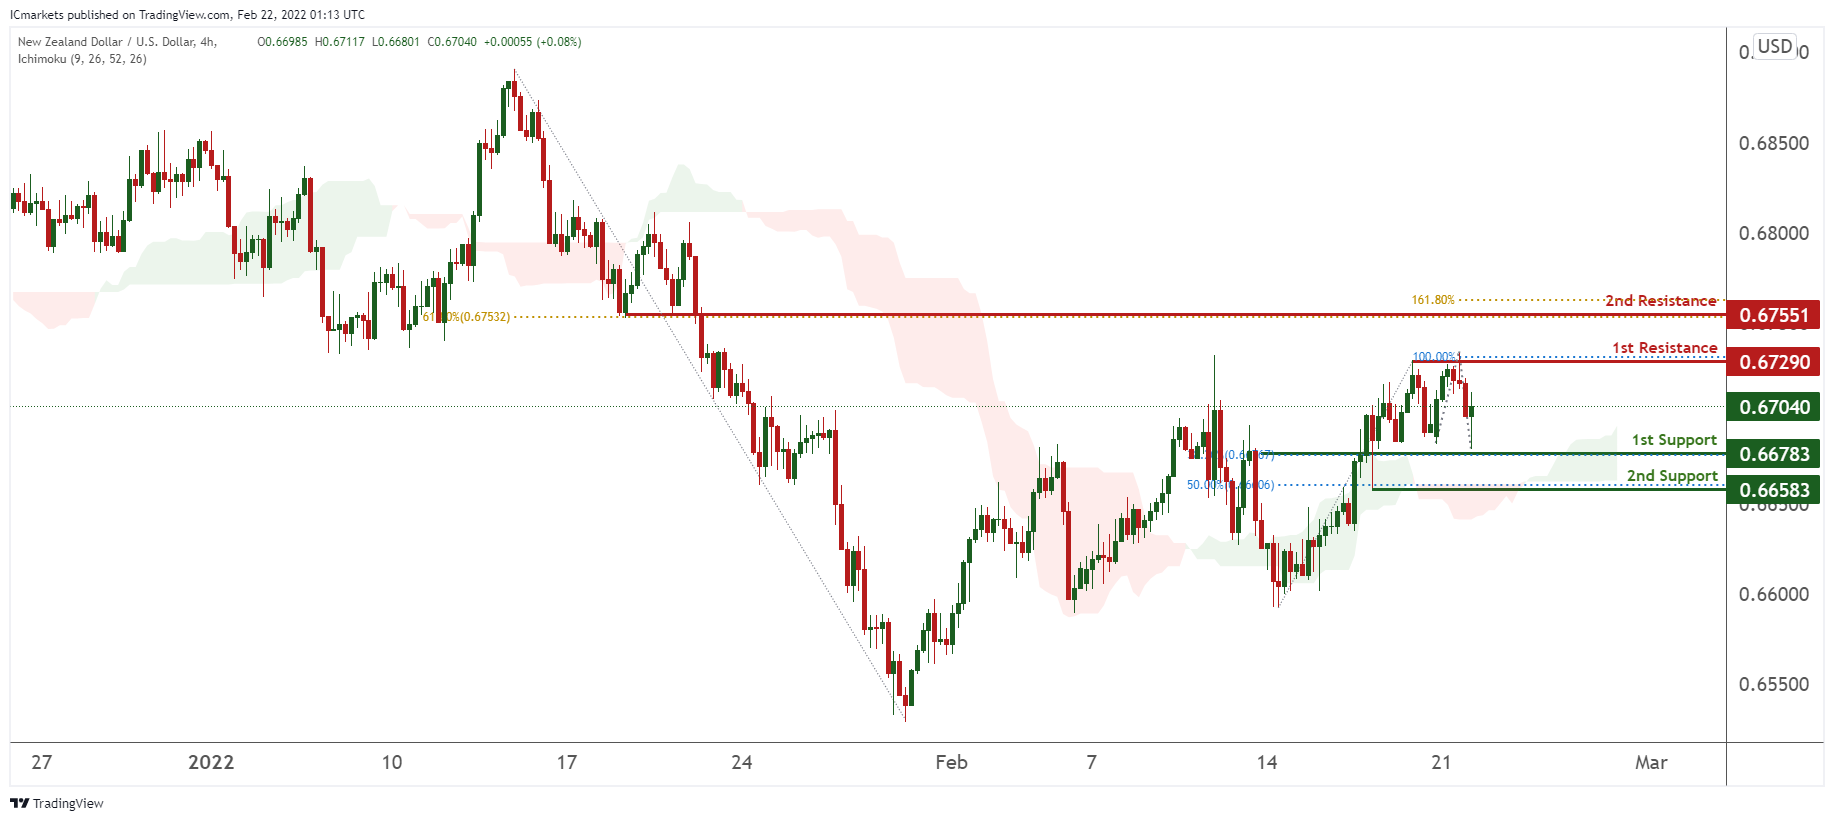
NZD/USD:
On the H4 timeframe, prices are approaching a pivot and are on bullish momentum. We see potential for a bounce from our 1st support at 0.66783 in line with 38.2% Fibonacci retracement towards 1st resistance at 0.67290 in line with 100% Fibonacci extension. Prices are trading above our ichimoku cloud support, further supporting our bullish bias. Alternatively, our stop loss will be placed at 0.66583 in line with 50% Fibonacci retracement.
Areas of consideration:
- H4 time frame, 1st resistance at 0.67290
- H4 time frame, 1st support at 0.66783
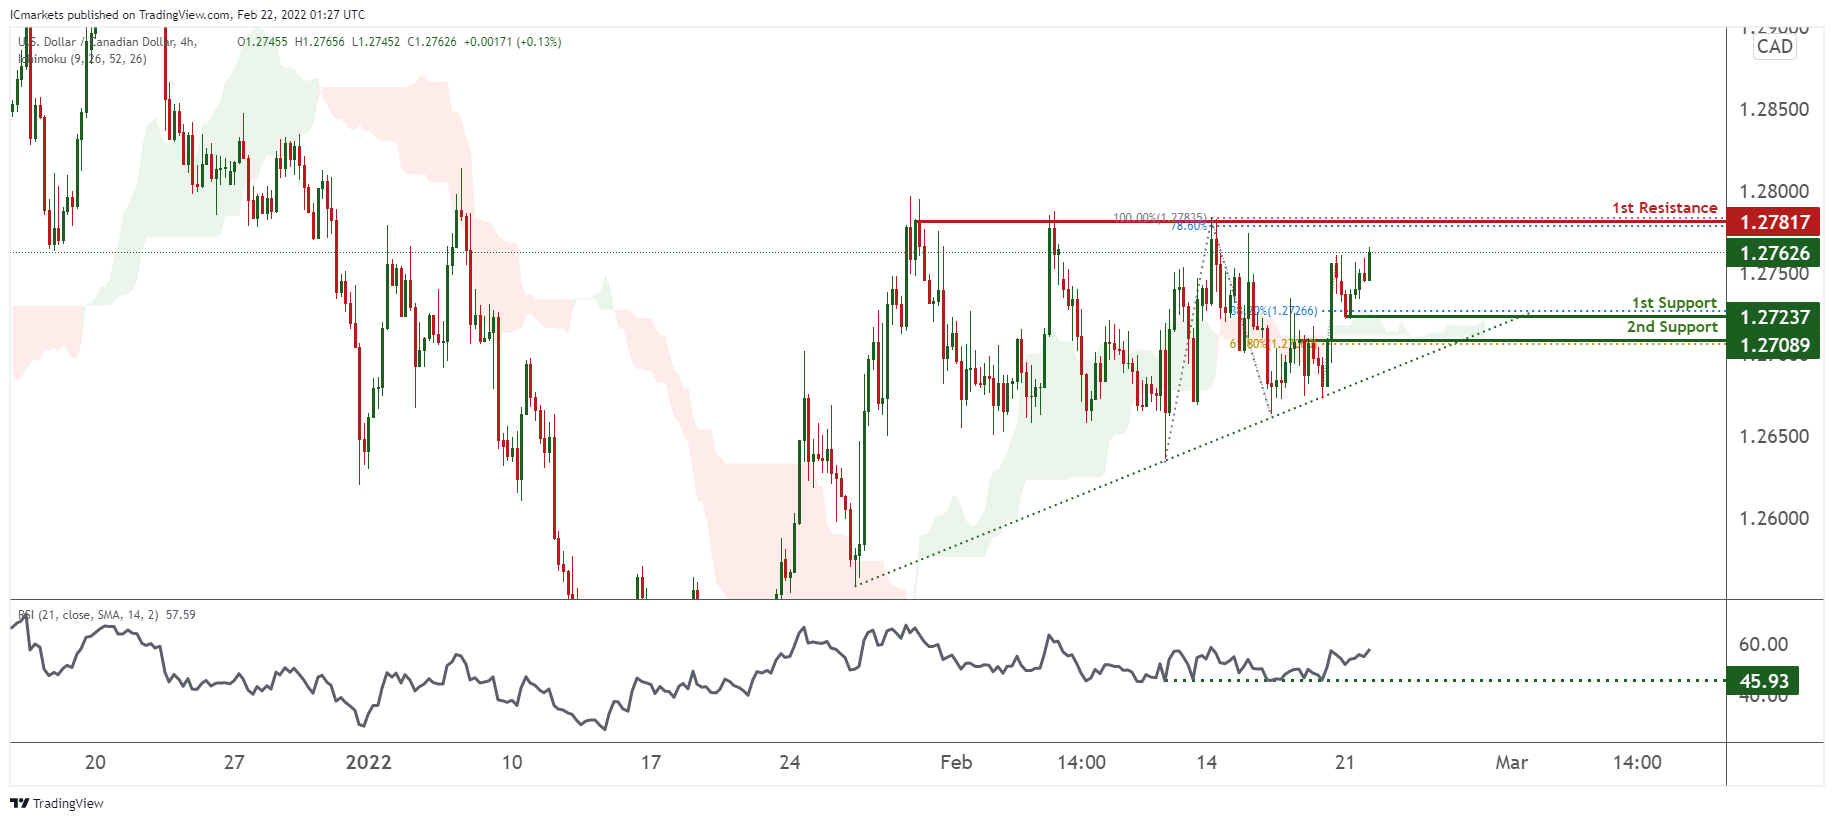
USD/CAD:
On the H4, prices are on bullish momentum and abiding to an ascending trendline. With RSI being at levels where bounces previously occurred, we can expect bullish continuation from our 1st support at 1.27237 in line with 38.2% Fibonacci retracement towards our 1st resistance at 1.27817 which is a strong resistance and in line with 100% Fibonacci retracement and 78.6% Fibonacci extension. Alternatively, price may break 1st support structure and head for 2nd support, which coincides with the ascending trendline and 61.8% Fibonacci retracement at 1.27089.
Areas of consideration:
- H4 time frame, 1st support at 1.27237
- H4 time frame, 1st resistance at 1.27817
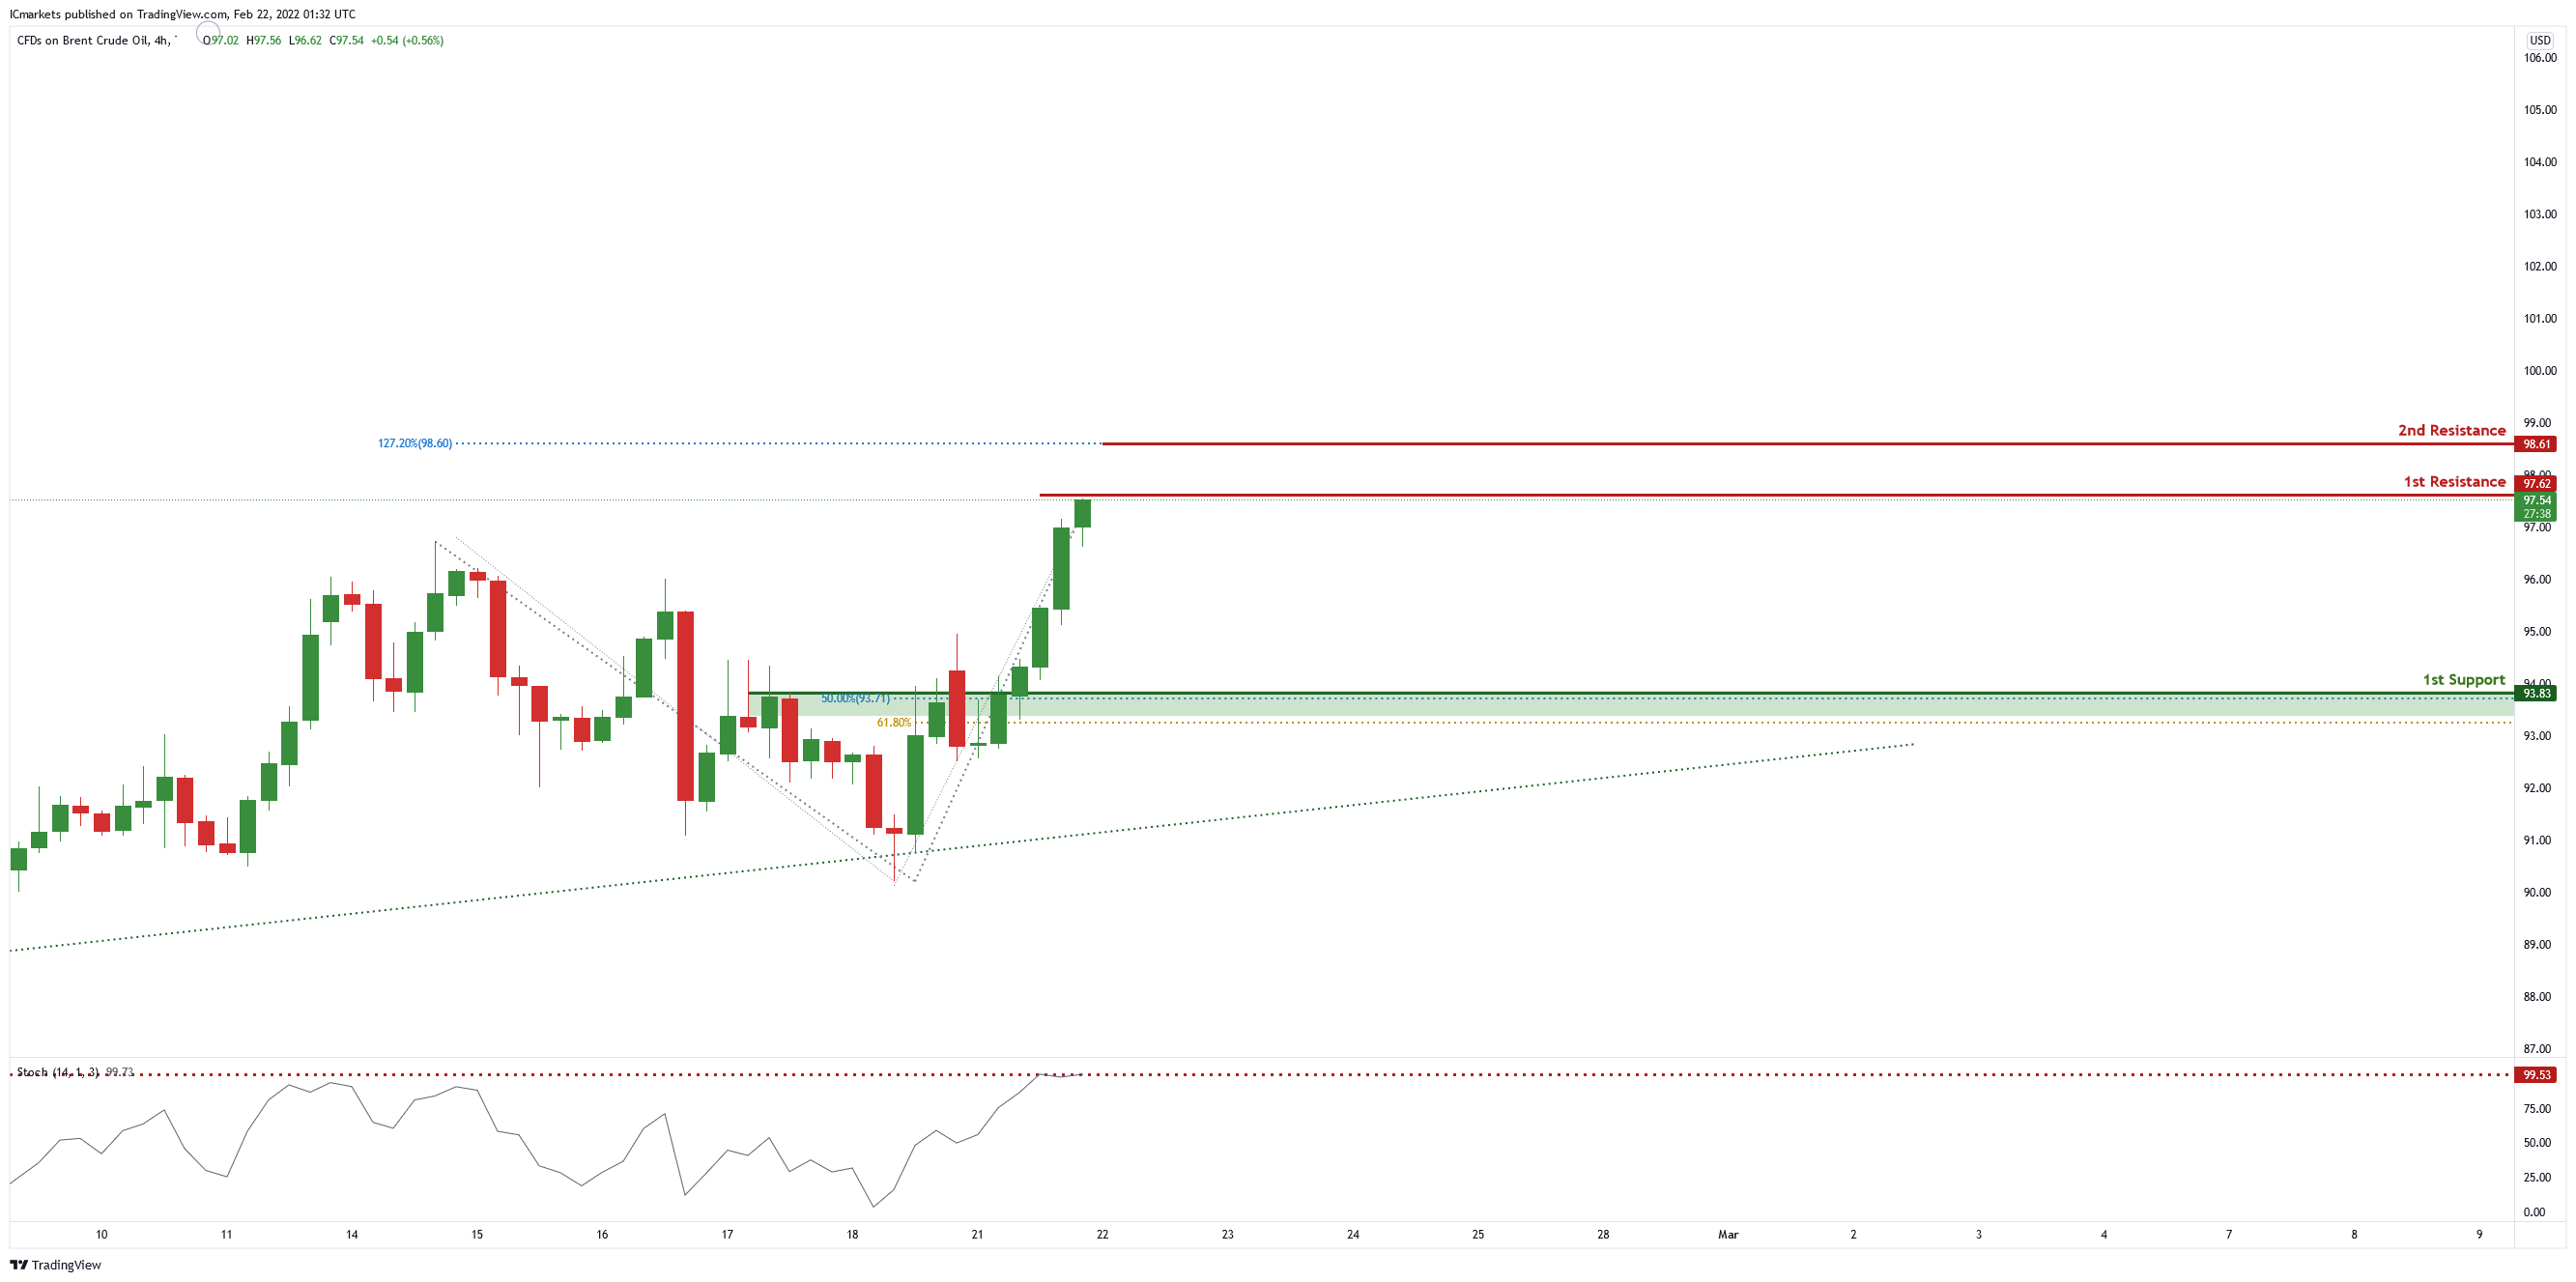
OIL:
On the H4 chart , price is near the 1st resistance level of 97.62 which is also the graphical swing high. Price can potentially dip to the 1st support level of 93.83 in line with 50% Fibonacci retracement and 61.8% Fibonacci projection. Our bearish bias is supported by the stochastic indicator as it is near resistance level.
Areas of consideration:
- H4 time frame, 1st resistance of 97.62
- H4 time frame, 1st support of 93.83
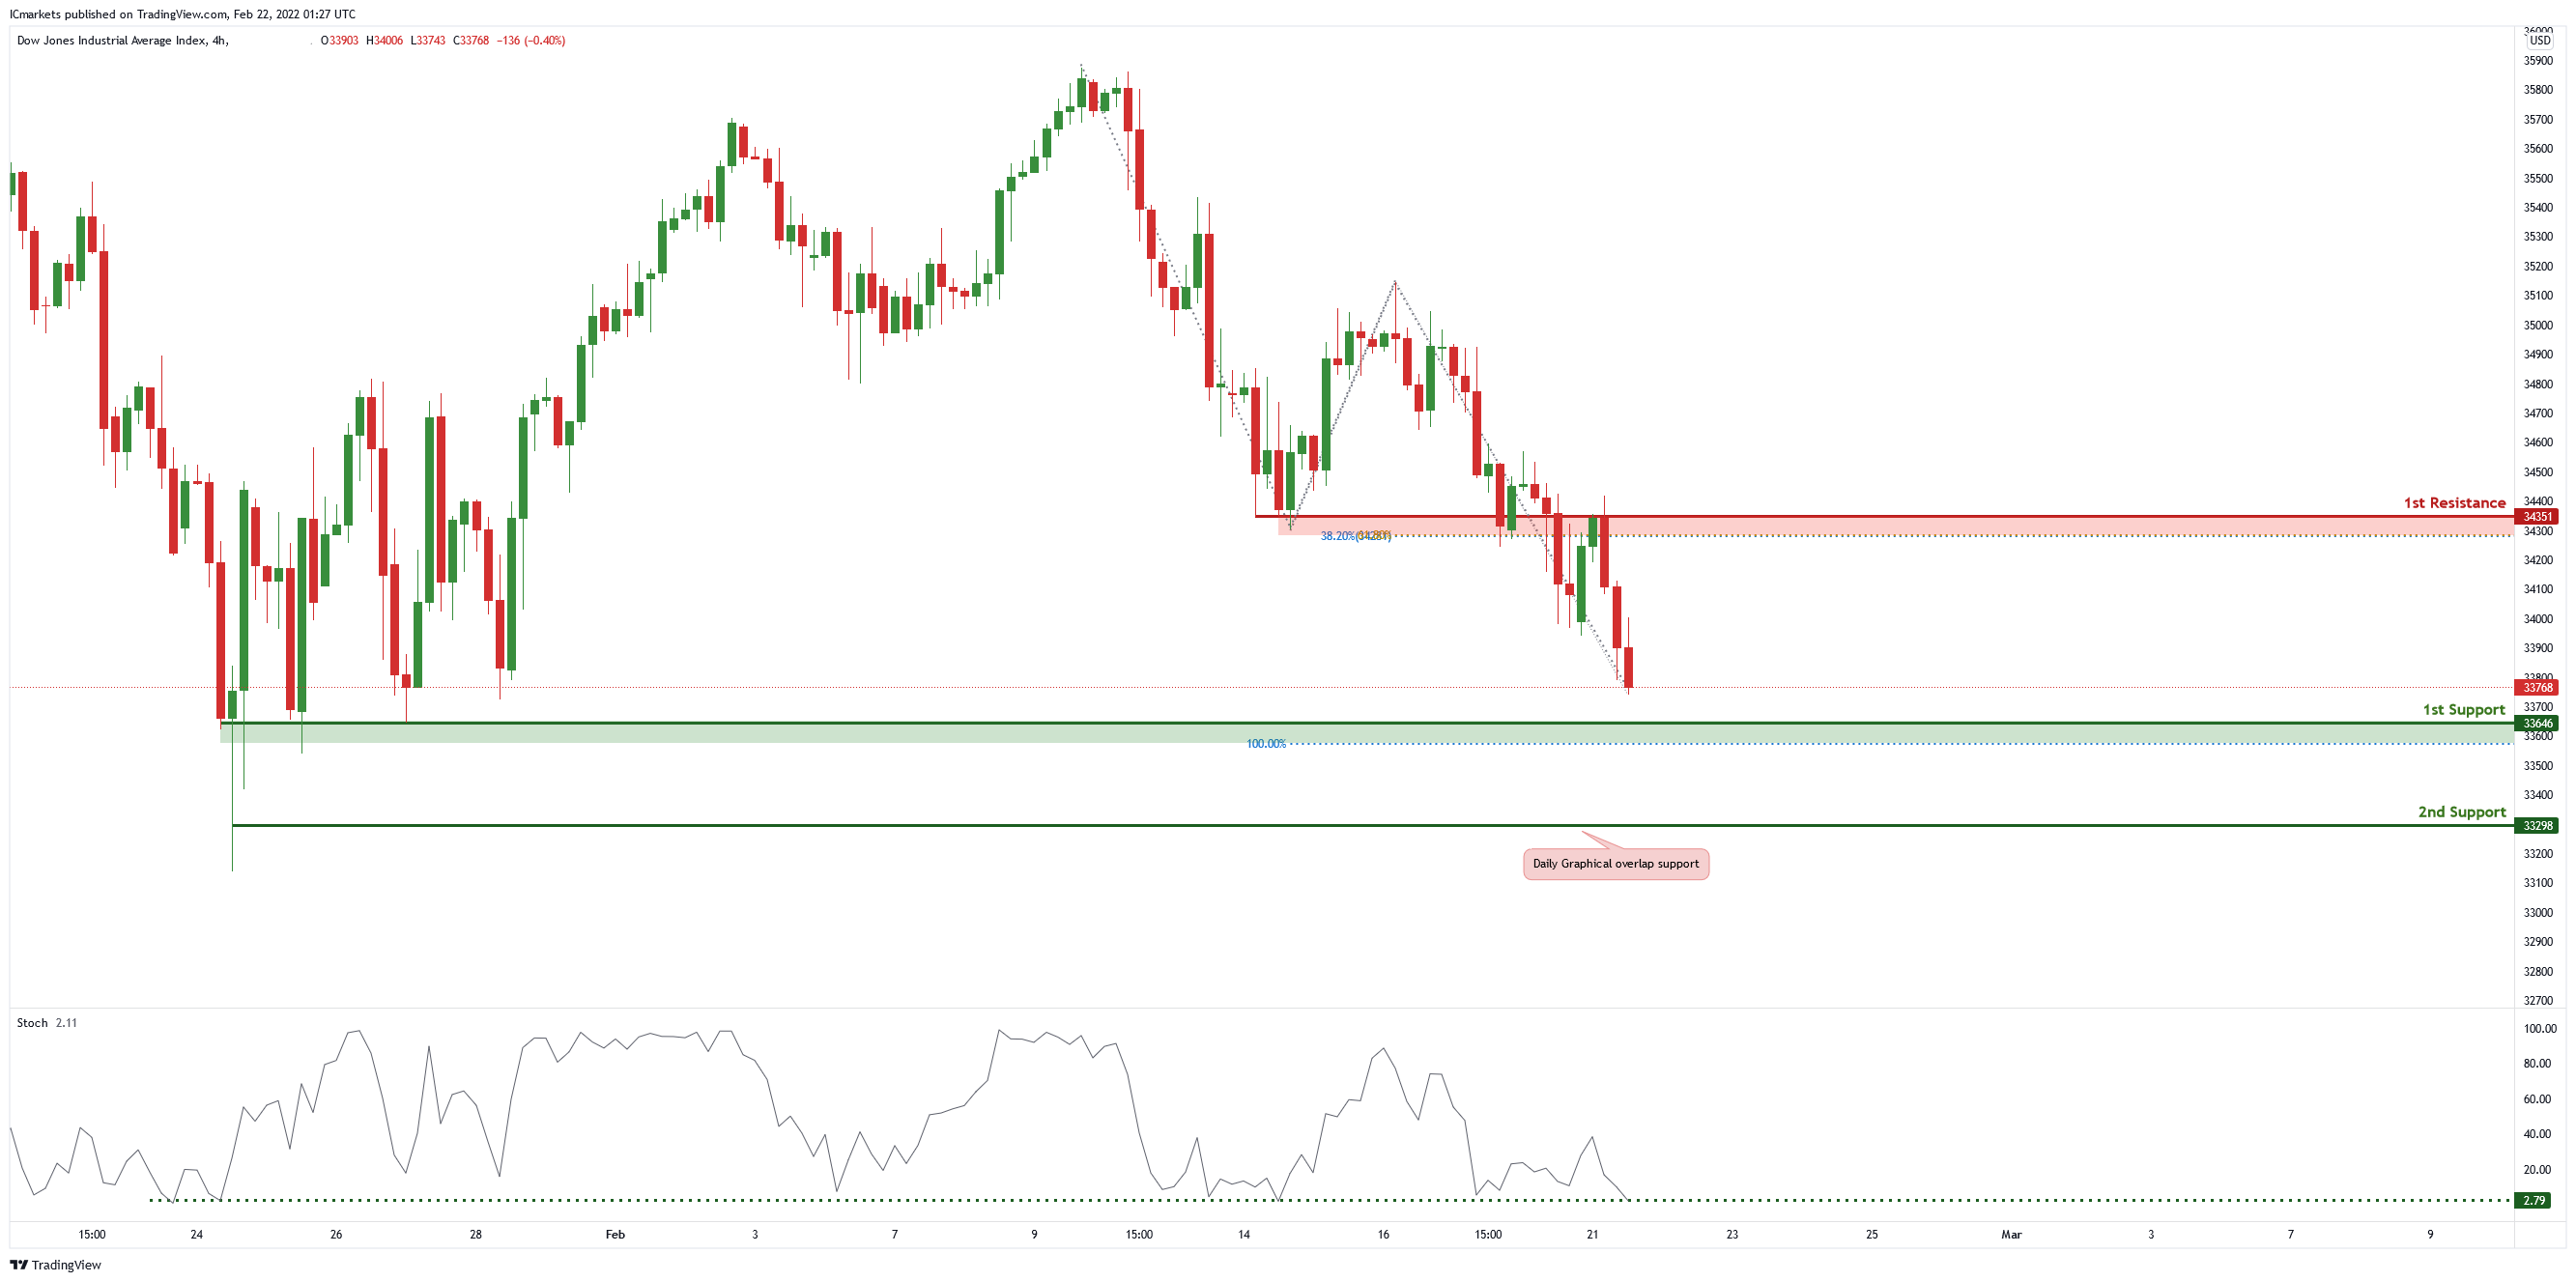
Dow Jones Industrial Average:
On the H4 chart, price is near 1st support level of 33646 in line with 100% Fibonacci projection. Price can potentially bounce from 1st support to 1st resistance level of 34351 in line with 38.2% Fibonacci retracement and 61.8% Fibonacci projection. Our bullish bias is supported by the stochastic indicator as it is at support level.
Areas of consideration :
- H4 1st support at 33646
- H4 1st resistance at 34351


