
DXY:
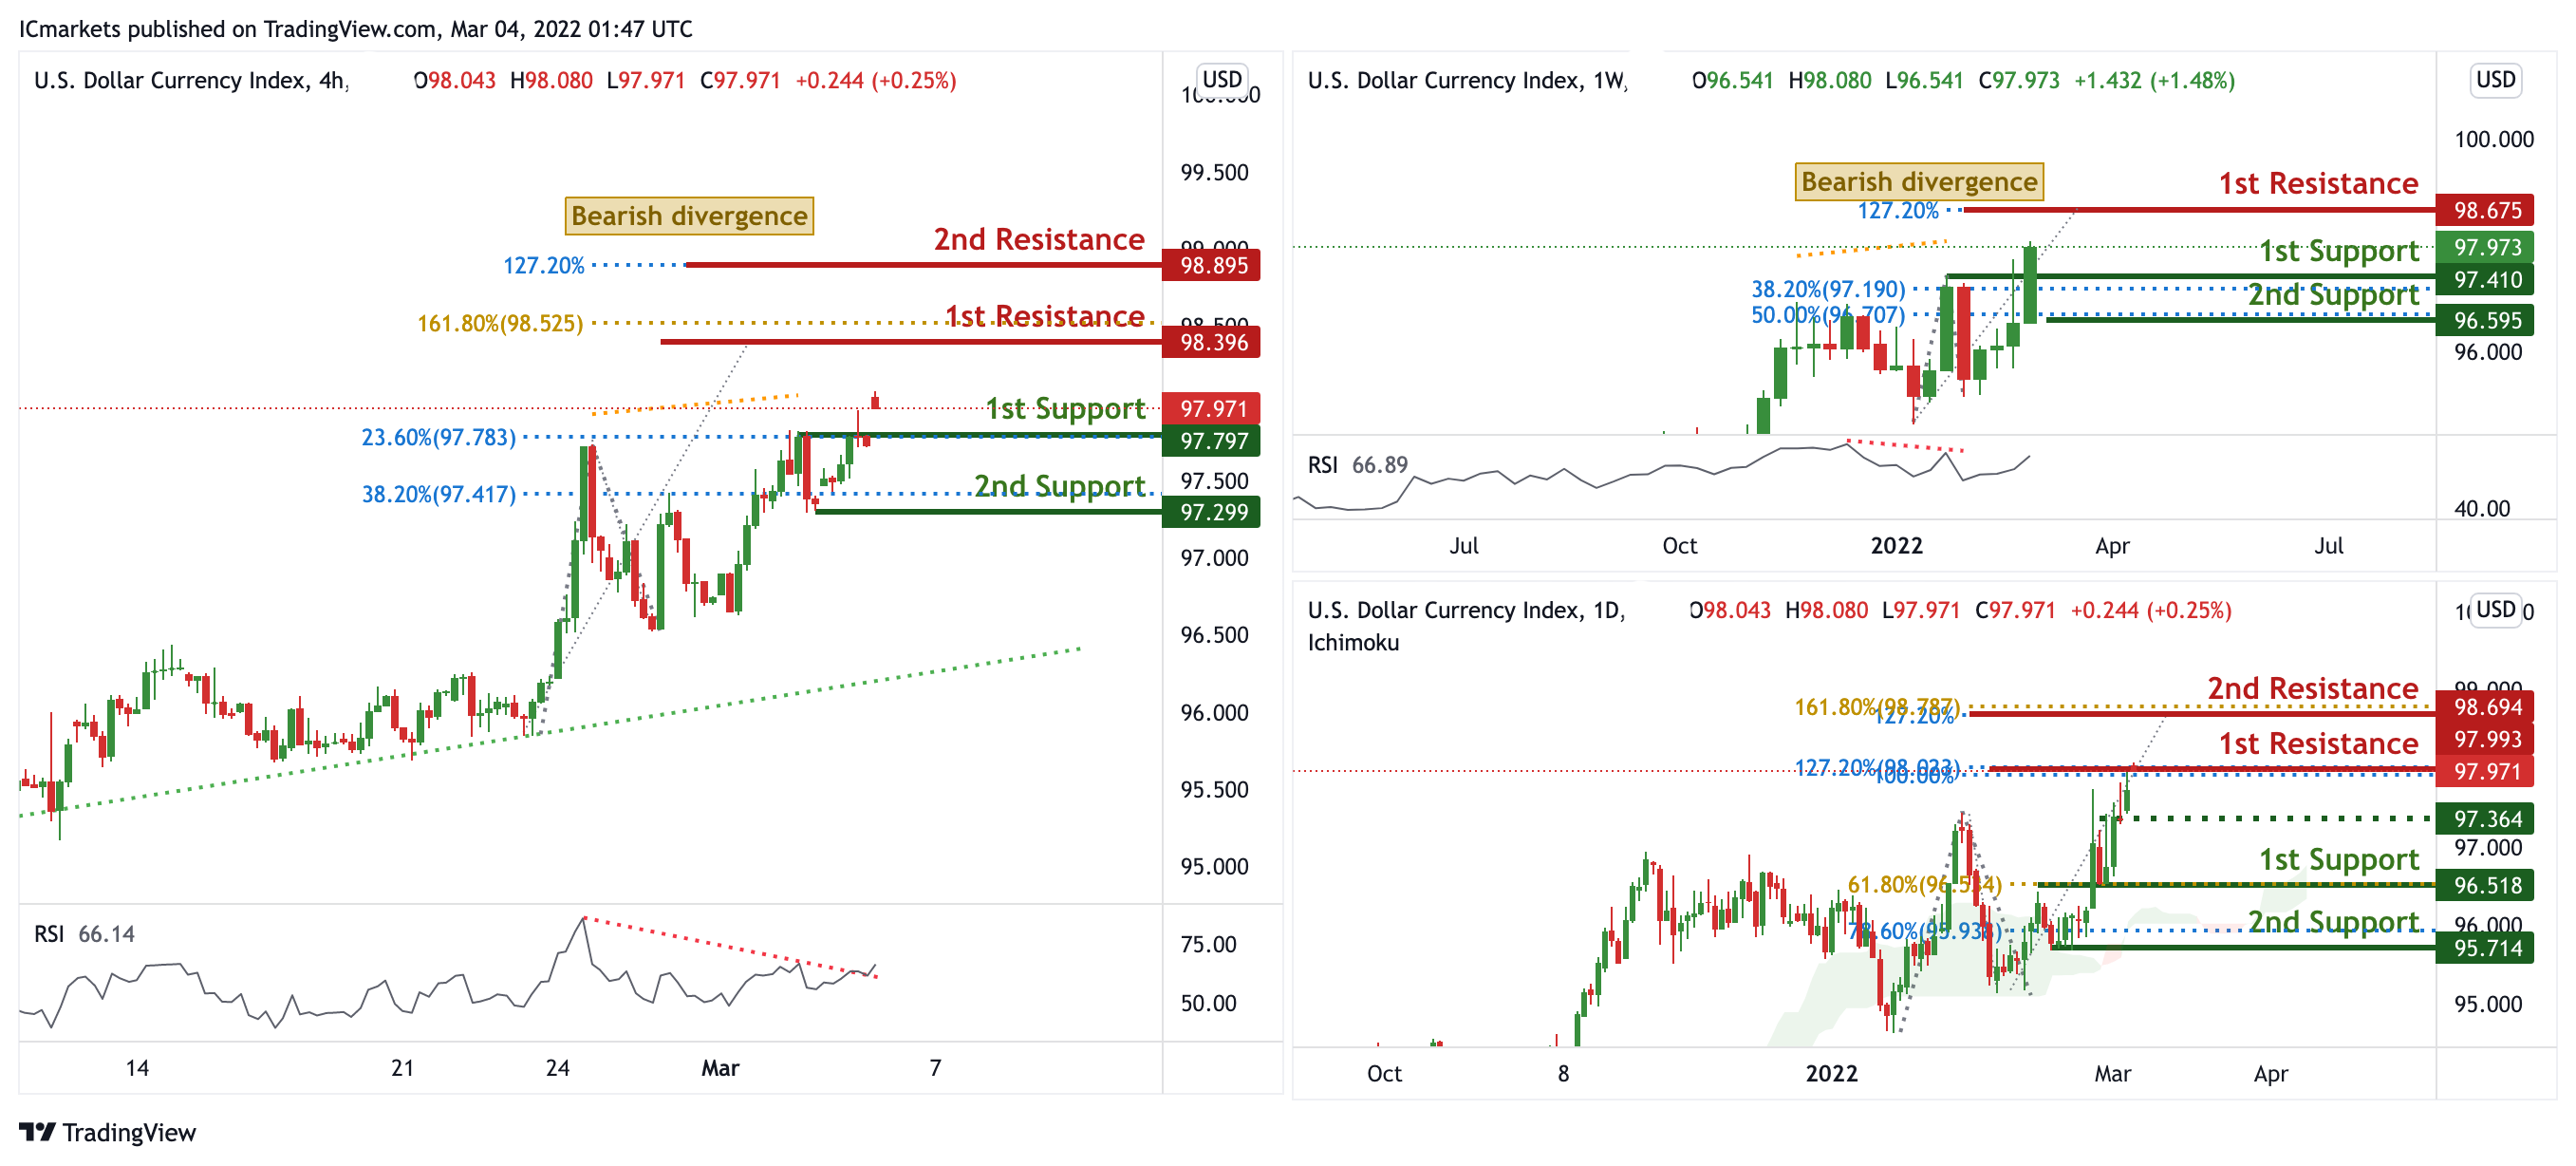
On the weekly, prices are on bullish momentum. We see potential for prices to dip from our 1st resistance at 98.675 in line with 127.2% Fibonacci extension towards our 1st support at 97.410 in line with 38.2% Fibonacci retracement. Divergence is spotted on RSI, further supporting our bearish bias.
On the daily, prices are at a strong resistance. We would watch for our intermediate support for a potential break. A break would result in prices dipping downwards to our 1st support structure at 96.518 in line with 61.8% Fibonacci retracement. Alternatively, prices may travel higher towards our 1st resistance at 97.971 in line with 100% and 127.2% Fibonacci extension.
On the H4 timeframe, prices are abiding to a daily ascending trendline and are at a pivot. We would expect a pullback from our 1st resistance at 98.396 in line with 161.8% Fibonacci projection towards our 1st support at 97.797 in line with 23.6% Fibonacci retracement. RSI is on bearish depicting bearish divergence, further supporting our bearish bias.
Areas of consideration:
- H4 time frame, 1st resistance at 98.396
- H4 time frame, 1st support at 97.797
XAU/USD (GOLD):
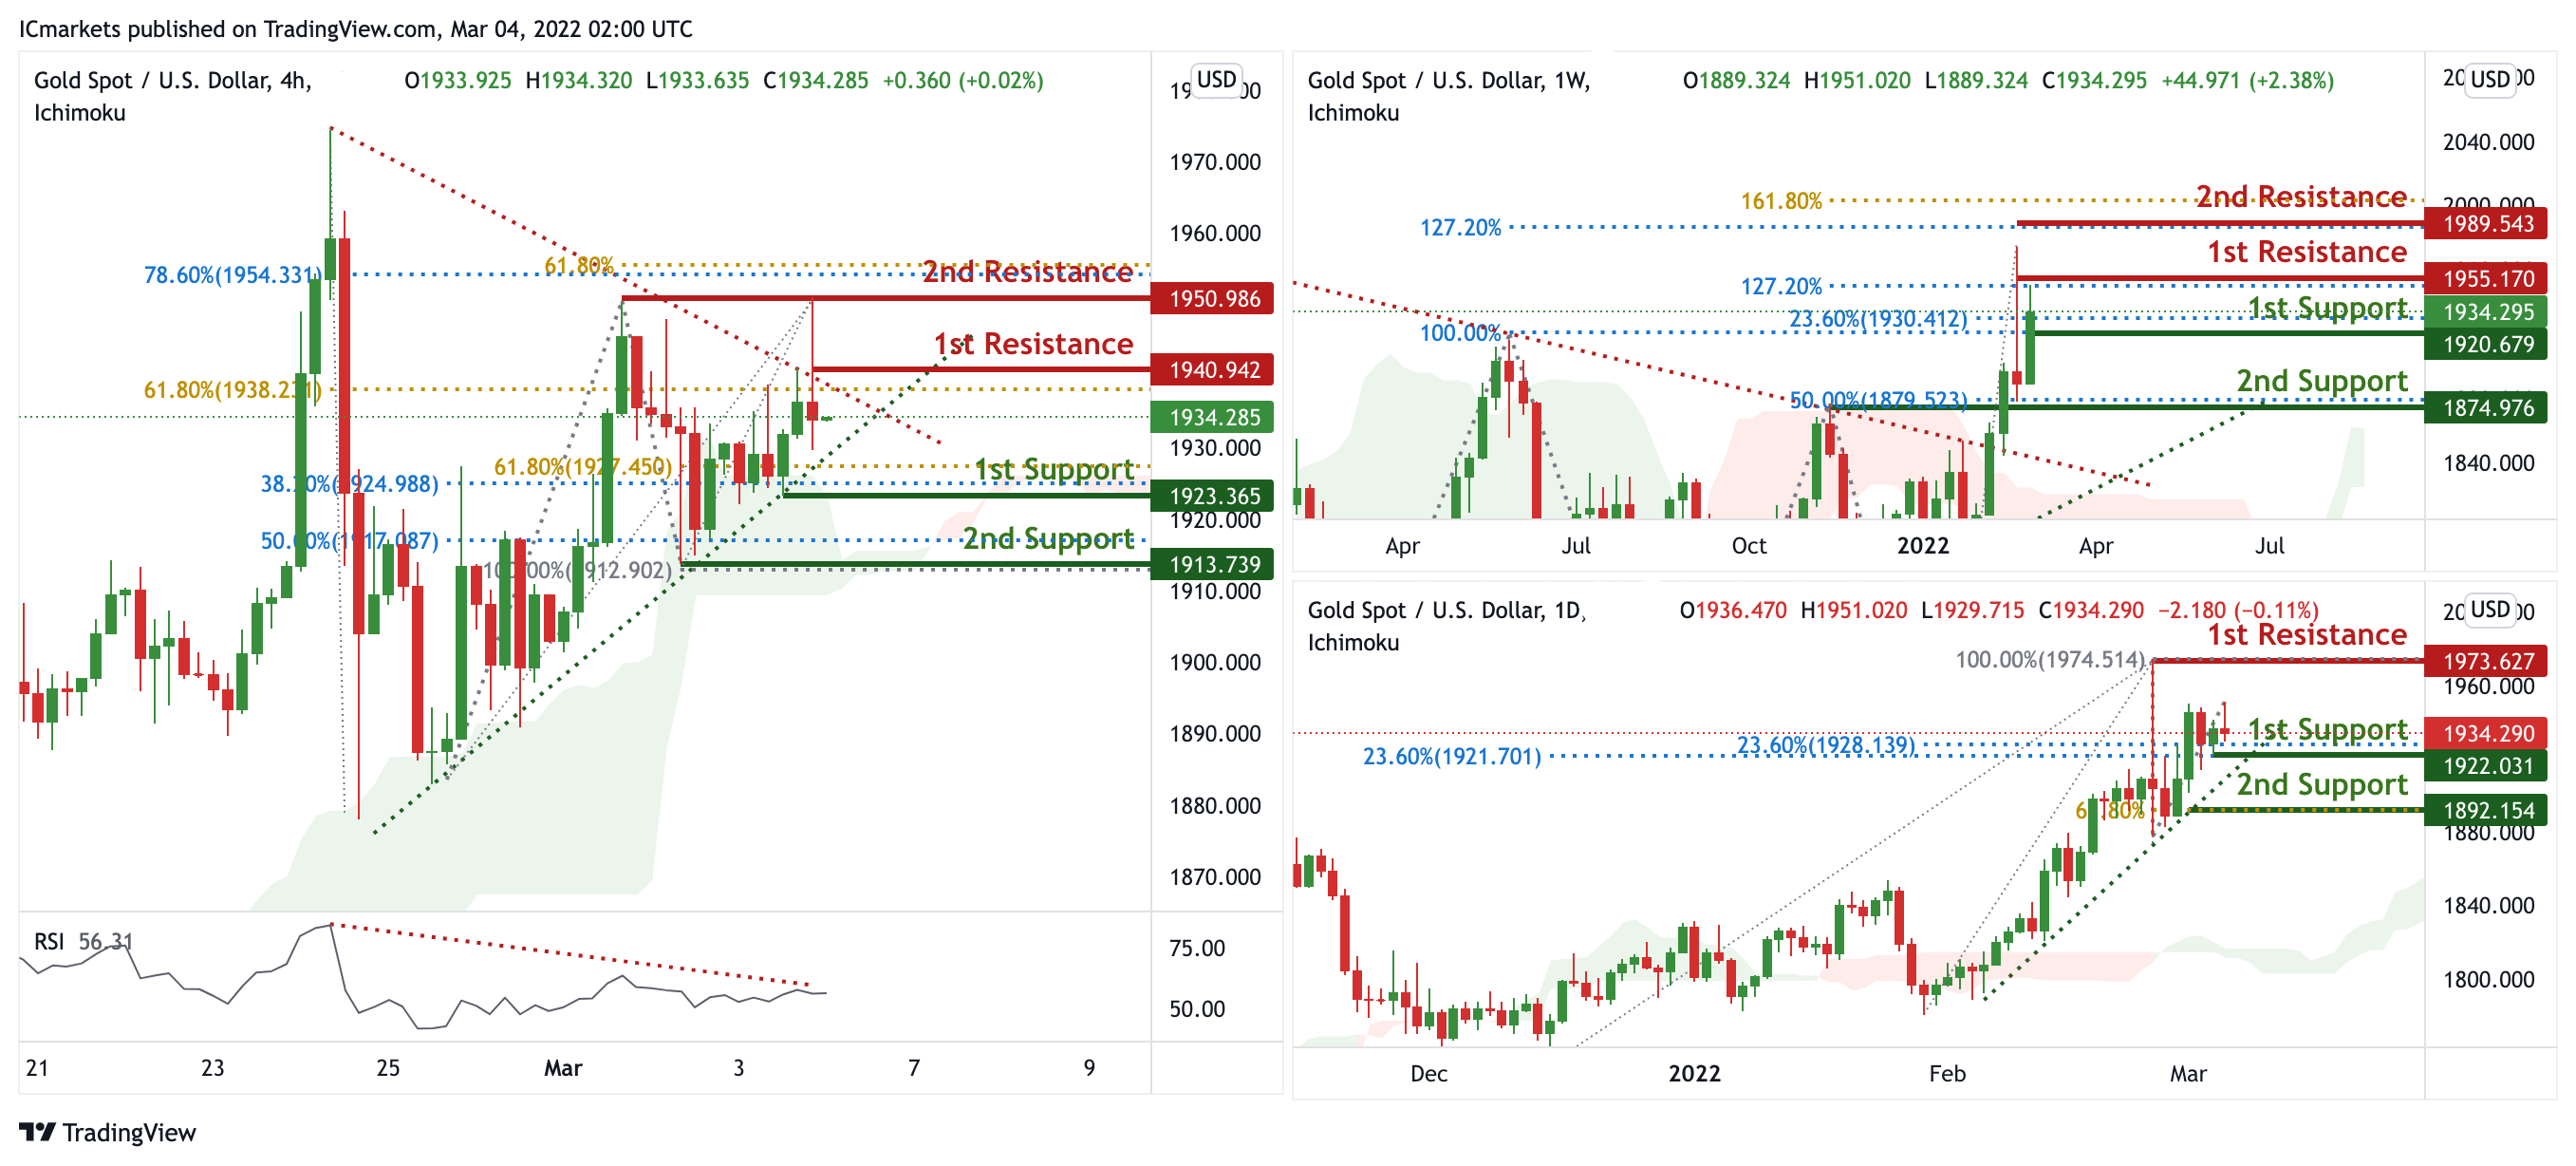
On the weekly, prices have broken out of our triangle and are on bullish momentum. We see the potential for prices to climb further from our 1st support at 1920.679 in line with 23.6% Fibonacci retracement and 100% FIbonacci extension towards our 1st resistance at 1955.170 in line with 127.2% Fibonacci extension. Prices are trading above our ichimoku cloud support, further supporting our bullish bias.
On the daily, prices are on bullish momentum and abiding to our ascending trendline support. We see potential for a bounce from our 1st support at 1922.031 in line with 23.6% Fibonacci retracement and 23.6% Fibonacci retracement towards our 1st resistance at 1973.627 in line with 100% Fibonacci retracement. Prices are trading above our Ichimoku clouds further supporting our bullish bias.
On the H4 chart, prices are consolidating in a triangle pattern. We see potential for prices to dip from our 1st resistance at 1940.942 in line with 61.8% Fibonacci extension towards our 1st support at 1923.365 in line with 38.2% Fibonacci retracement and 61.8% Fibonacci extension. RSI is portraying bearish momentum and ichimoku is forecasting bearish momentum, further supporting our bearish bias.
Areas of consideration:
- 4h 1st support at 1923.365
- 4h 1st resistance at 1913.739
GBP/USD:
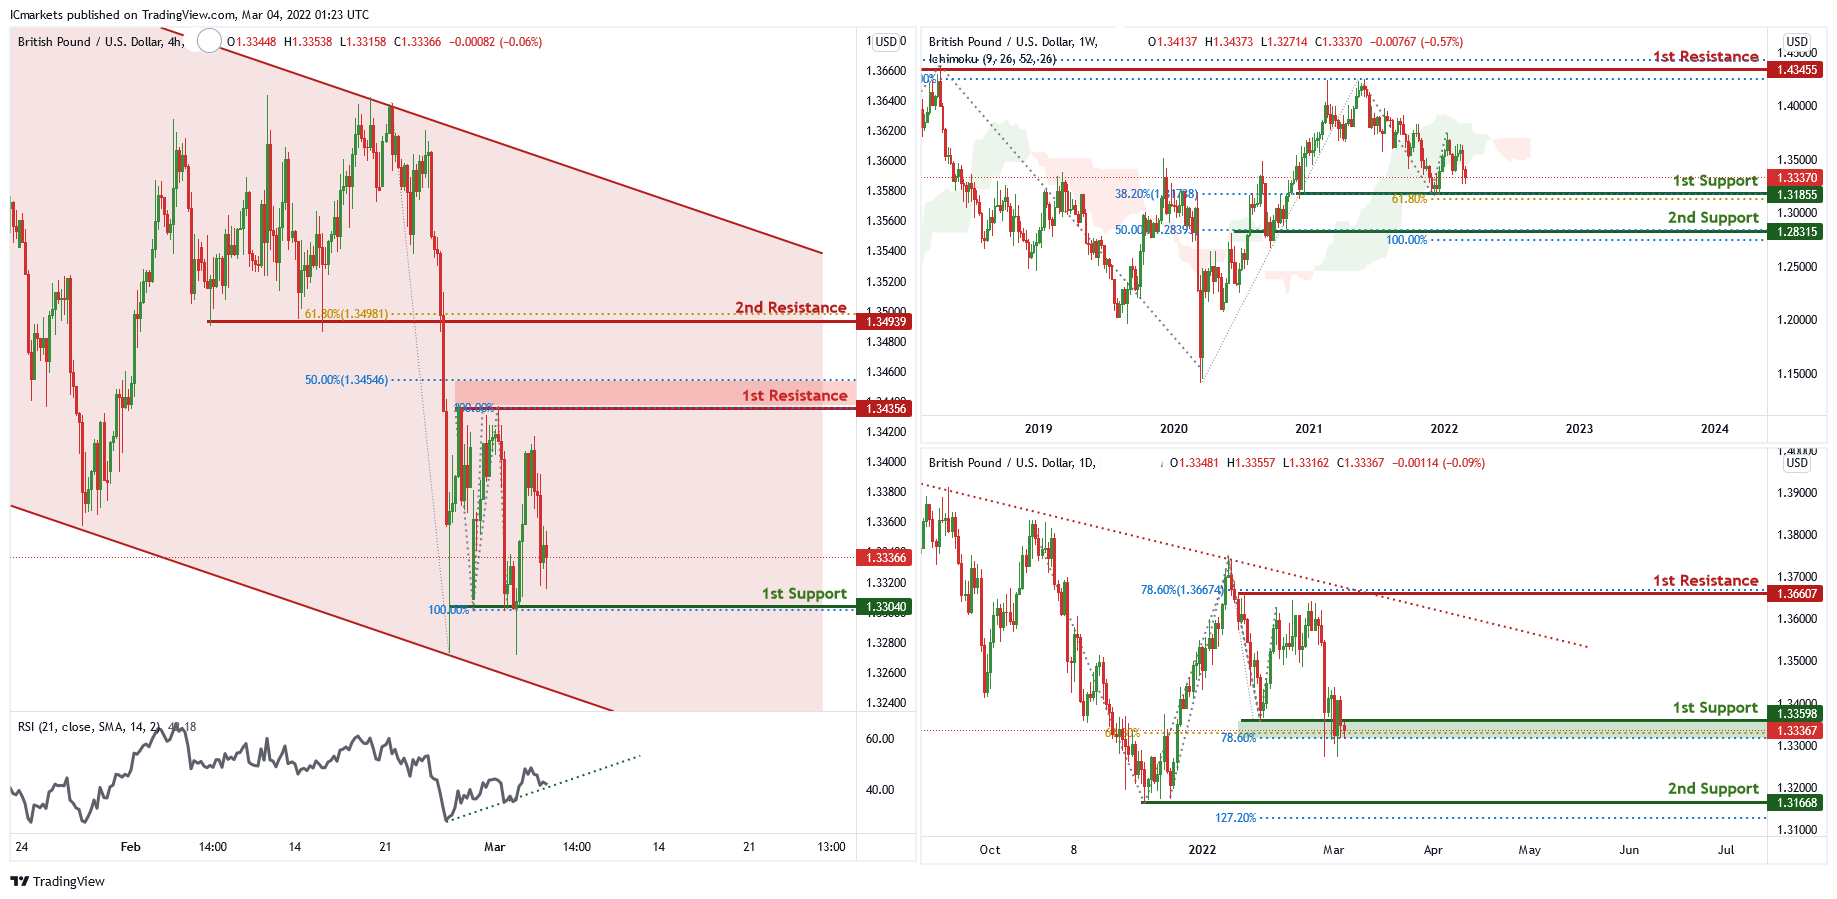
On the weekly chart , price has recently bounced off the 1st support level of 1.31885 which is also 38.2% Fibonacci retracement and 61.8% Fibonacci projection. Price can potentially go to the 1st resistance level of 1.42498 which is also 100% Fibonacci projection and 50% Fibonacci retracement. Our bullish bias is supported by the ichimoku cloud indicator.
On the daily chart , price is abiding by a descending trendline . Price can potentially bounce from the 1st support level of 1.33598 in line with 78.6% Fibonacci retracement and 61.8% Fibonacci projection to the 1st resistance level of 1.36607 in line with 78.6% Fibonacci retracement. Our bullish bias is supported by technical indicators
On the H4 chart, price is trading in a descending channel and near 1st support level of 1.33040 in line with 100% Fibonacci projection. Price can potentially bounce to 1st resistance level of 1.34356 in line with 50% Fibonacci retracement and 100% Fibonacci projection. Our bullish bias is supported by the RSI indicator as it is abiding by an ascending trendline.
Areas of consideration
- H4 1st resistance at 1.34356
- H4 1st support at 1.33040
USD/CHF:
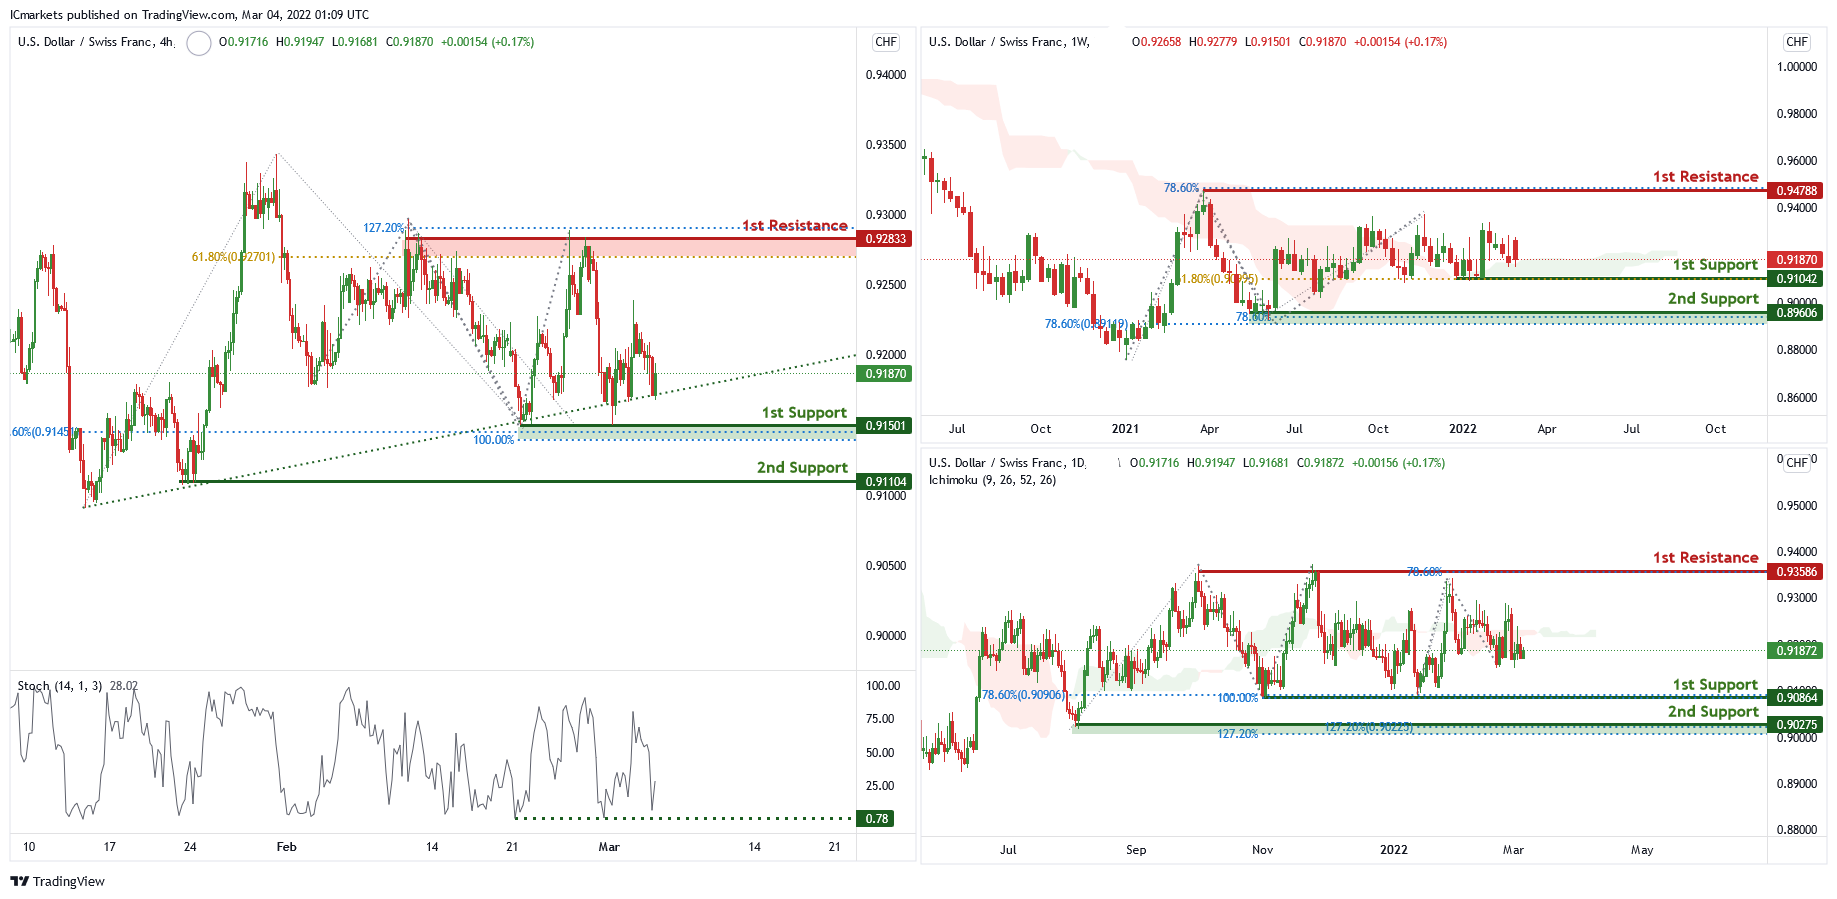
On the weekly chart, price is between 1st support level of 0.91042 in line with 61.8% Fibonacci retracement and 1st resistance level of 0.94788 in line with 78.6% Fibonacci projection. Price can potentially go to the 1st resistance level. Our bullish bias is supported by the ichimoku cloud indicator.
On the daily chart price is between 1st support of 0.90864 in line with 100% Fibonacci projection, 78.6% Fibonacci retracement and 1st resistance level of 0.93586 in line with 78.6% Fibonacci projection. Price can potentially go to the 1st resistance level which is also the graphical swing high level. Our bullish bias is supported by the ichimoku cloud indicator.
On the H4, price is abiding by an ascending trendline and near 1st support level of 0.91501 in line with 78.% Fibonacci retracement and 100% Fibonacci projection. Price can potentially bounce to the 1st resistance level of 0.92251 in line with 61.8% Fibonacci retracement and 127% Fibonacci projection. Our bullish bias is supported by the stochastic indicator as it is at support level.
Areas of consideration
- 1st support level at 0.91501
- 1st resistance level at 0.92833
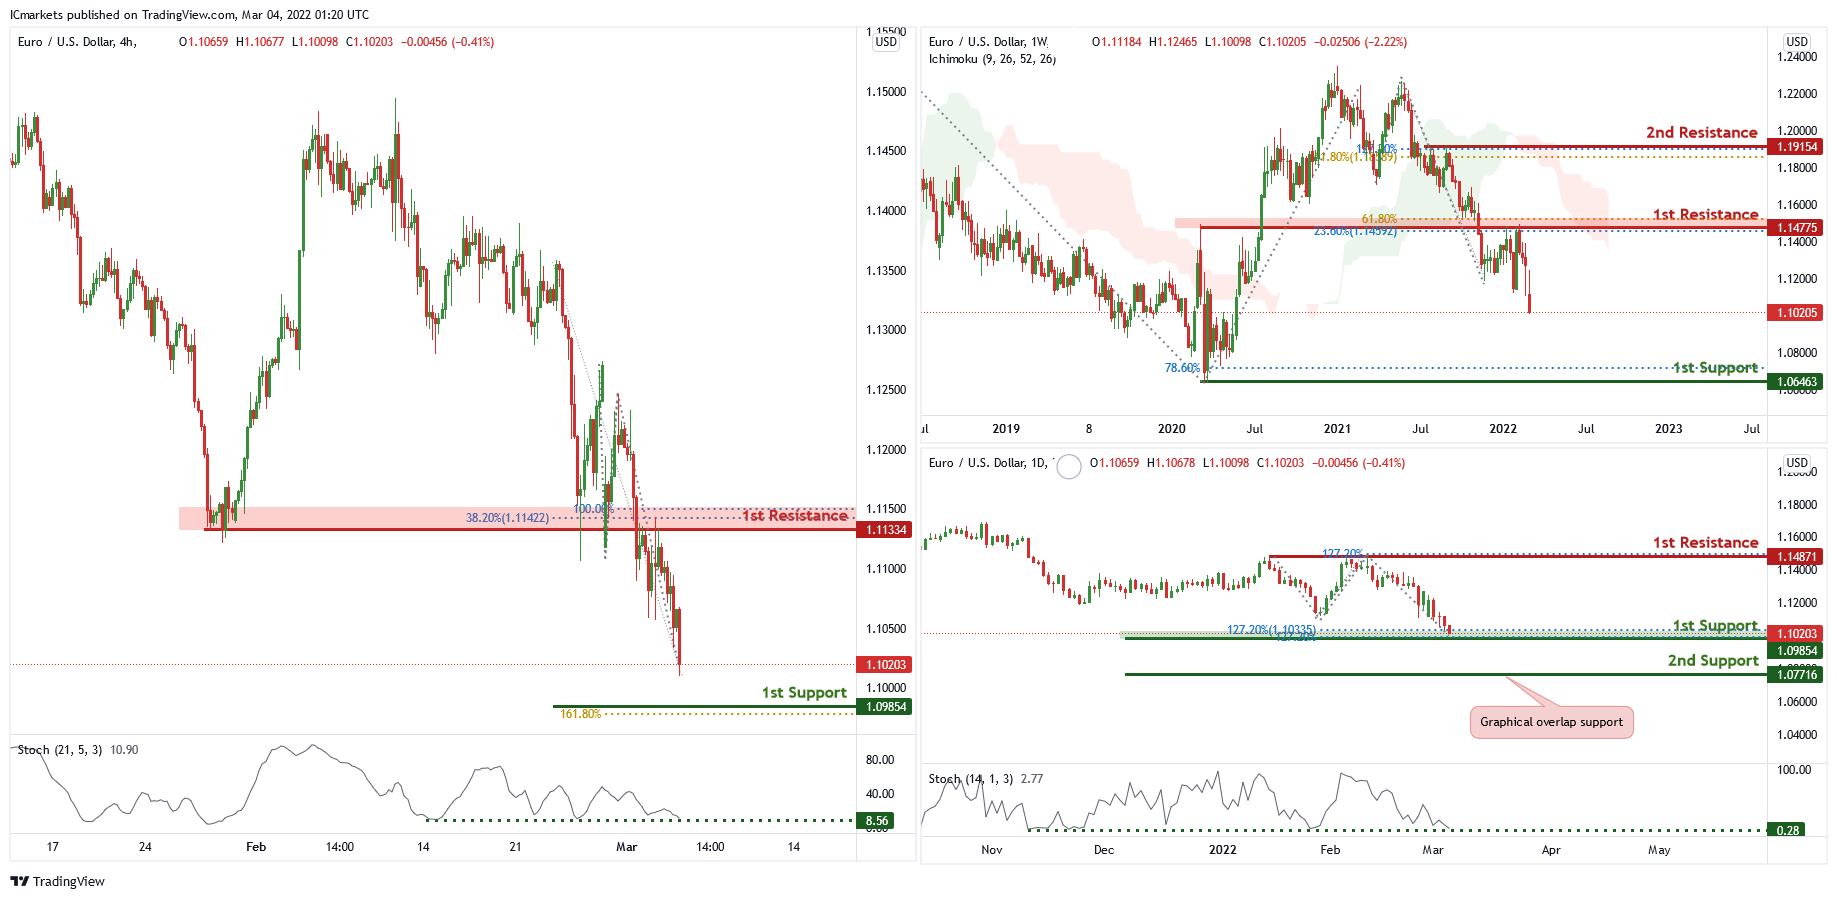
EUR/USD :
On the weekly chart , price is near 1st resistance level of 1.14775 in line with 23.6% Fibonacci retracement and 61.8% Fibonacci projection. Price can potentially dip to the 1st support level of 1.06463 in line with 78.6% Fibonacci projection. Our bearish bias is supported by the ichimoku cloud indicator as price is trading below it.
On the daily chart, price is at 1st support level of 1.09854 in line with 127.2% Fibonacci projection and 127.2% Fibonacci retracement. Price can bounce to the 1st resistance level of 1.14871 in line with 127.2% Fibonacci projection and graphical swing high . Our bullish bias is supported by the stochastic indicator as it is at support level.
On the H4 chart , price is near 1st support level of 1.09854 in line with 161.8% Fibonacci projection and daily graphical support. Price can potentially bounce from 1st support to 1st resistance level of 1.11334 in line with 100% Fibonacci projection and 38.2% Fibonacci retracement. Our bullish bias is supported by the stochastic indicator as it is at support level.
Areas of consideration :
- H4 1st resistance at 1.11334
- H4 1st support at 1.09854
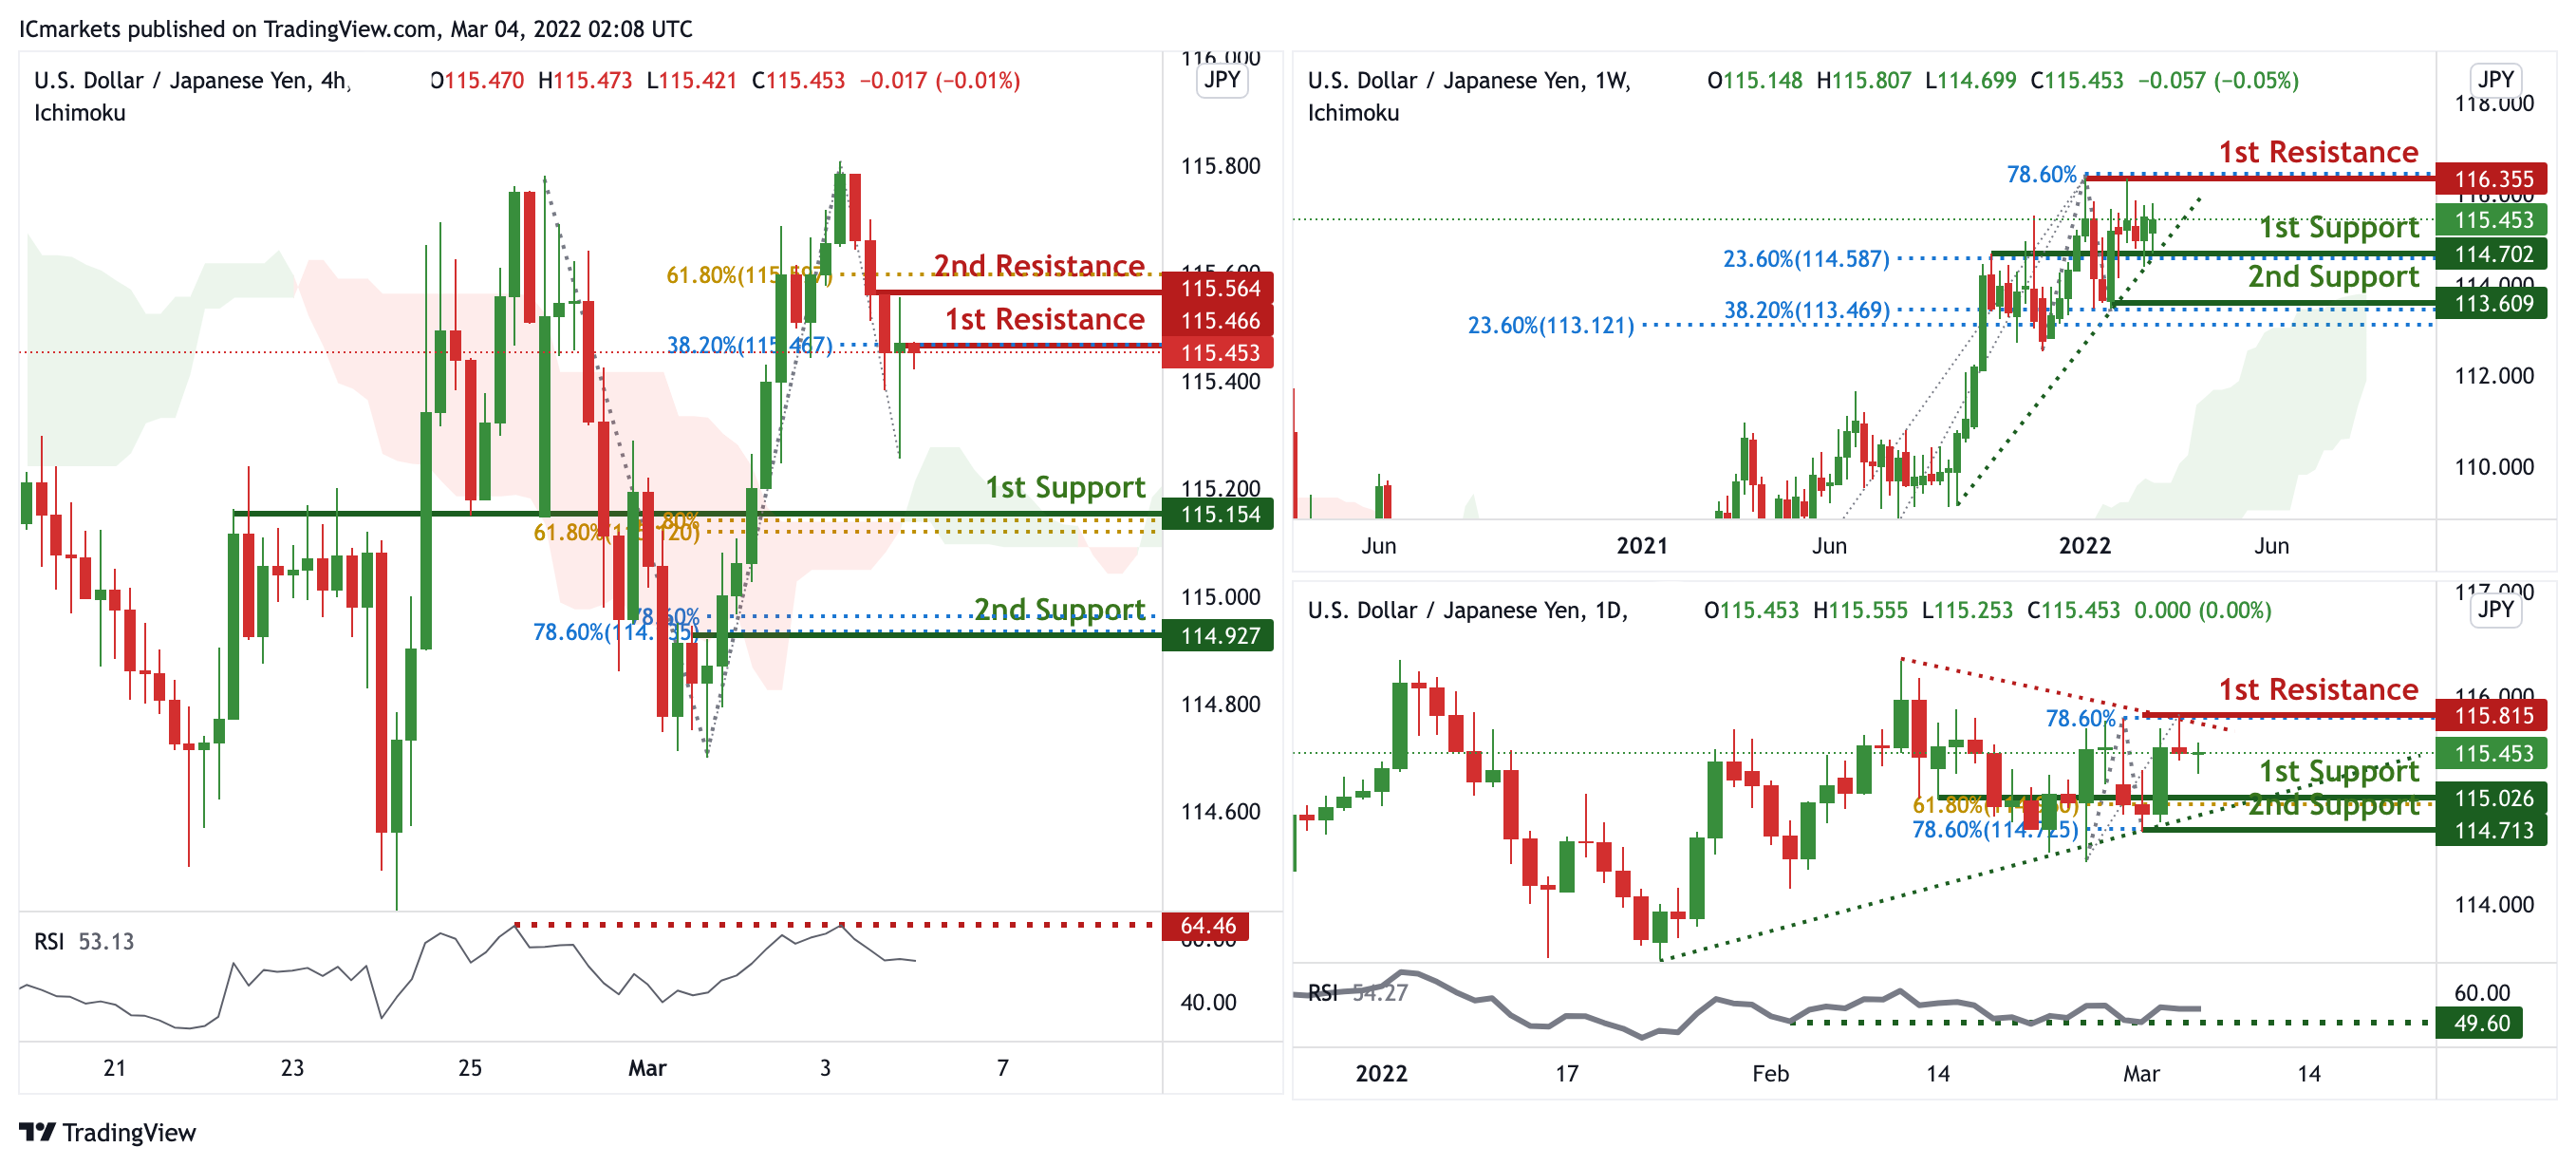
USD/JPY:
On the weekly, prices are on bullish momentum and abiding by an ascending trendline. We see the potential for further bullish continuation from our 1st support at 114.702 in line with 61.8% Fibonacci retracement towards our 1st resistance at 116.355 in line with 78.6% Fibonacci retracement. Prices are trading above our ichimoku cloudsm further supporting our bullish bias. On the daily, prices are consolidating in a triangle pattern. We see the potential for further bullish continuation from our 1st support at 115.026 in line with 61.8% Fibonacci retracement towards our 1st resistance at 115.815 in line with 78.6% Fibonacci extension. RSI is at levels where bounces previously occurred. On the H4 timeframe, prices are forming a potential double top. We see the potential for further bearish momentum from our 1st resistance at 115.466 in line with 38.2% Fibonacci retracement towards our 1st support at 115.154 which is in line with 61.8% Fibonacci retracement and 61.8% Fibonacci extension. Our bearish bias is RSI being at levels where dips occurred previously..
Areas of consideration:
- H4 time frame, 1st resistance at 115.605
- H4 time frame, 1st support at 115.157
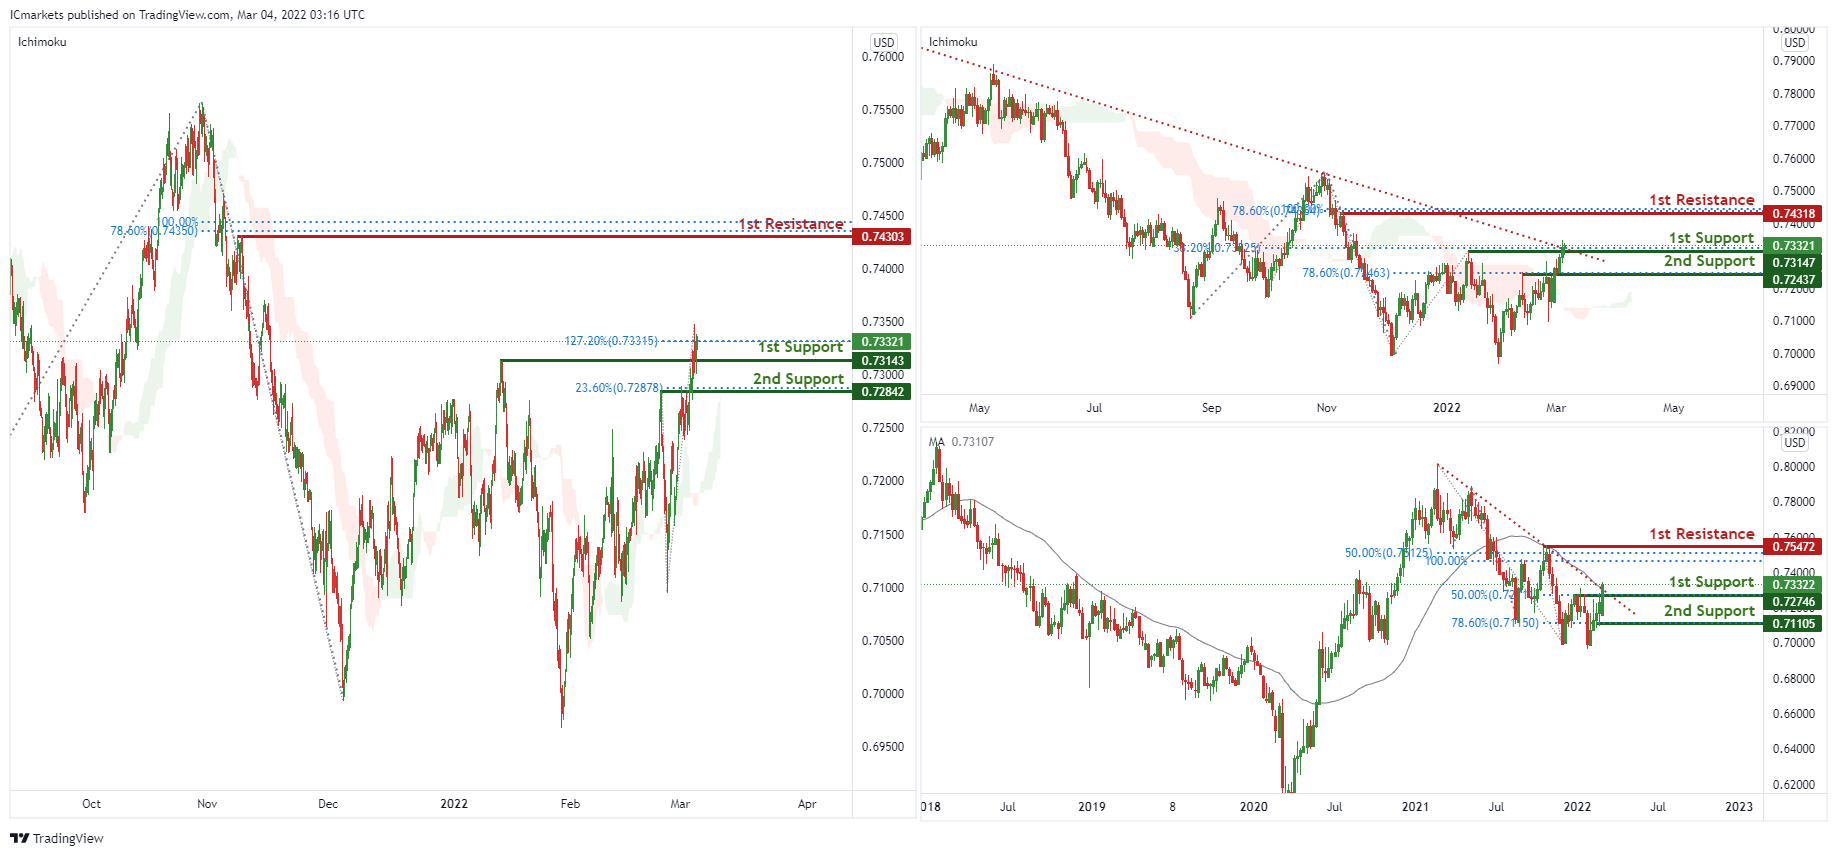
AUD/USD:
On the H4 chart, prices are consolidating in a parallel channel. We see potential for bearish dip from our 1st resistance at 0.73091 in line with 100% Fibonacci retracement and towards our 1st support at 0.73072 which is in line with 23.6% Fibonacci retracement and 38.2% Fibonacci retracement. Alternatively, price can potentially climb higher to the 2nd resistance level at 0.73496 in line with 127.2% Fibonacci projection. Our bearish bias is further supported by bearish divergence spotted on RSI.
On the weekly, prices are on bullish momentum as prices have already broken out of the descending trendline. We see the potential for further bullish continuation from our 1st support at 0.72746 in line with 50% Fibonacci retracement towards our 1st resistance at 0.75472 in line with 50% Fibonacci retracement. Our bullish bias is supported by prices trading above our moving average indicator.
On the daily, prices have broken out of the descending trendline. We see the potential for further bullish continuation from our 1st support at 0.73147 in line with 38.2% Fibonacci retracement towards our 1st resistance at 0.74318 in line with 78.6% Fibonacci retracement and 100% Fibonacci projection. Prices are trading above the Ichimoku cloud indicator which further support our bullish bias. On the H4 timeframe, we see the potential for further bullish momentum from our 1st support at 0.73143 in line with 127.2% Fibonacci extension towards our 1st resistance at 0.74303. which is in line with 78.6% Fibonacci retracement and 100% Fibonacci projection. Our bullish bias is further supported by prices trading above the Ichimoku cloud.
Areas of consideration :
- H4 1st support at 0.73143
- H4 1st resistance at 0.74303
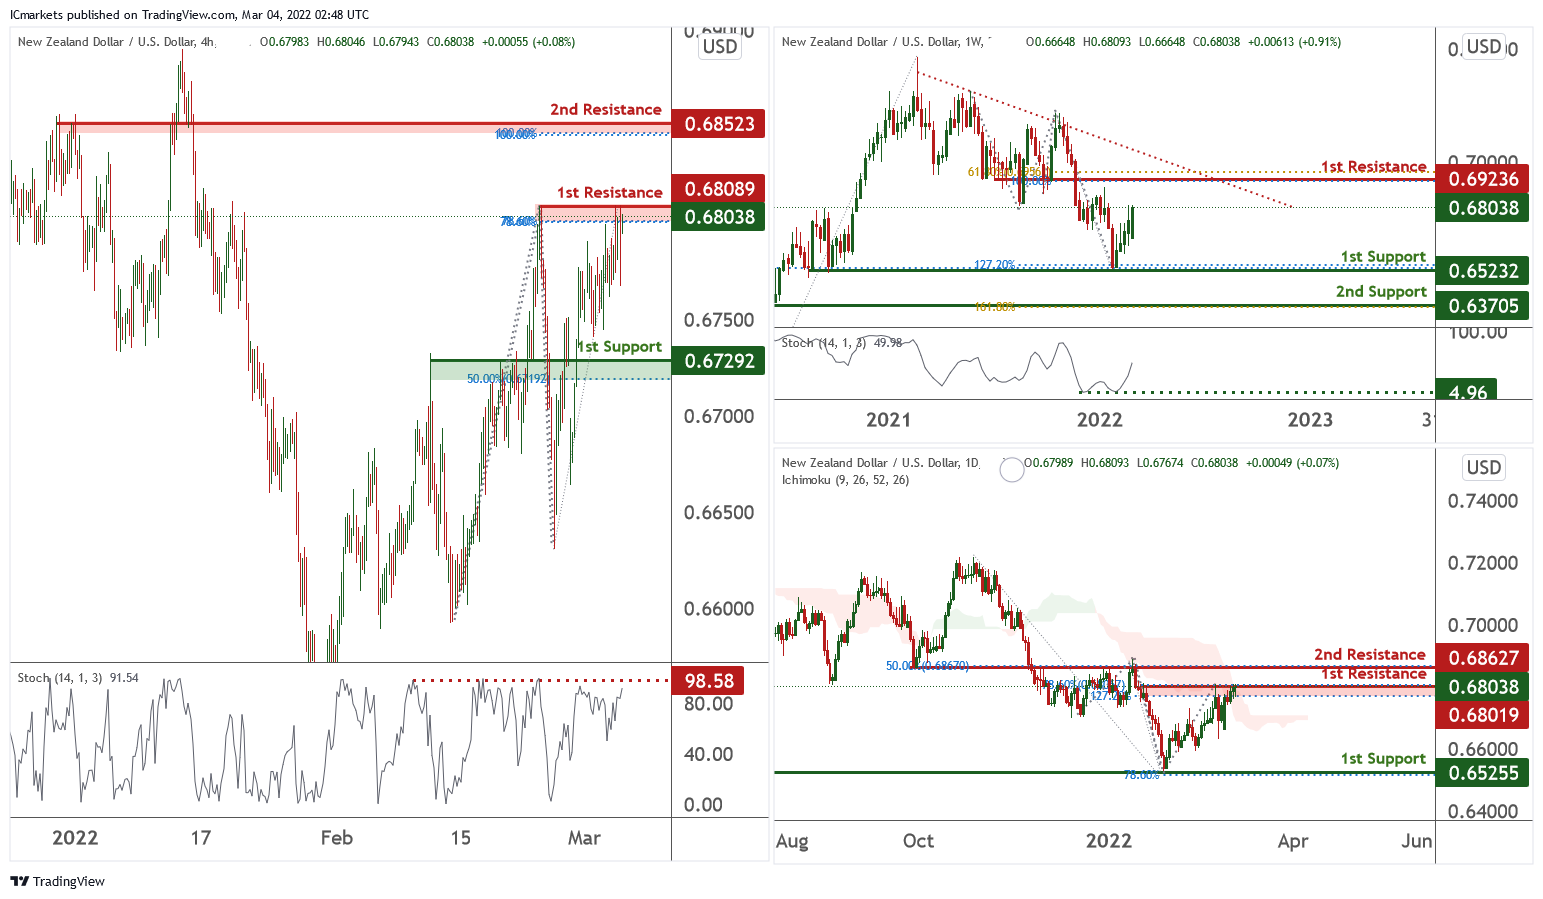
NZD/USD:
On the weekly time frame price is abiding by a descending trendline and near 1st support level of 0.65232 in line with 50% Fibonacci retracement and 127.2% Fibonacci projection. Price can go to the 1st resistance level of 0.69236 in line with 100% Fibonacci projection and 61.8% Fibonacci retracement. Our bullish bias is supported by stochastic indicator as it is near support level
On the daily chart, price is near 1st resistance level of 0.68019 in line with 78.6% Fibonacci retracement and 127.2% Fibonacci projection. Price can potentially dip to the 1st support level of 0.65255 in line with 78.6% Fibonacci projection. Our bearish bias is supported by the ichimoku cloud indicator as the price is trading below it.
On the H4 chart , price is near 1st resistance level of 0.68089 in line with 78.6% Fibonacci retracement and 78.6% Fibonacci projection. Price can potentially dip to the 1st support level of 0.67292 in line with 50% Fibonacci retracement. Our bearish bias is supported by stochastic as it is at resistance level.
Areas of consideration:
- H4 time frame, 1st resistance at 0.68089
- H4 time frame, 1st support at 0.67292
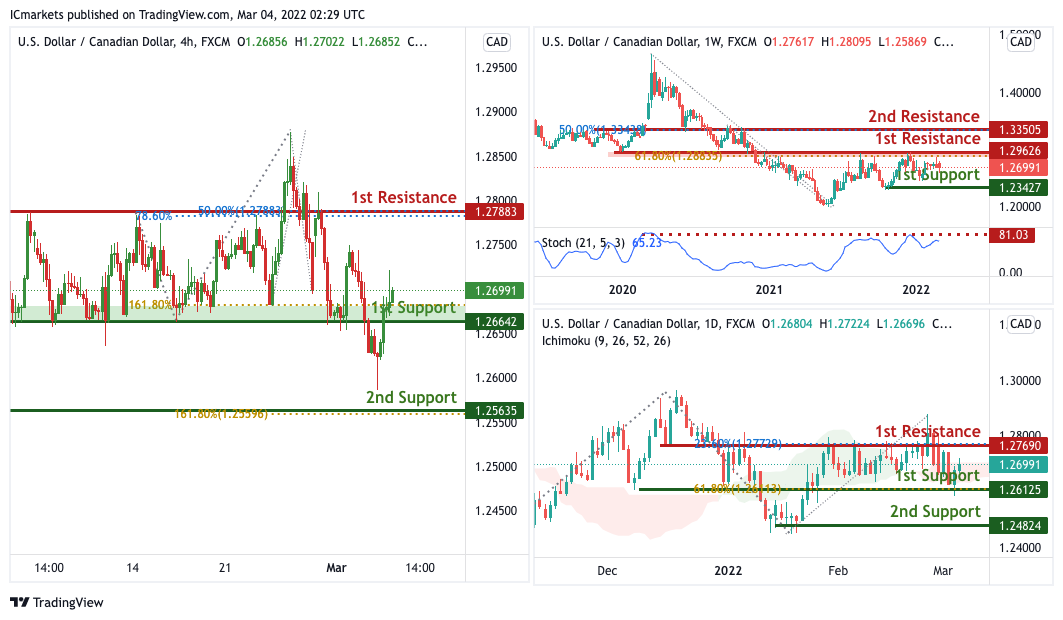
USD/CAD:
On the Weekly timeframe, We see the possibility of bearish continuation from our 1st resistance at 1.29626 in line with horizontal overlap resistance towards our 1st support at 1.23427 in line with the horizontal swing low support. Alternatively, price may break 1st resistance and head for 2nd resistance at 1.33505 in line with the 50% Fibonacci retracement level. Our bearish bias is further supported by how price is expected to reverse off the stochastics indicator. On the Daily chart, price is near 1st support level of 1.26125 in line with horizontal overlap support and 61.8% Fibonacci retracement. Price can potentially rise to the 1st resistance level of 1.26991 in line with the horizontal overlap resistance. Alternatively, price may break 1st support and head for 2nd support at 1.24824. Our bullsh bias is supported by how price is moving above the ichimoku cloud. On the H4, price is ranging in between our 1st support and 1st resistance. With no clear indication of where price is heading at this current juncture, We have a bias that price will continue to range within our support and resistance of 1.26642 and 1.27883 respectively.
Areas of consideration:
- H4 time frame, 1st support at 1.26642
- H4 time frame, 1st resistance at 1.27883
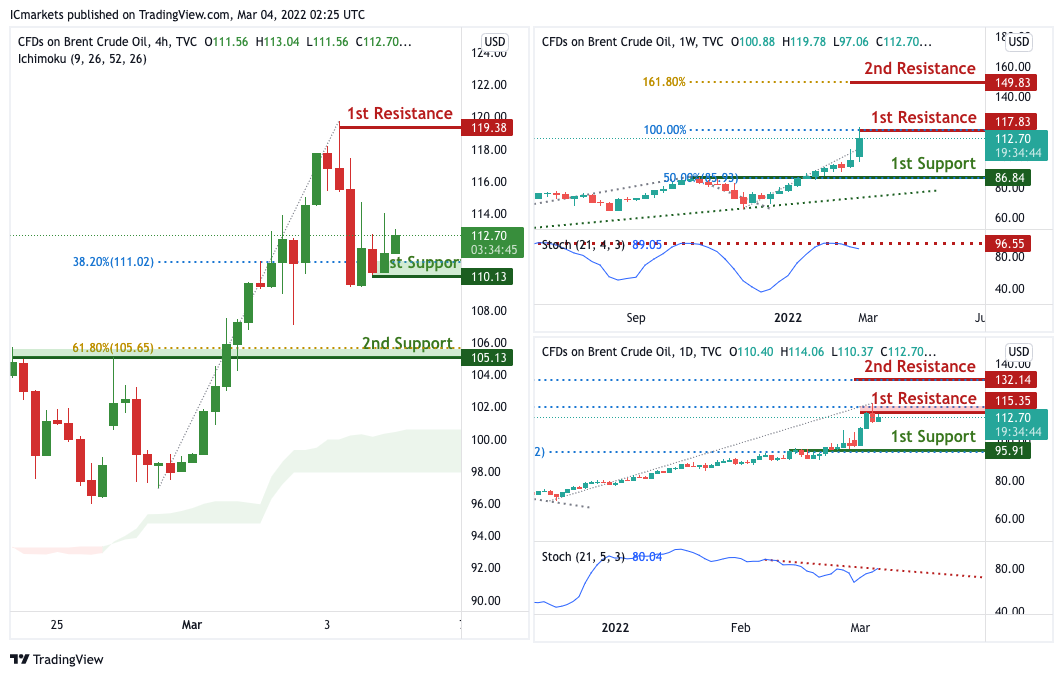
OIL:
On the Weekly timeframe, We see the possibility of bearish continuation from our 1st resistance at 117.83 in line with horizontal overlap resistance towards our 1st support at 86.84 in line with the horizontal swing low support. Alternatively, price may break 1st resistance and head for 2nd resistance at 149.83 in line with the 161.8% Fibonacci extension level. Our bearish bias is further supported by how price is expected to reverse off the stochastics indicator. On the Daily timeframe, We see the possibility of bearish continuation from our 1st resistance at 115.35 in line with horizontal overlap resistance towards our 1st support at 95.91 in line with the horizontal overlap support. Alternatively, price may break 1st resistance and head for 2nd resistance at 132.14 in line with the 127.2% Fibonacci extension level. Our bearish bias is further supported by how price is expected to reverse off the stochastics indicator. On the H4 timeframe, price is near 1st support level of 110.13 in line with horizontal overlap support and 38.2% Fibonacci retracement. Price can potentially rise to the 1st resistance level of 119.38 in line with the horizontal overlap resistance. Alternatively, price may break 1st support and head for 2nd support at 105.13. Our bullsh bias is supported by how price is moving above the ichimoku cloud.
Areas of consideration:
- H4 time frame, 1st resistance of 113.91
- H4 time frame, 1st support of 106.99
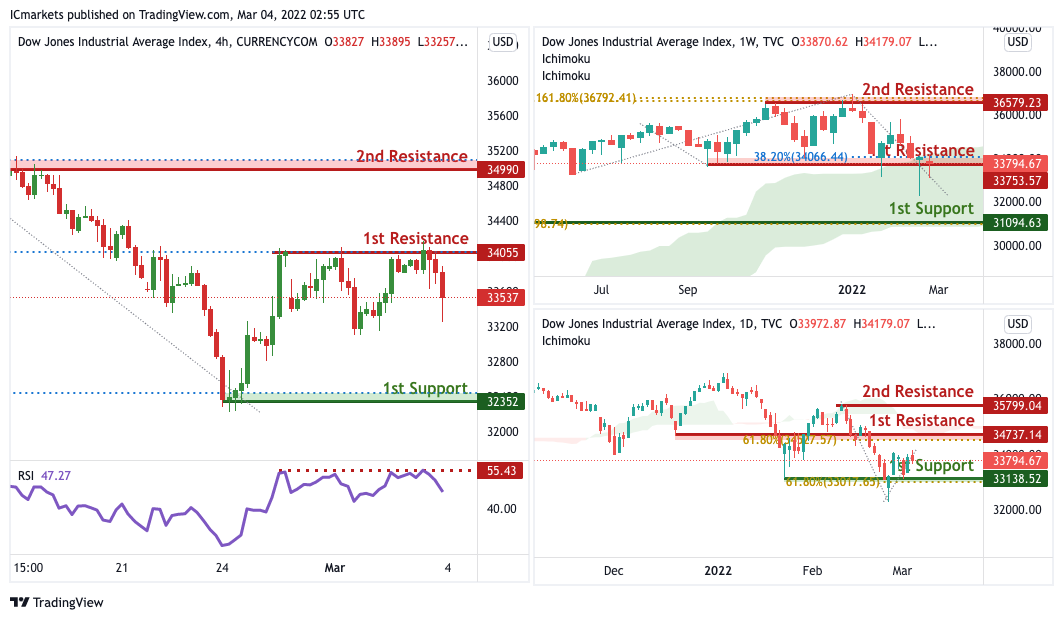
Dow Jones Industrial Average:
On the Weekly timeframe, We see the possibility of bearish continuation from our 1st resistance at 33753 in line with horizontal overlap resistance towards our 1st support at 31094 in line with the horizontal swing low support. Alternatively, price may break 1st resistance and head for 2nd resistance at 36479 in line with the 161.8% Fibonacci extension level. Our bearish bias is further supported by how price is moving below the ichimoku cloud indicator. On the Daily timeframe, We see the possibility of bearish continuation from our 1st resistance at 34737 in line with horizontal overlap resistance towards our 1st support at 33138 in line with the horizontal swing low support. Alternatively, price may break 1st resistance and head for 2nd resistance at 35800 in line with the horizontal swing high resistance. Our bearish bias is further supported by how price is moving below the ichimoku cloud indicator. On the H4 timeframe, We see the possibility of bearish continuation from our 1st resistance at 34055 in line with horizontal overlap resistance towards our 1st support at 32352 in line with the horizontal swing low support. Alternatively, price may break 1st resistance and head for 2nd resistance at 34990 in line with the 78.6% Fibonacci retracement level. Our bearish bias is further supported by how price is expected to reverse off the RSI indicator.
Areas of consideration :
- H4 1st support at 32352
- H4 1st resistance at 34055


