
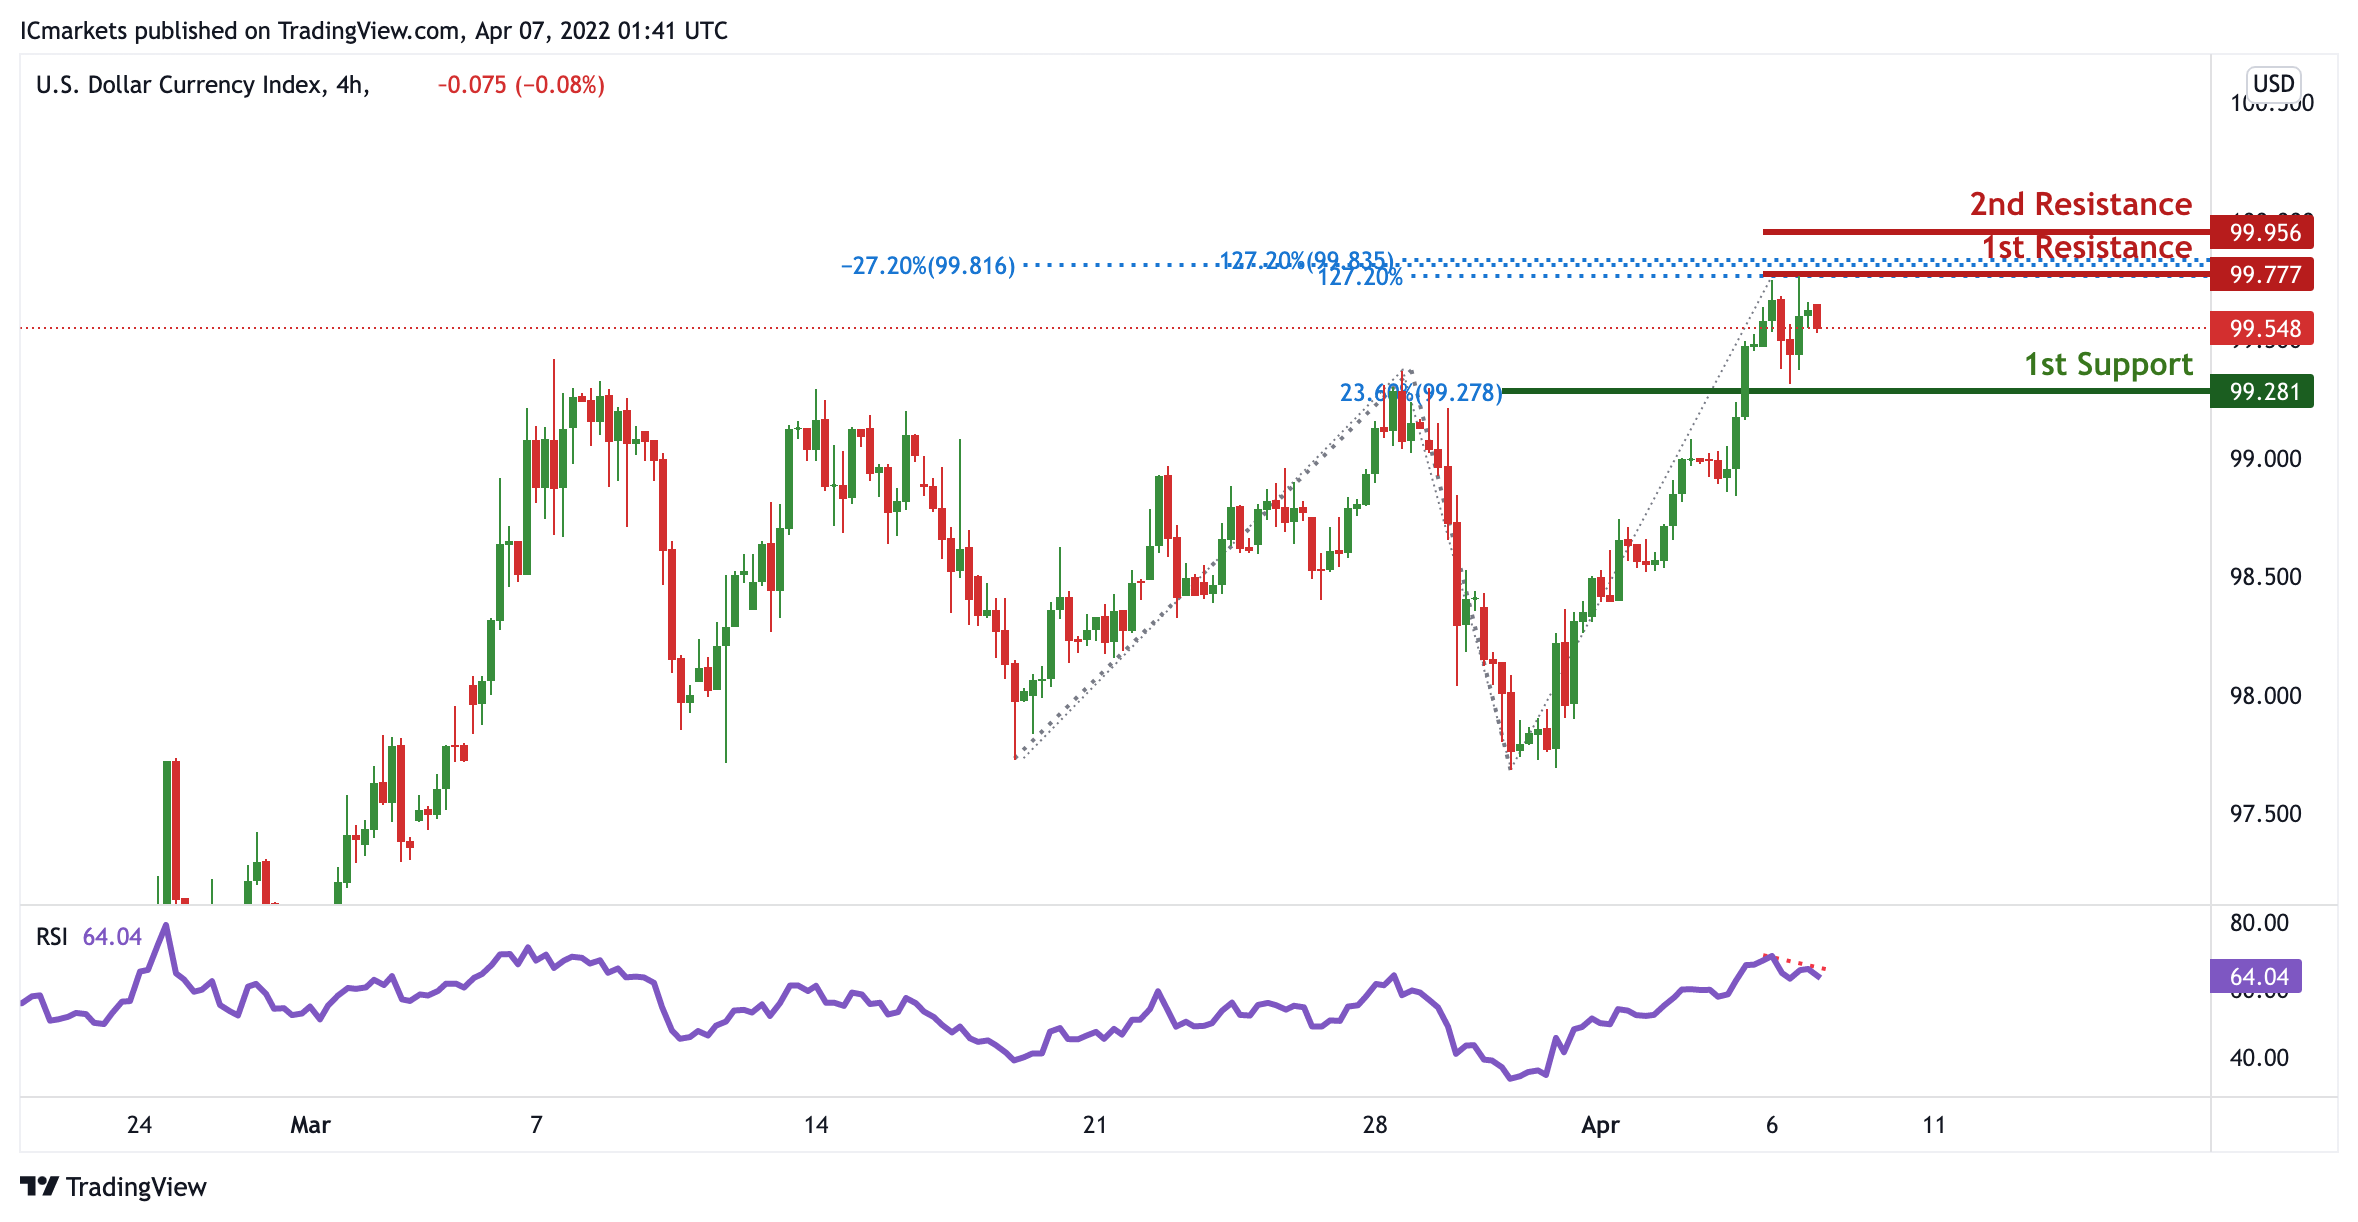
DXY:
On the H1 timeframe, prices have approached pivot. We see the potential for a dip from our 1st resistance at 99.777 in line with which is an area of Fibonacci confluences towards our 1st support at 99.281 in line with 23.6% Fibonacci retracement. RSI is showing bearish momentum, further supporting our bearish bias.
Areas of consideration:
- H4 time frame, 1st resistance at 99.777
- H4 time frame, 1st support at 99.281
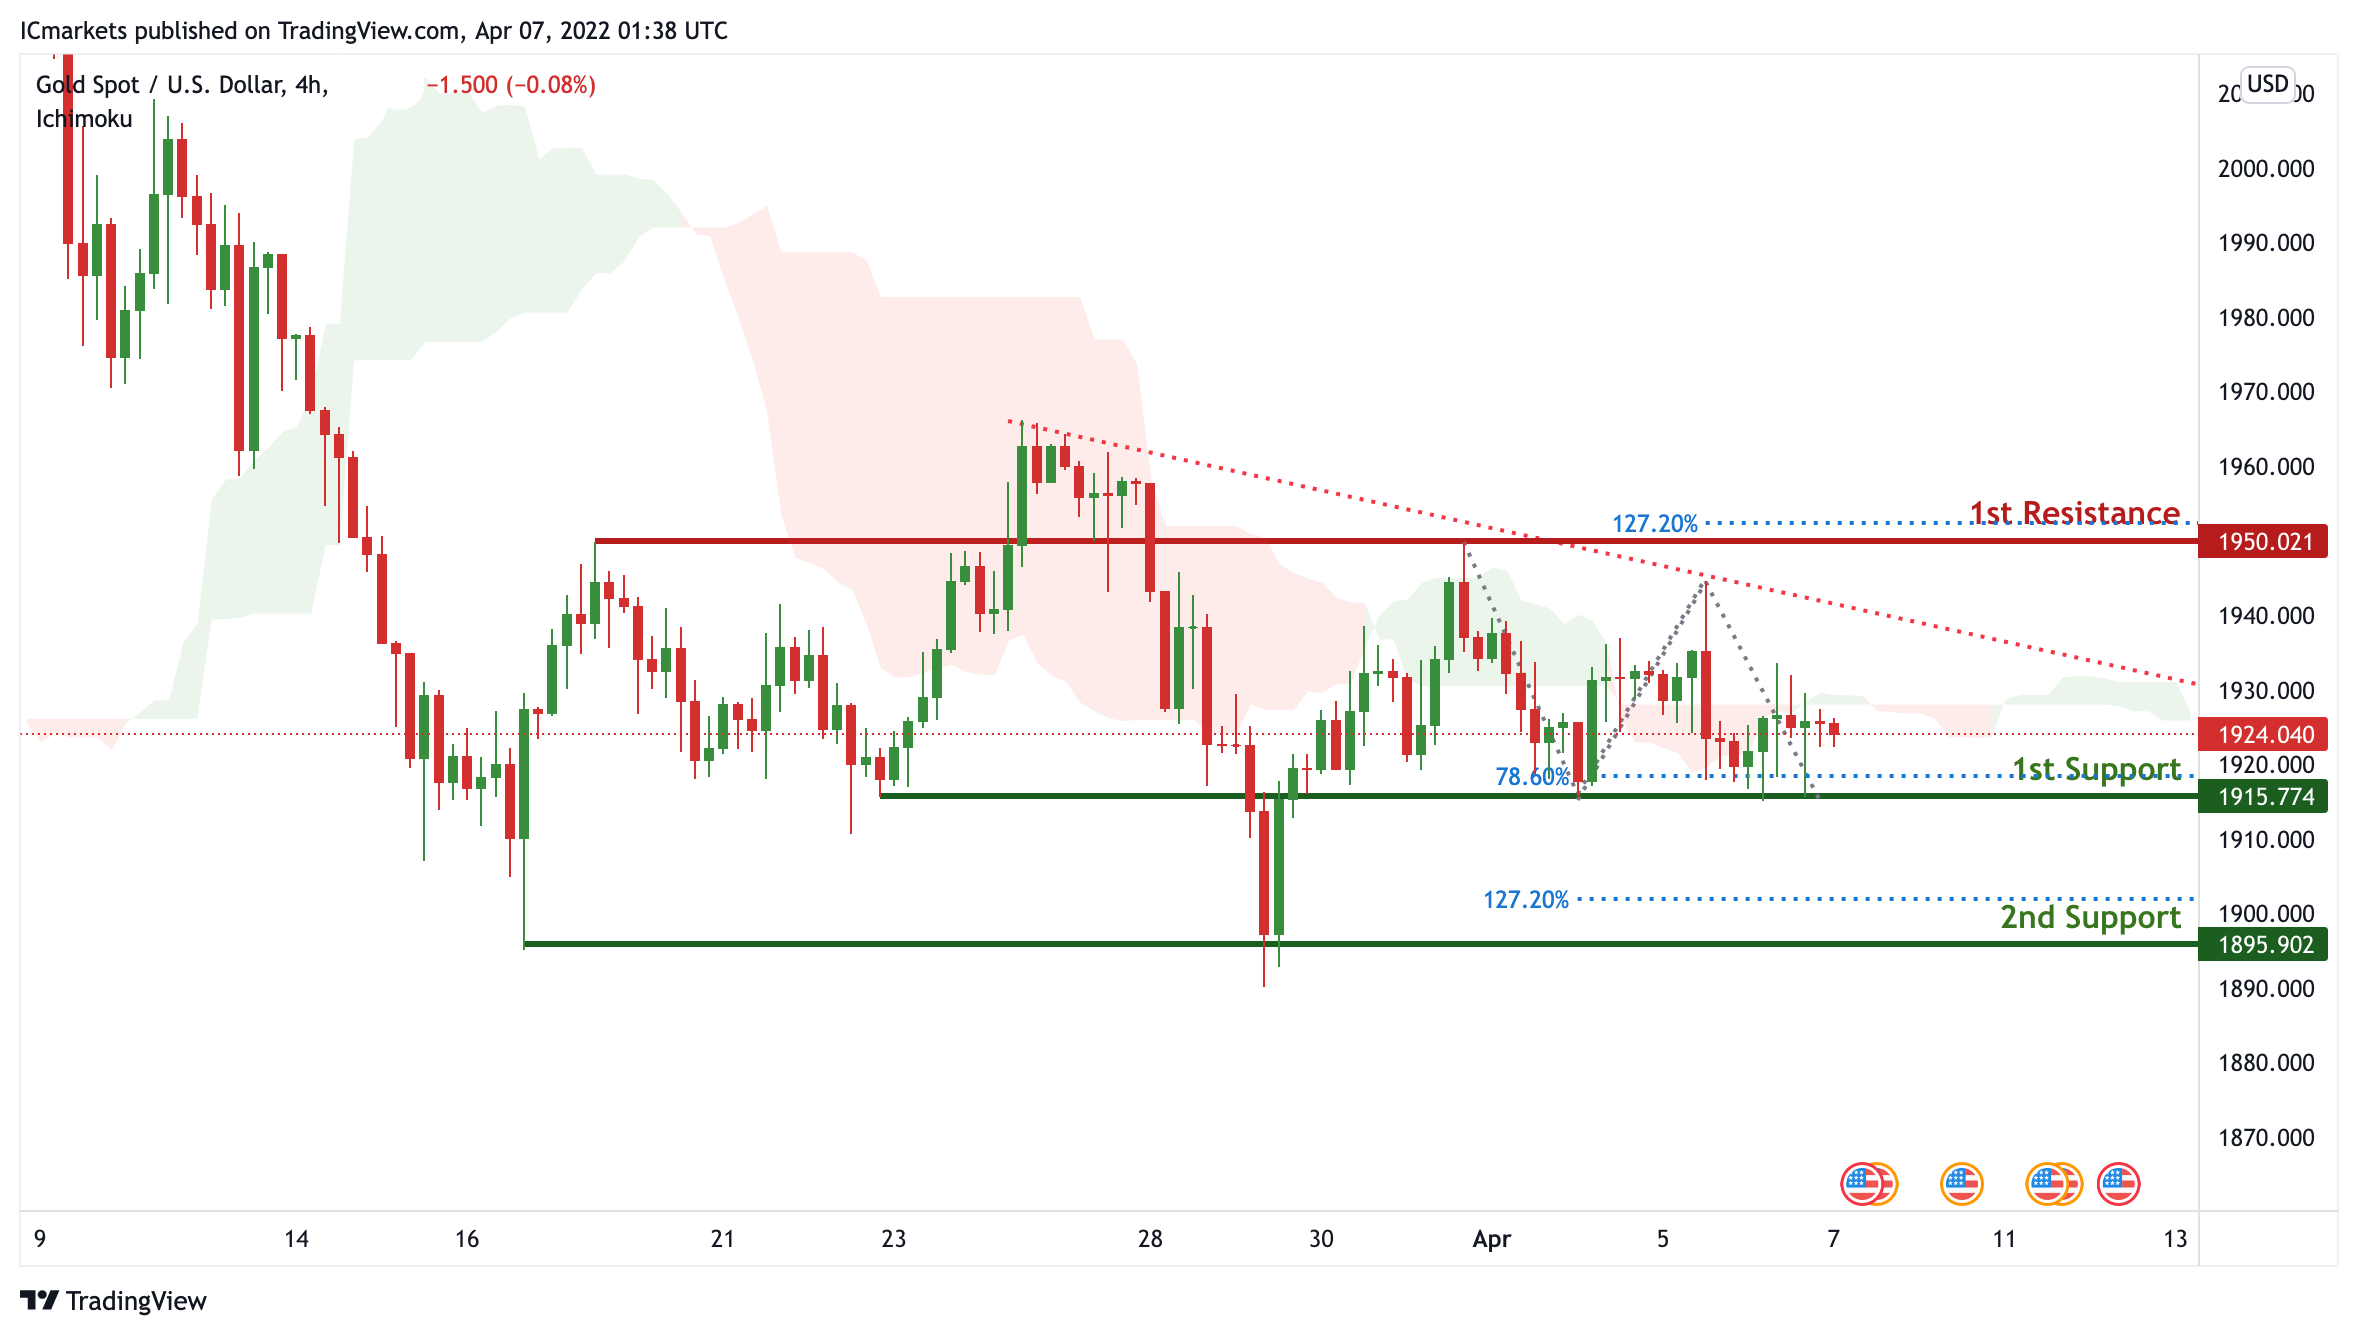
XAU/USD (GOLD):
On the H1, prices are on bearish momentum and abiding by a descending trendline. We see the potential for a dip from our 1st resistance at 1950.021 which is in line with 127.2% Fibonacci extension towards our 1st support at 1915.774 in line which is a graphical overlap and in line with 78.6% Fibonacci Projection. Ichimoku is supporting our bullish bias.
Areas of consideration:
- 4h 1st support at 1915.774
- 4h 1st resistance at 1950.021
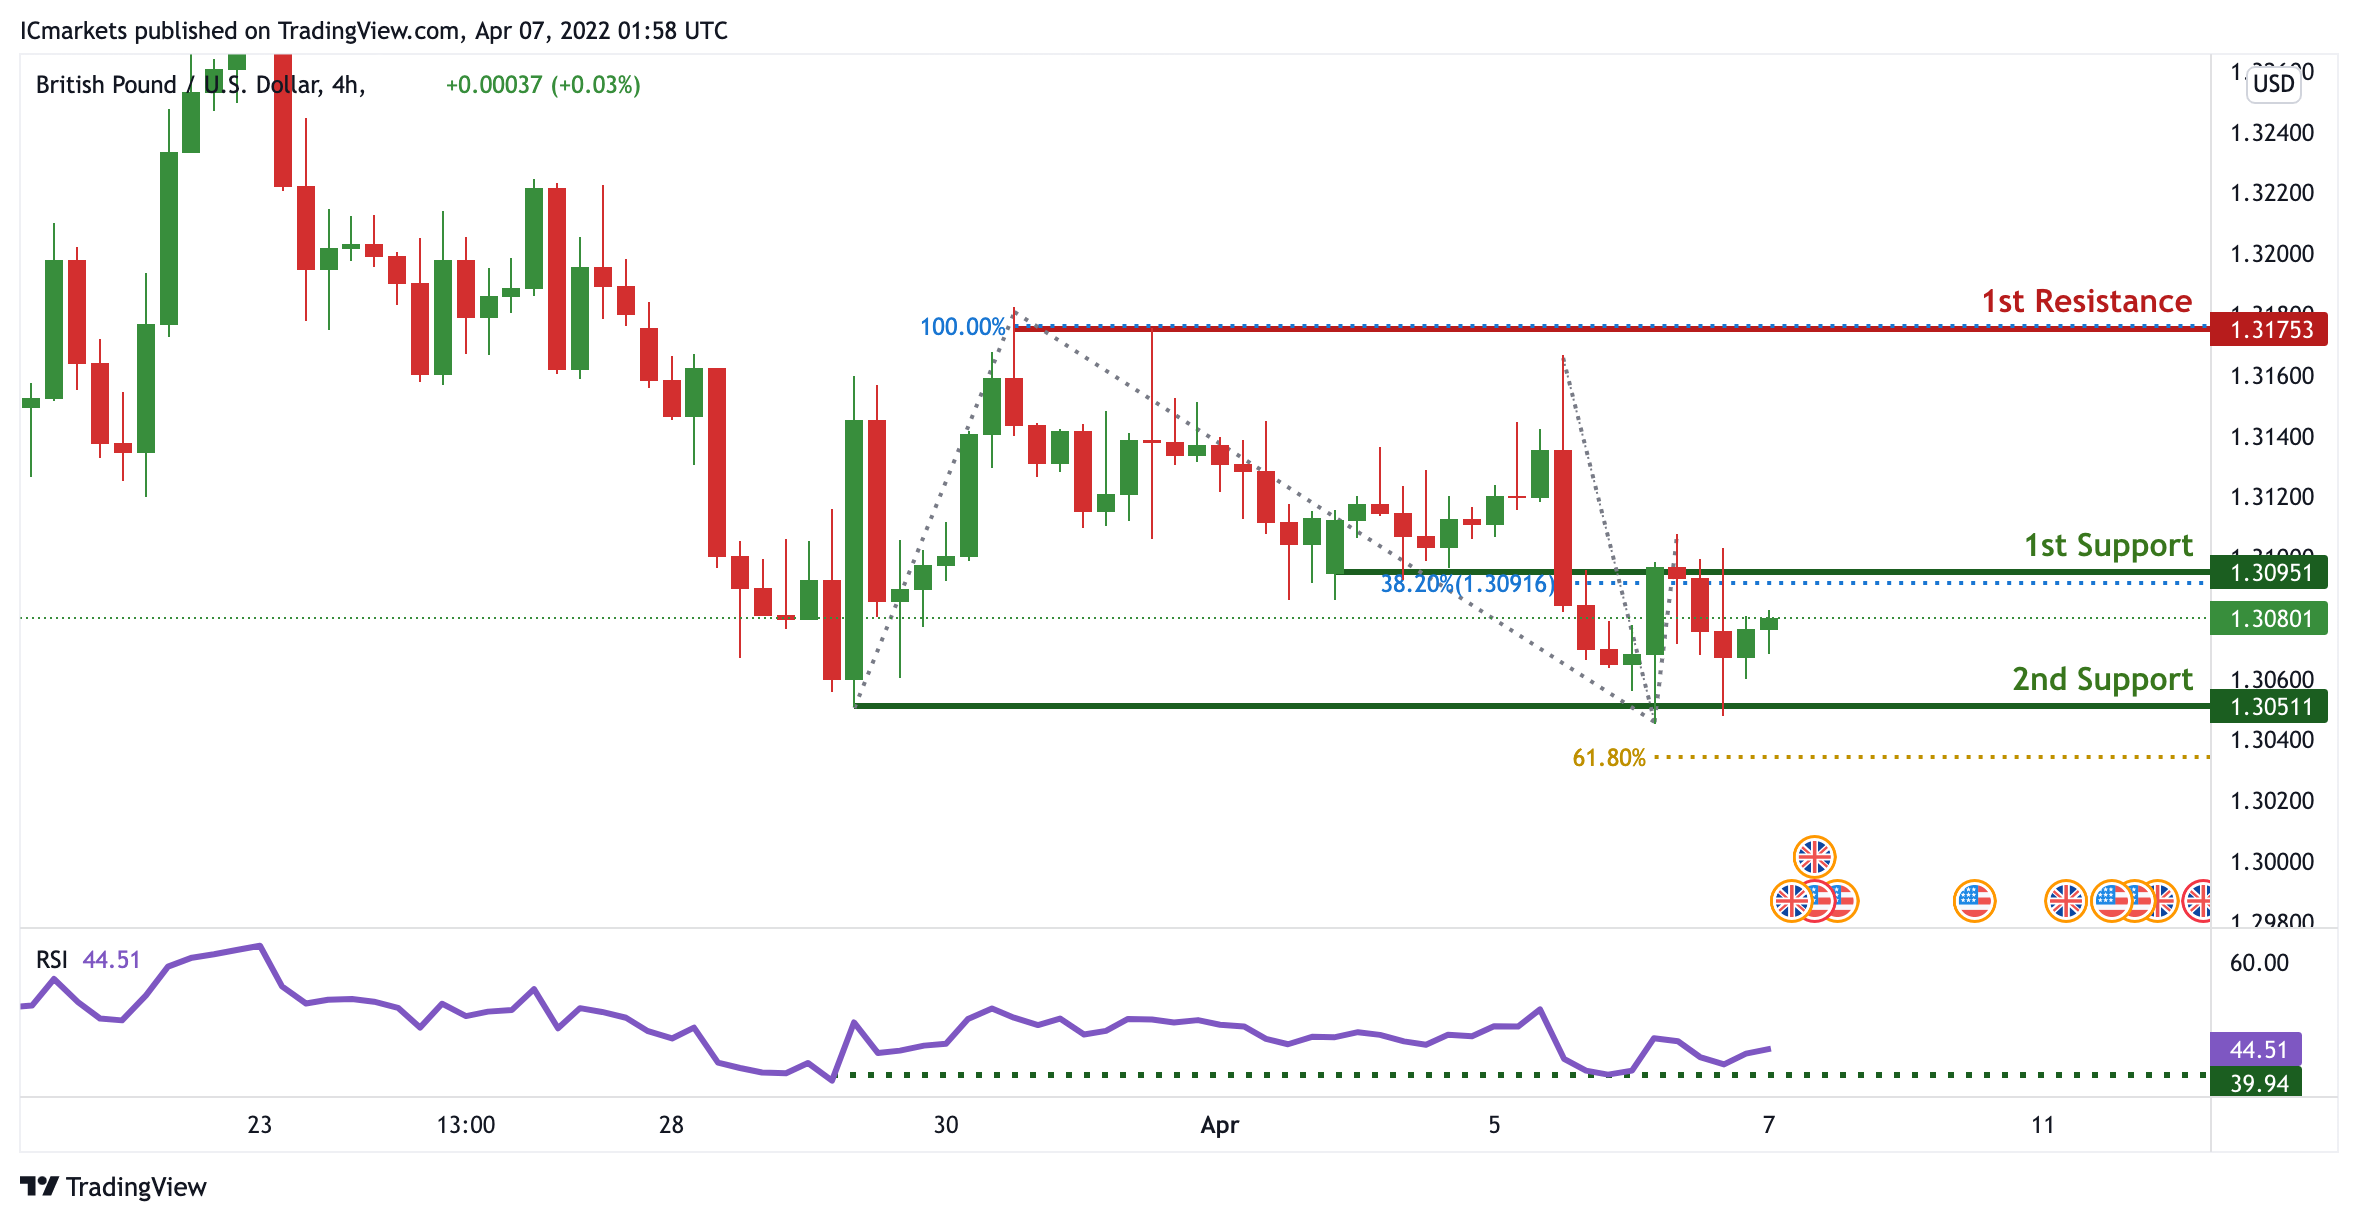
GBP/USD:
On the H4, prices are approaching a pivot. We see the potential for further bullish continuation from our 1st support at 1.30951 in line with 38.2% Fibonacci retracement towards our 1st resistance at 1.31763 in line with 100% Fibonacci Projection. Alternatively, if prices continue to dip, we might find prices dropping further towards our 2nd support at 1.30511 in line with 61.8% FIbonacci projection. Our bullish bias is further supported by RSI being at levels where bounces previously occurred.
Areas of consideration:
- H4 1st resistance at 1.30511
- H4 1st support at 1.30951
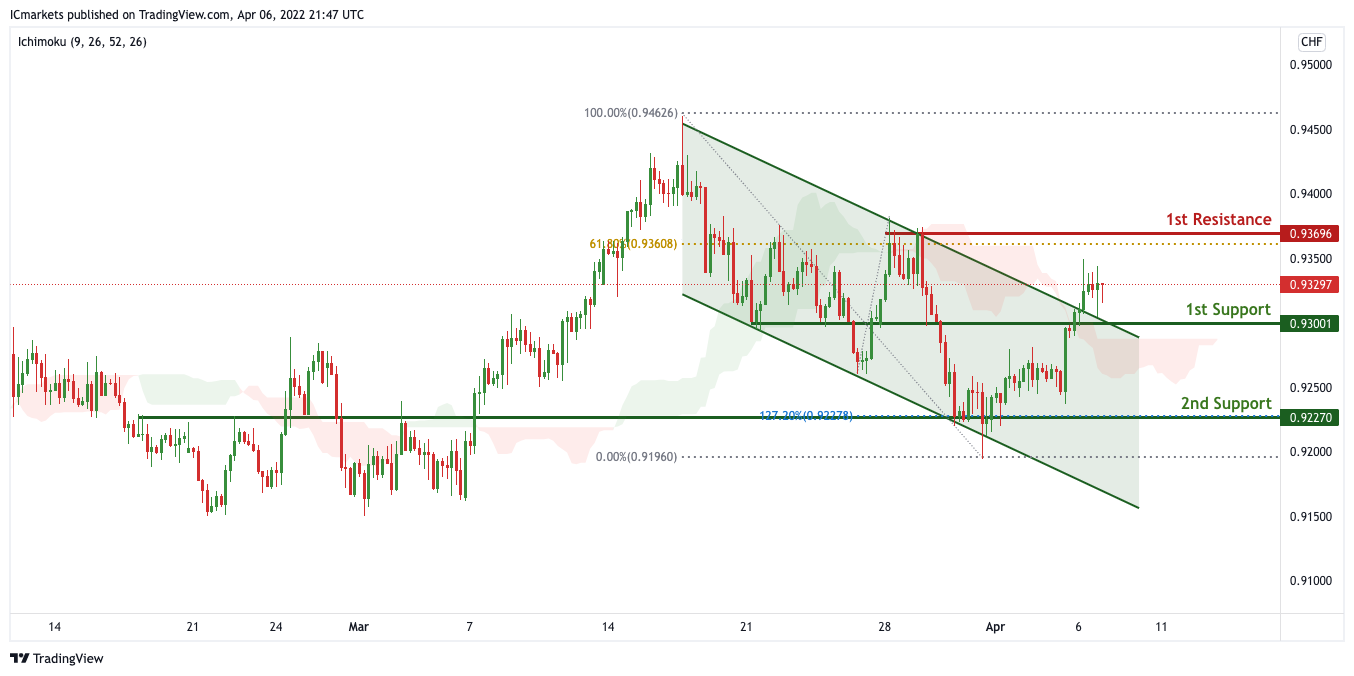
USD/CHF:
On the H4, with price moving above the ichimoku cloud and the recent break of the channel, we have a bias that price will rise to our 1st resistance at 0.93696 in line with the 61.8% Fibonacci retracement from our 1st support at 0.93001 in line with the horizontal pullback support. Alternatively, price may break 1st support structure and head for 2nd support at 0.92270 in line with the swing pullback support.
Areas of consideration
- 1st support level at 0.93001
- 1st resistance level at 0.93696
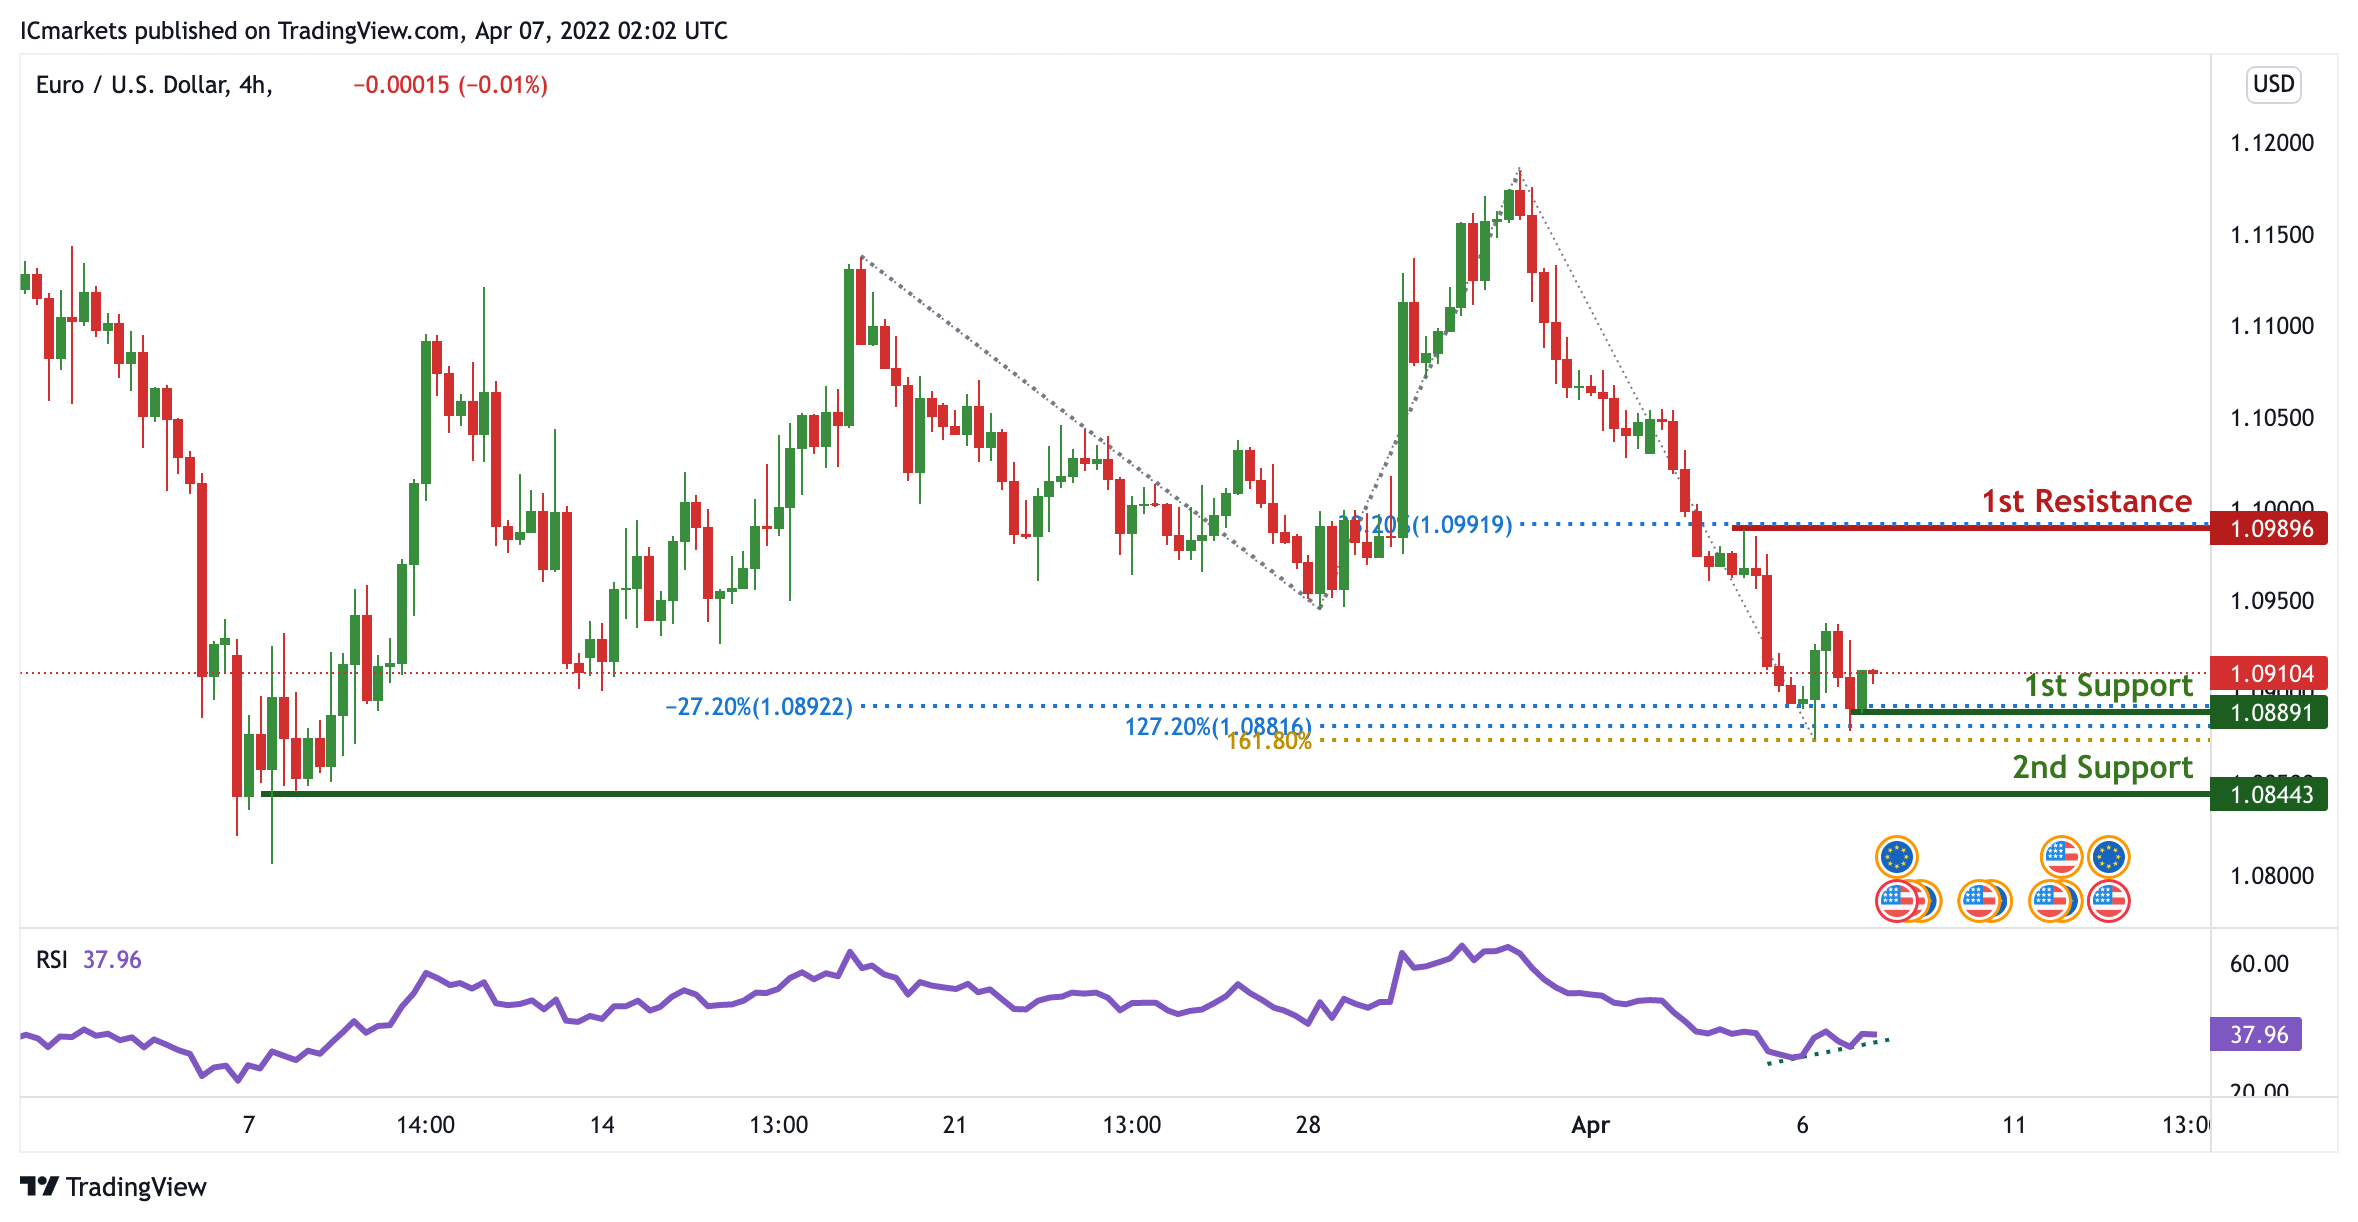
EUR/USD :
On the H4 timeframe, prices are at a key pivot. We see the potential for a bounce from our 1st support at 1.08891 which is an area of Fibonacci confluences towards our 1st resistance at 1.09896 in line with 38.2% Fibonacci retracement. RSI is on bullish momentum, further supporting our bullish bias.
Areas of consideration :
- H4 1st resistance at 1.09896
- H4 1st support at 1.08891
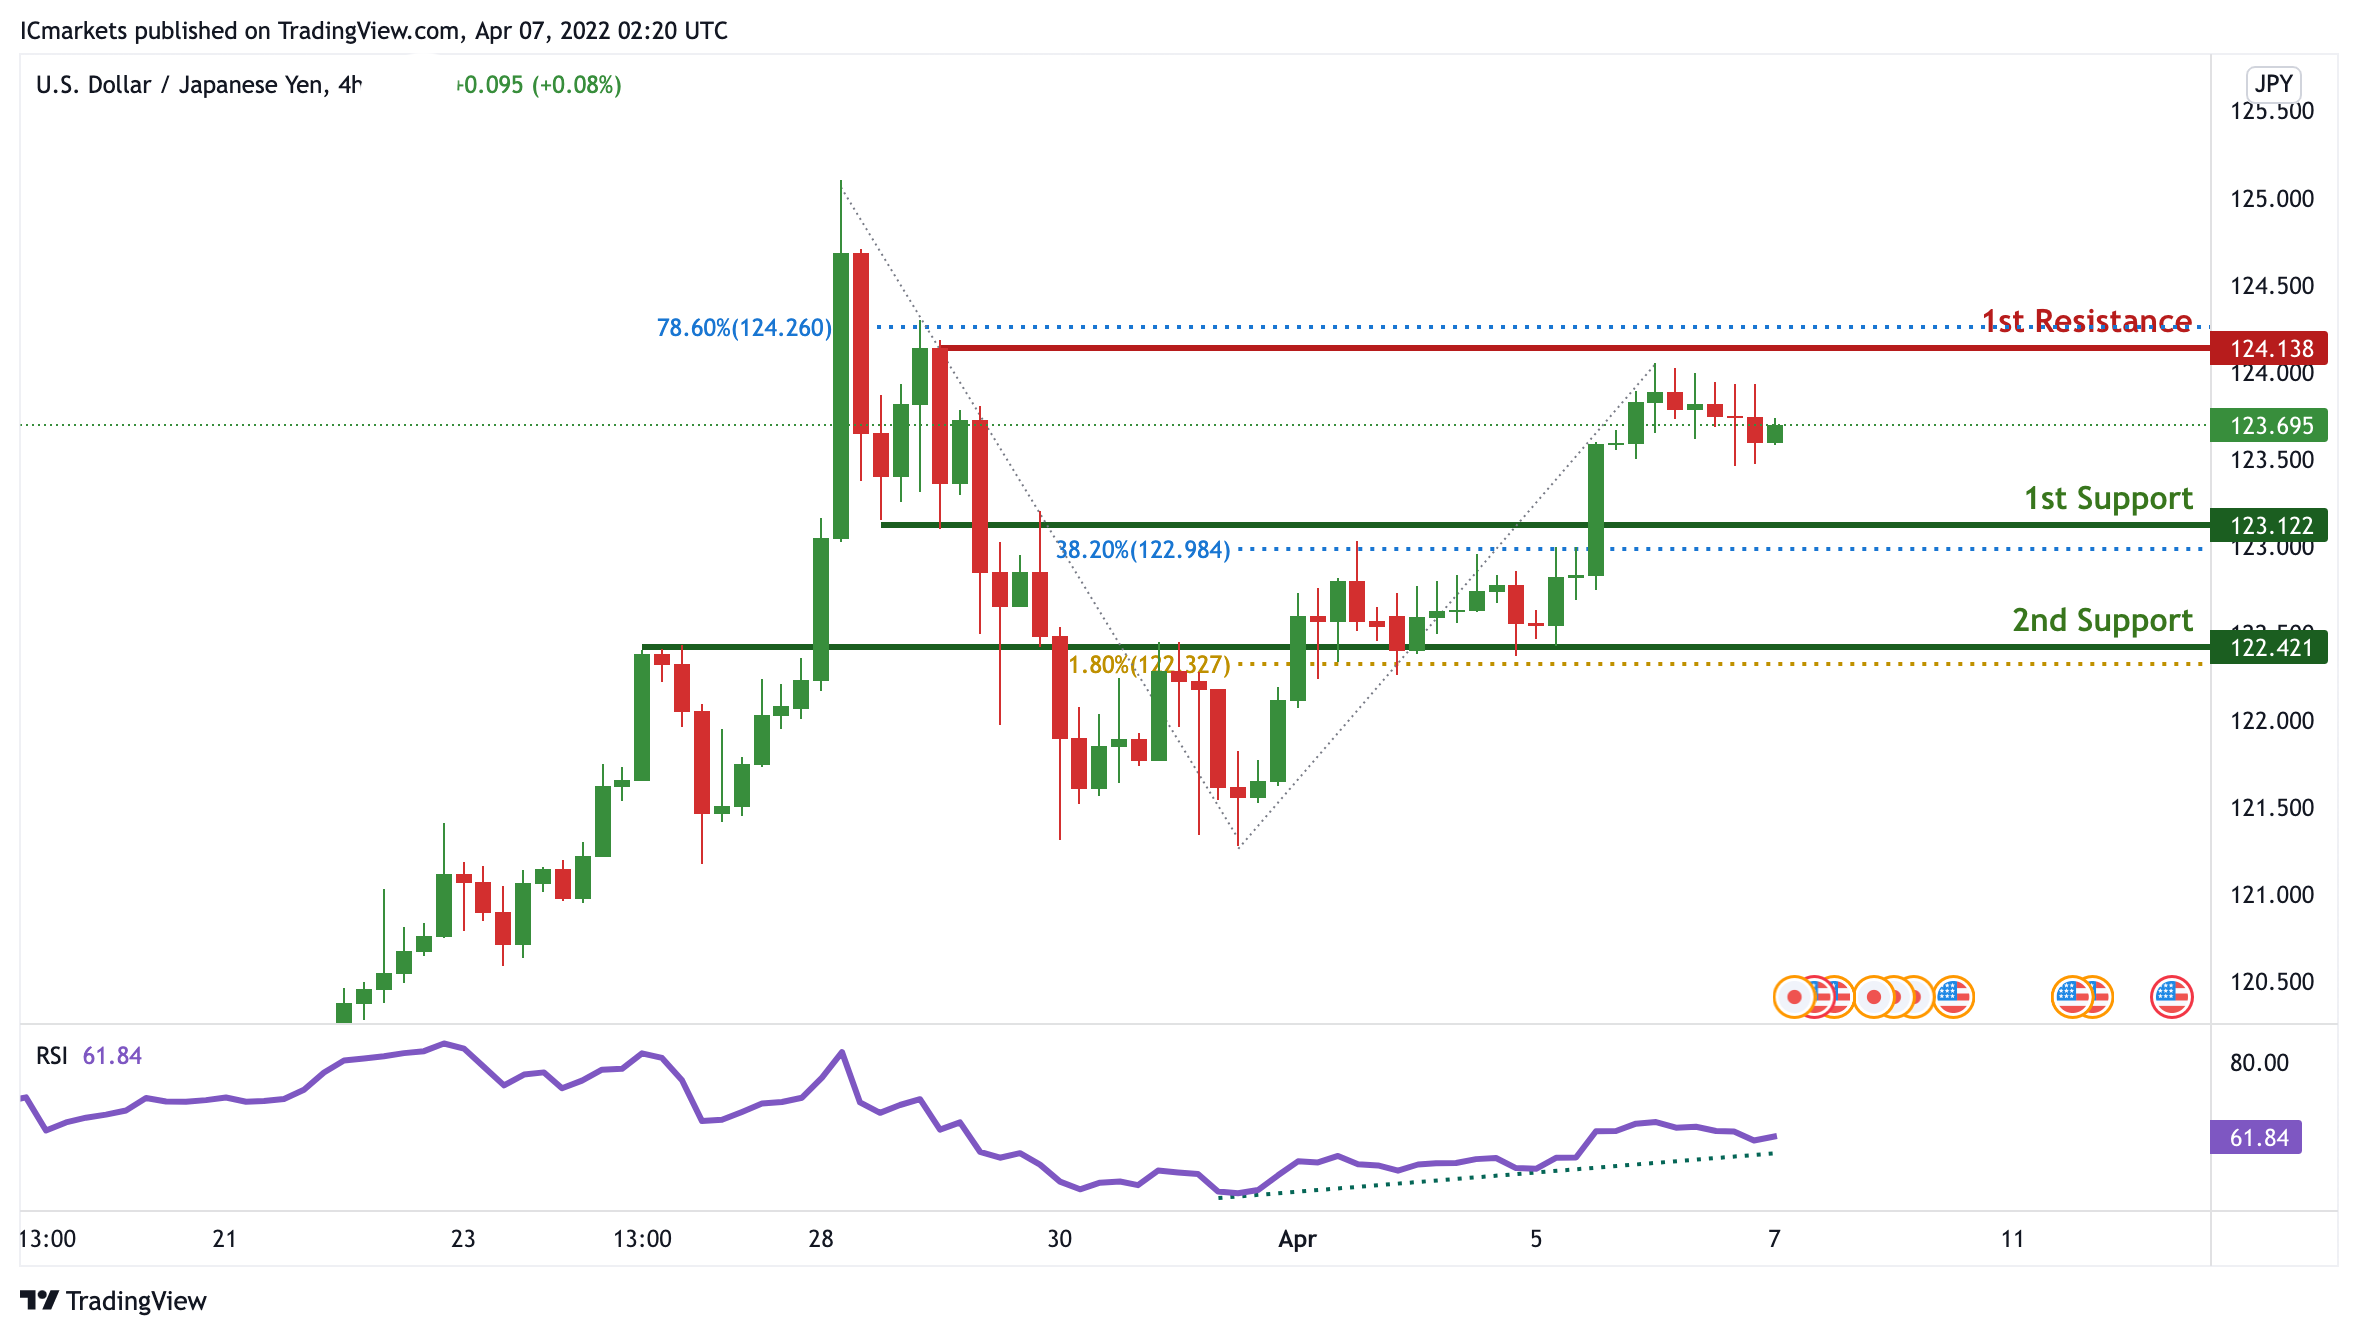
USD/JPY:
On the H4 timeframe, prices have bounced off a pivot. We see the potential for further bullish continuation at 123.122 in line with 38.2% Fibonacci retracement towards our 1st resistance at 124.138 in line with 78.6% Fibonacci Projection. RSI is on bullish momentum, further supporting our bullish bias.
Areas of consideration:
- H4 time frame, 1st resistance at 124.138
- H4 time frame, 1st support at 123.122
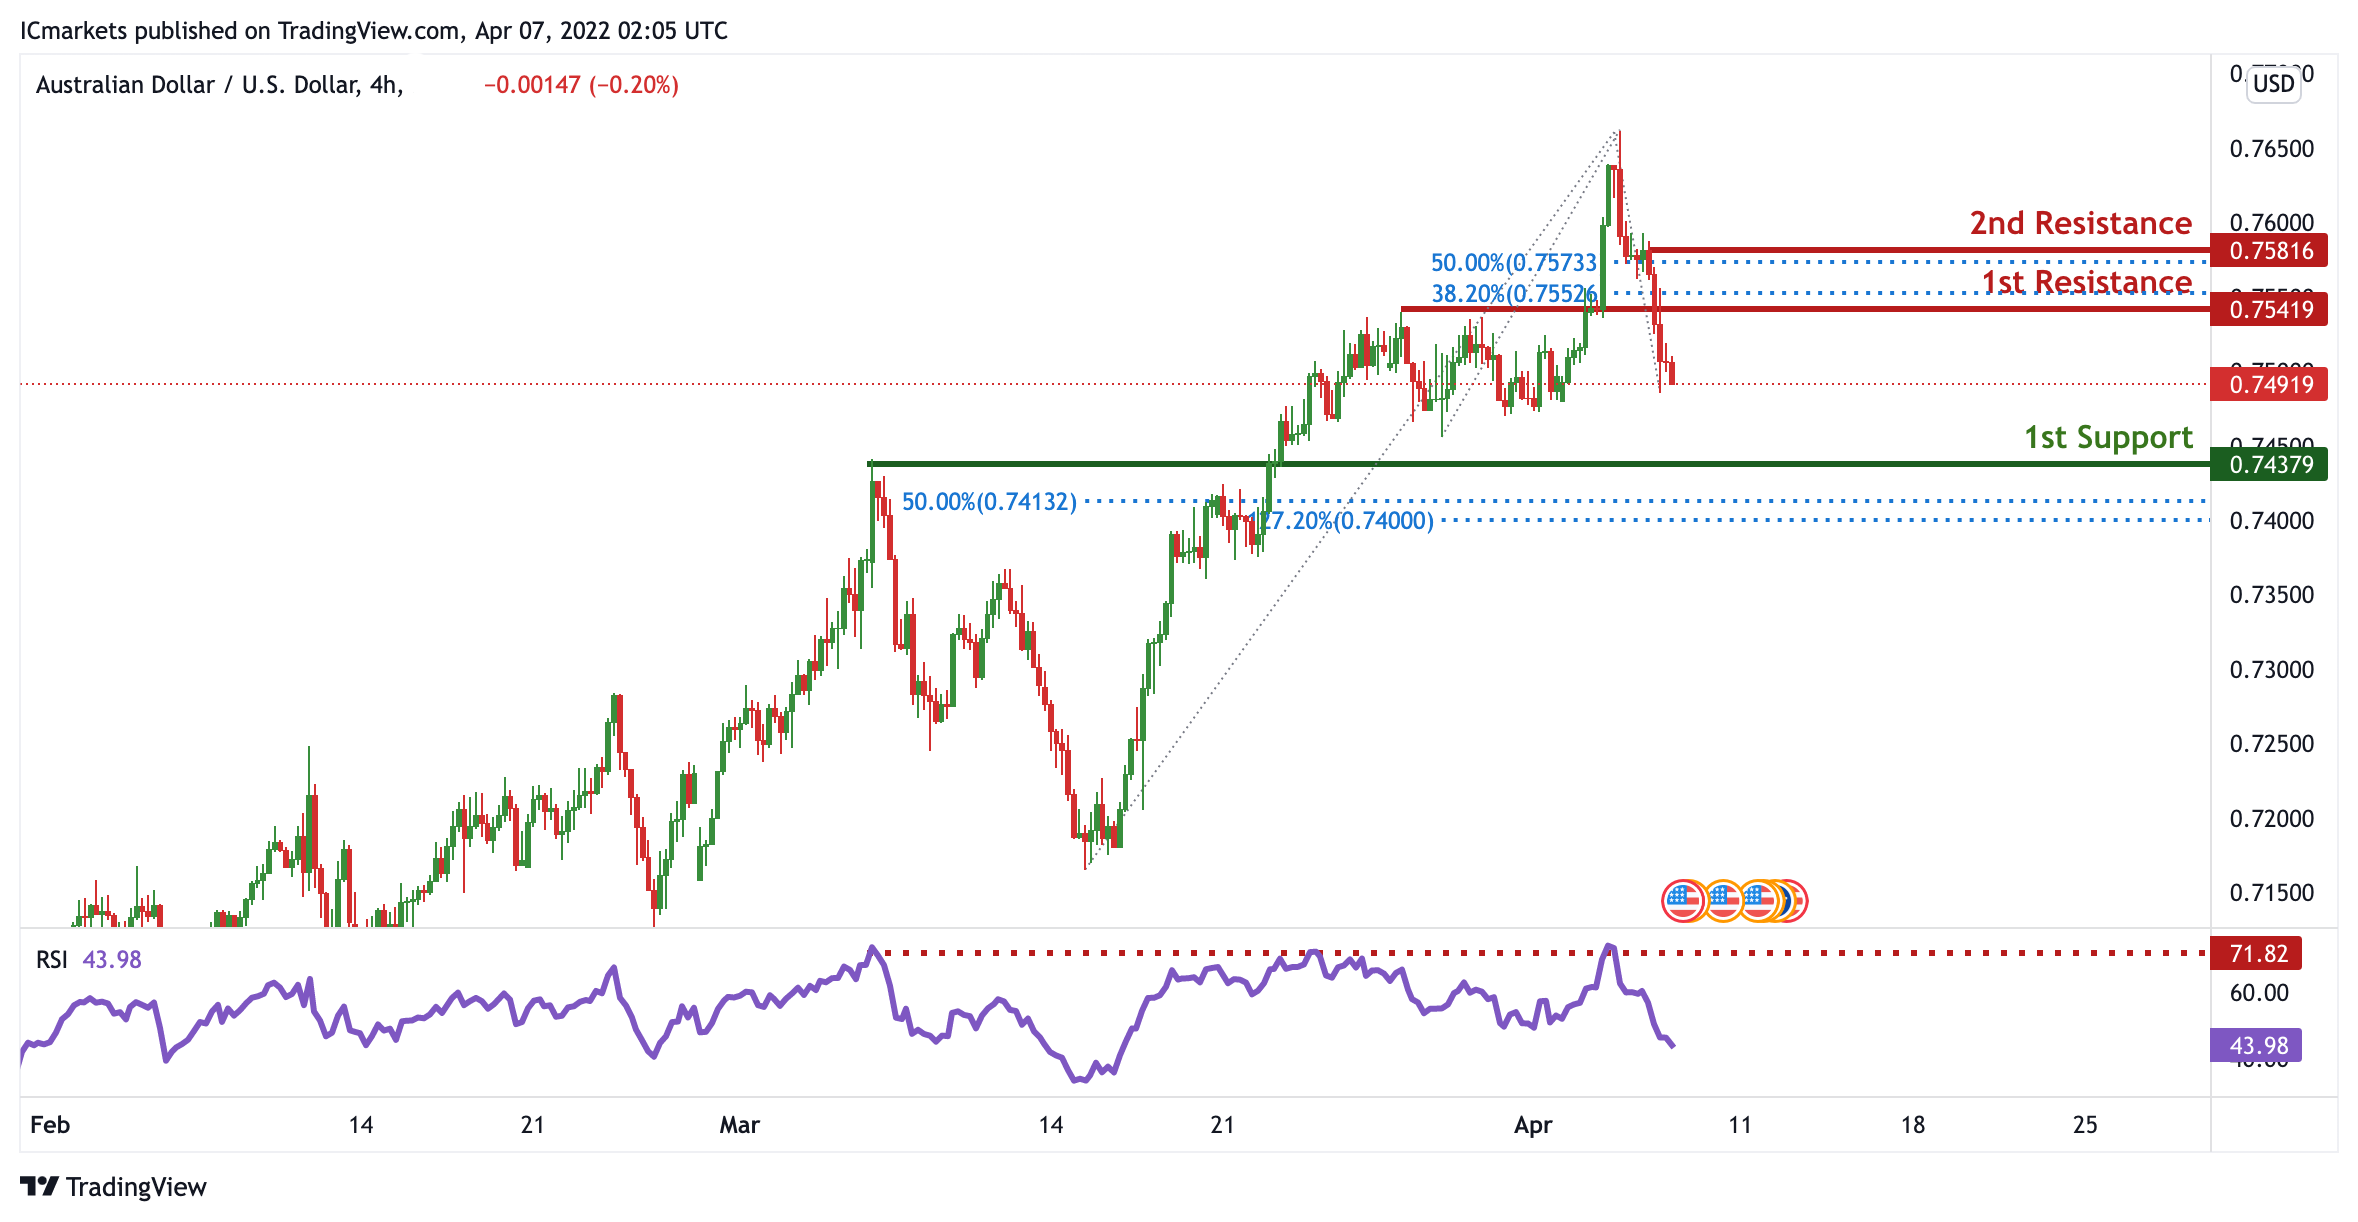
AUD/USD:
On the H4 timeframe, prices have bounced off a pivot. We see the potential for a dip from our 1st resistance at 0.75419 in line with 38.2% Fibonacci retracement towards our 1st support at 0.74379 which is an area of Fibonacci confluences. Our bearish bias is supported by RSI being at levels where dips previously occurred.
Areas of consideration
- H4 1st resistance at 0.75419
- H4 1st support at 0.74379
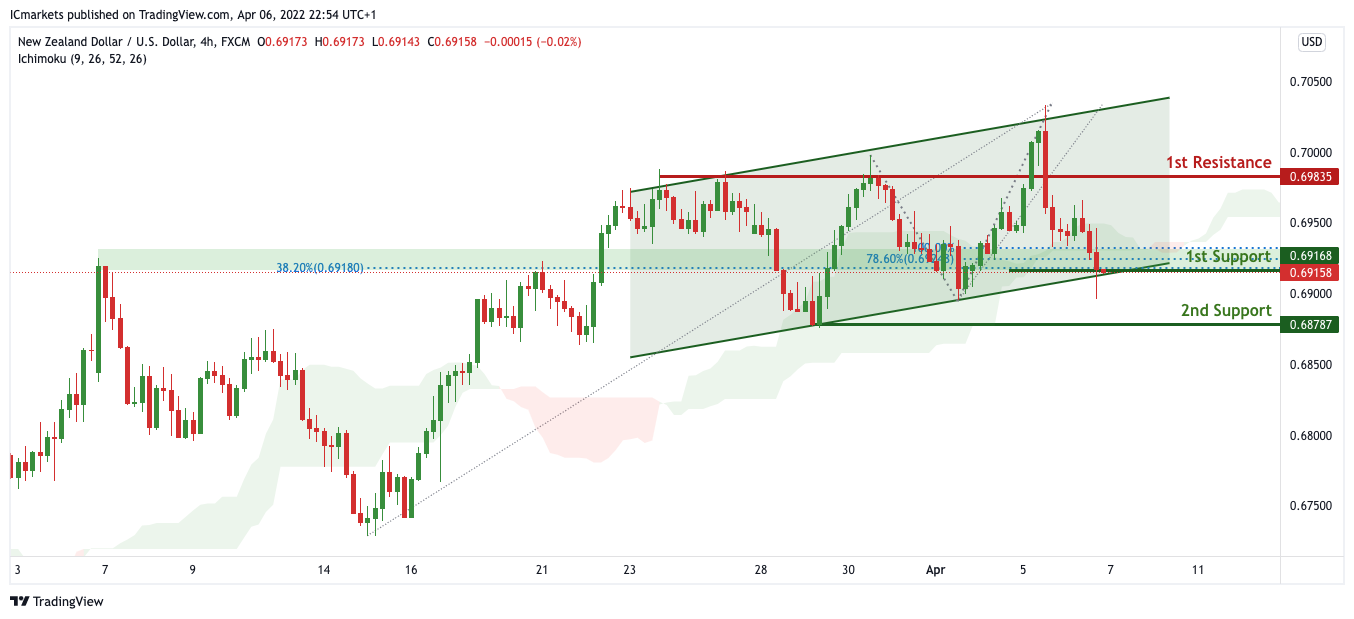
NZD/USD:
On the H4, with price expected to bounce off the support of the ichimoku cloud, we have a bias that price will rise to our 1st resistance at 0.69835 in line with the swing high resistance from our 1st support at 0.69168 in line with the horizontal overlap support, 78.6% Fibonacci projection. Alternatively, price may break 1st support structure and head for 2nd support at 0.68787 in line with the swing low support.
Areas of consideration:
- H4 time frame, 1st support at 0.69168
- H4 time frame, 1st resistance at 0.69835
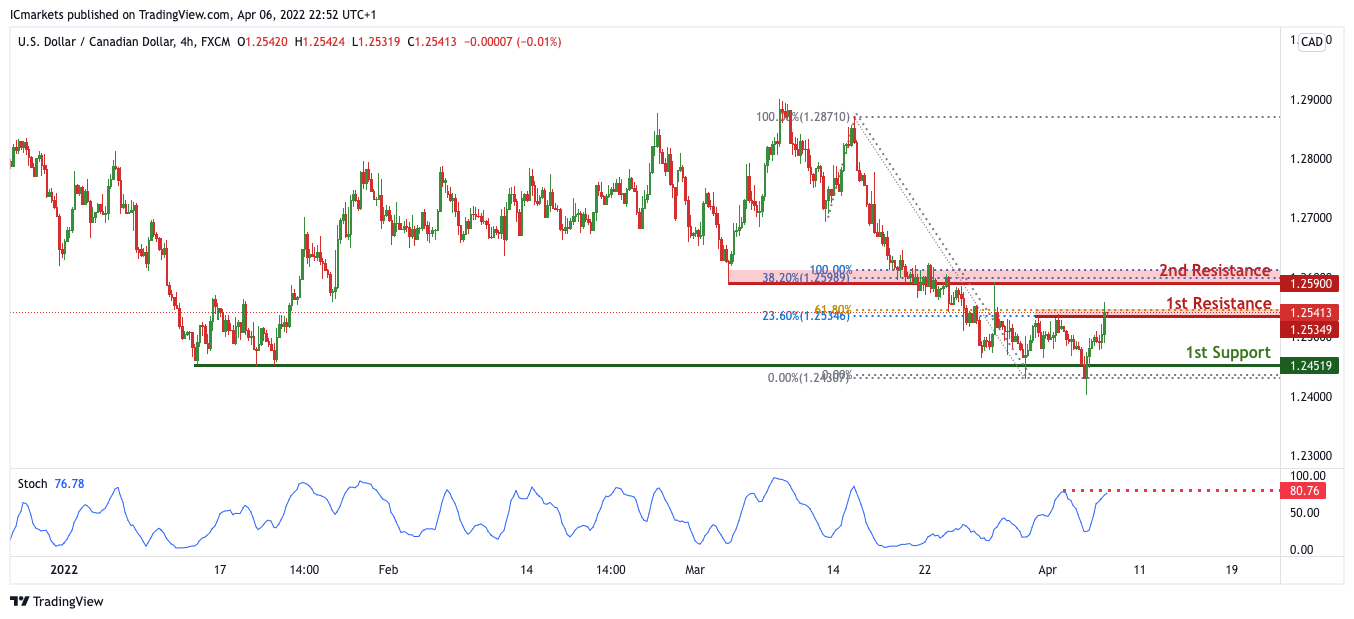
USD/CAD:
On the H4, with price expected to reverse off the stochastic indicator, we expect to see a potential for bearish drop from our 1st resistance of 1.25349 in line with the 23.6% fibonacci retracement and 61.8% Fibonacci projection towards our 1st support level at 1.24519 in line with the swing low support. Alternatively, If price breaks out, it can potentially move towards our 2nd resistance level at 1.25900 which is in line with the 38.2% Fibonacci retracement and 100% Fibonacci projection.
Areas of consideration:
- H4 time frame, 1st support at 1.24519
- H4 time frame, 1st resistance at 1.25349
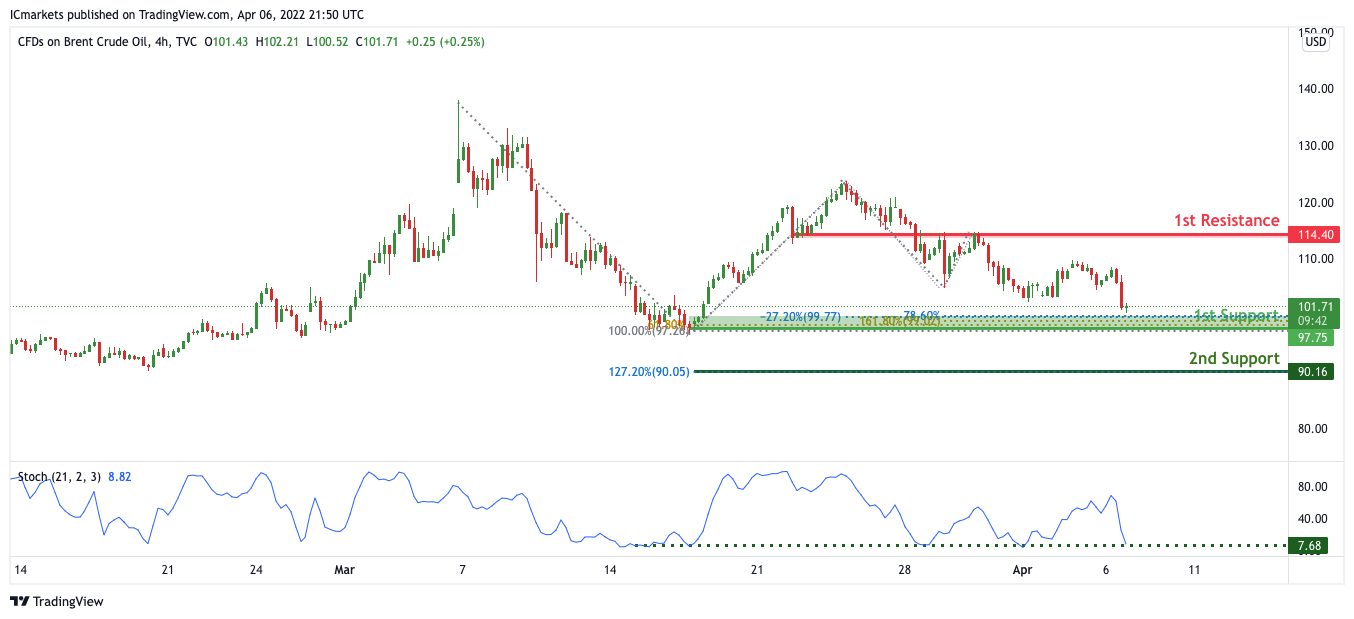
OIL:
On the H4, with price expected to bounce off the support of the stochastics indicator, we have a bias that price will rise to our 1st resistance at 114.40 in line with the horizontal pullback resistance from our 1st support at 101.71 in line with the horizontal overlap support, 78.6% Fibonacci projection. Alternatively, price may break 1st support structure and head for 2nd support at 90.16 in line with the 127.2% Fibonacci extension
Areas of consideration:
- H4 time frame, 1st resistance of 114.40
- H4 time frame, 1st support of 101.71
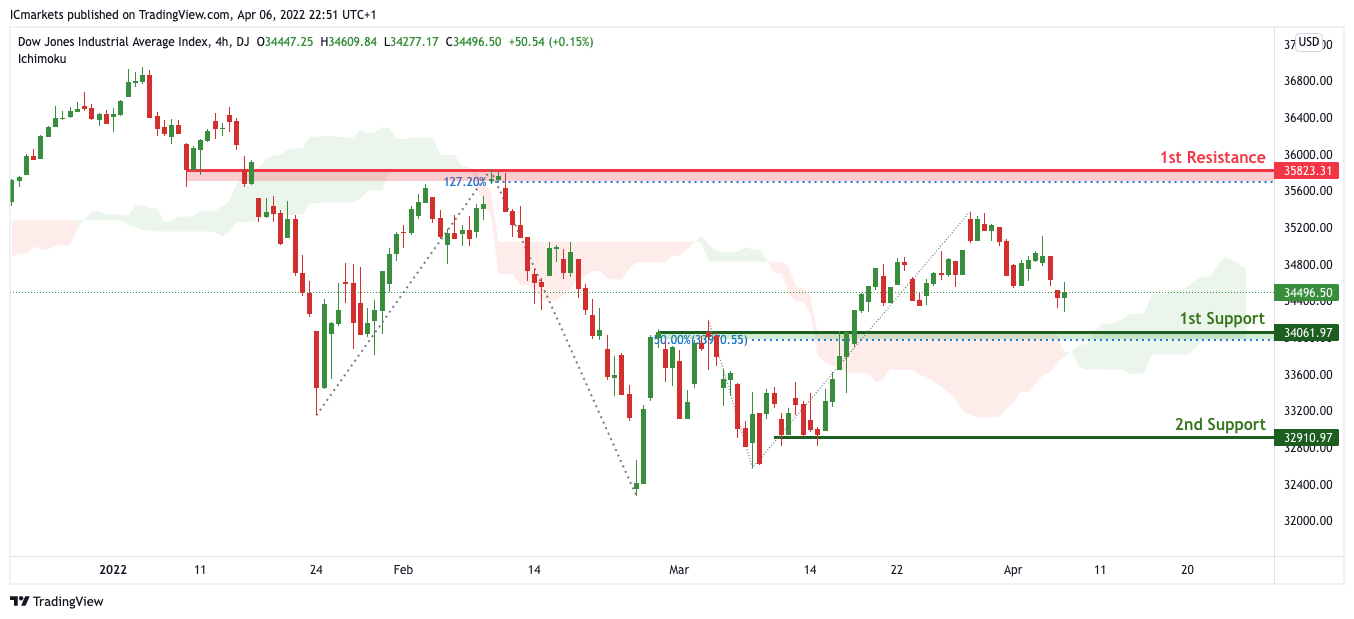
Dow Jones Industrial Average:
On the H4, with price moving above the ichimoku cloud, we have a bias that price will rise to our 1st resistance at 35823 in line with the 127.2% Fibonacci extension from our 1st support at 34061 in line with the horizontal pullback support and 50% Fibonacci retracement. Alternatively, price may break 1st support structure and head for 2nd support at 32910 in line with the horizontal swing low support.
Areas of consideration :
- H4 1st support at 34569
- H4 1st resistance at 35823


