
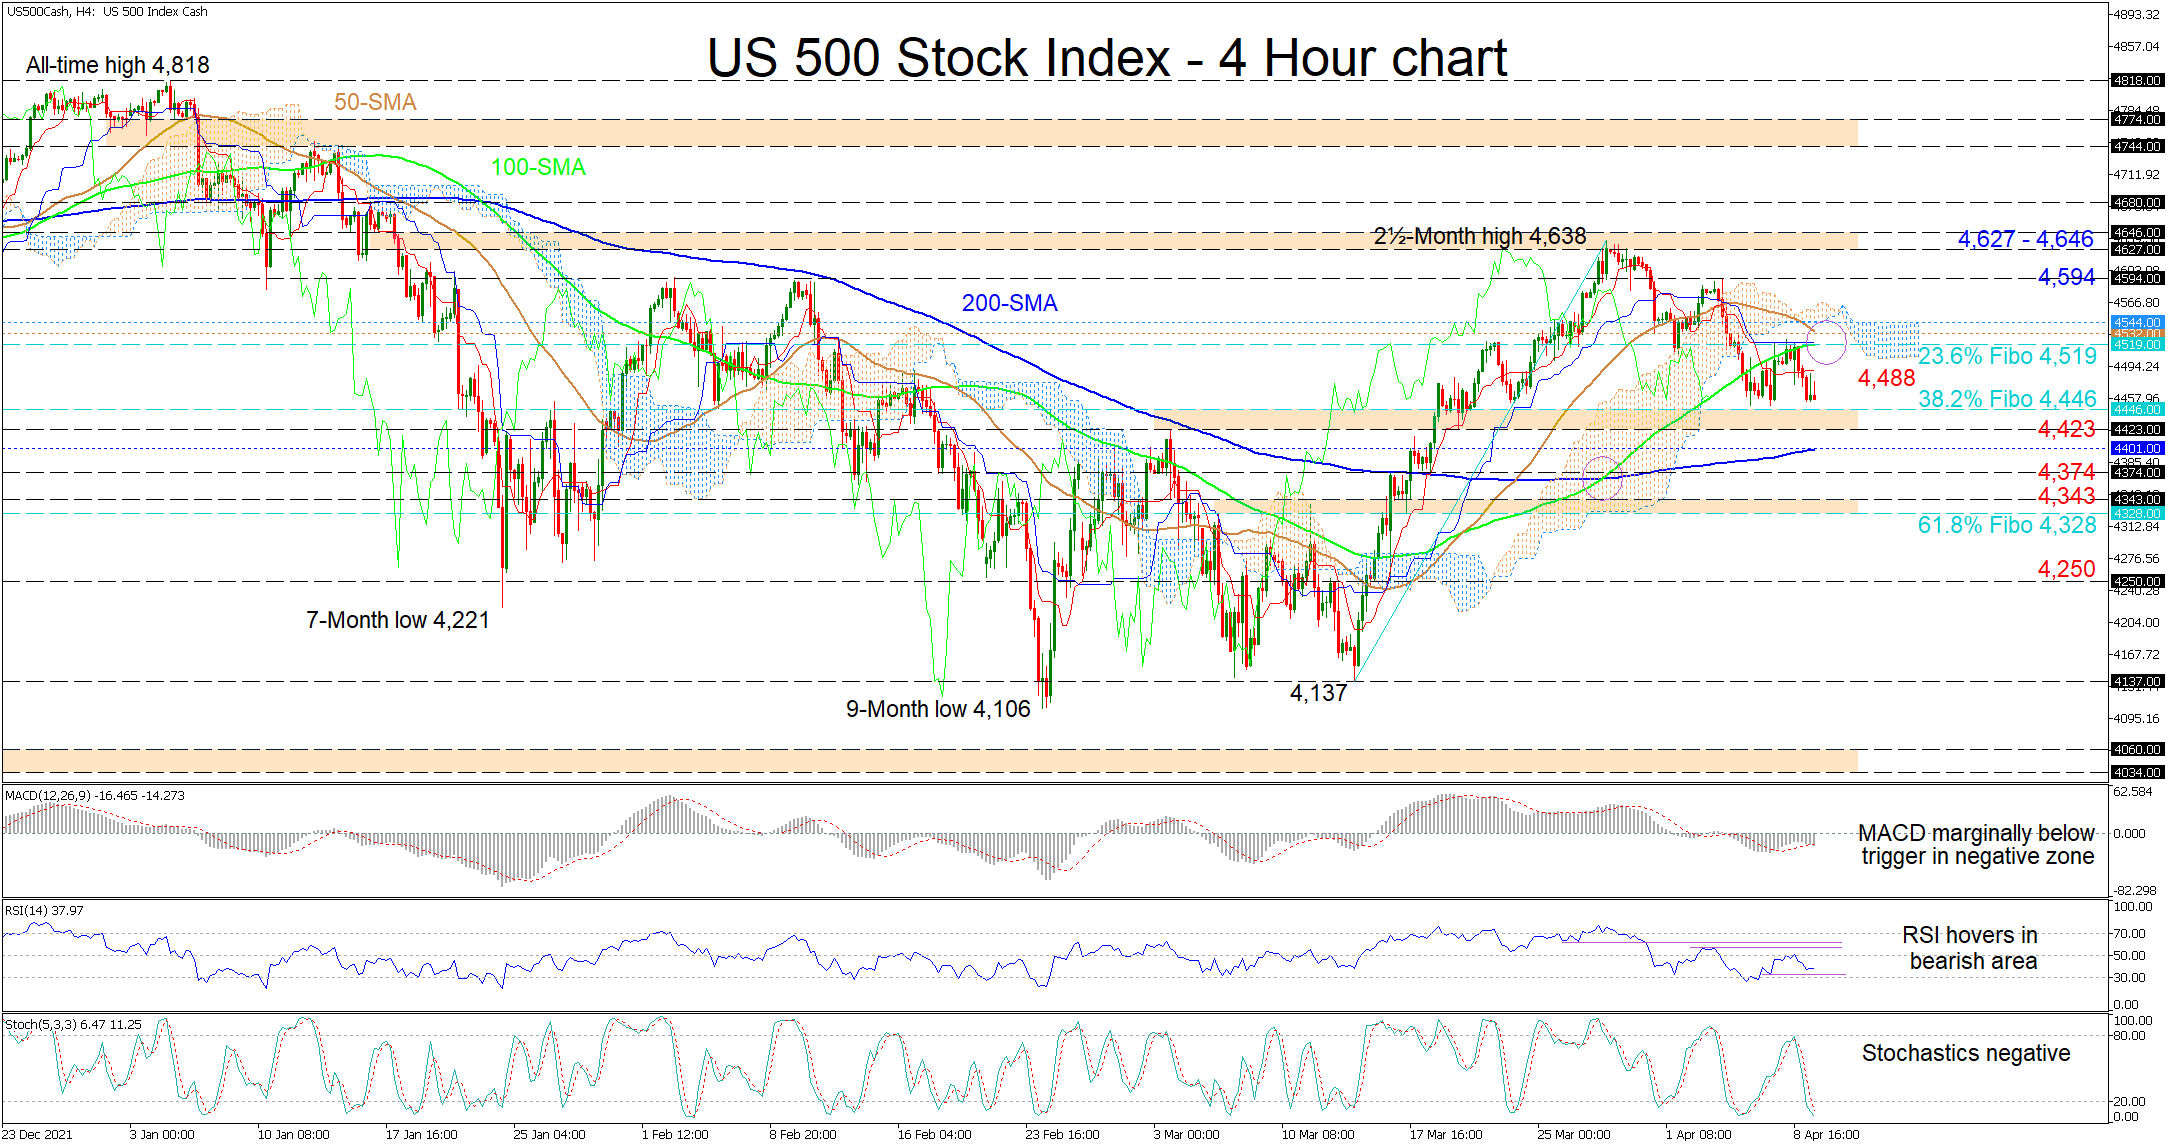
The US 500 stock index (Cash) is consolidating slightly north of the 4,446 level, which is the upper part of a support border and coincidentally the 38.2% Fibonacci retracement level of the up wave from 4,137 until 4,638. The rolling over of the 50-period simple moving average (SMA) and its nearing of a bearish crossover of the still climbing 100-period SMA, is reinforcing the waning in the index, and specifically weakness in the latest two-week rally.
Currently, the horizontal Ichimoku lines are indicating a pause in negative pressures, while the short-term oscillators continue to reflect a price preference aimed southward. The negatively charged stochastic oscillator and the bearish demeanour of the MACD are both promoting a renewal in downward forces. That said, for now the RSI is floating in the bearish region, failing to signal fresh directional momentum in the index.
In the negative scenario, an initial support barrier exists between the 38.2% Fibo of 4,446 and the 4,423 obstacle. If this critical support border fails to provide buyers with positive traction, they may shift their hopes towards the 200-period SMA underneath at 4,401. However, if selling interest intensifies, the 4,374 low could try to delay the test of the support boundary linking the 4,343 level to the 61.8% Fibo of 4,328. Should downward pressures overwhelm, the March 16 trough of 4,250 could then draw attention.
Alternatively, if buyers improve from the 38.2% Fibo’s vicinity and overstep the nearby red Tenkan-sen line at 4,488, significant upside limitations may arise from the 23.6% Fibo of 4,519 until the Ichimoku cloud’s upper band at 4,544. This key section encapsulates the bearish crossover of the 50-period SMA with the 100-period SMA and the flattened blue Kijun-sen line too. So, a successful jump in the price north of the cloud may propel the price toward the 4,594 barrier before buyers seek out the 4,627-4,646 resistance band.
Summarizing, the US 500 index has adopted a bearish bearing in April, which could gain pace if the price sinks below the 4,423-4,446 support. Moreover, a dive past the 61.8% Fibo of 4,328 may rekindle worries about a risk-off outlook. Yet, for optimism to return in the index, the price would need to climb north of the 4,627-4,646 deterrence.


