
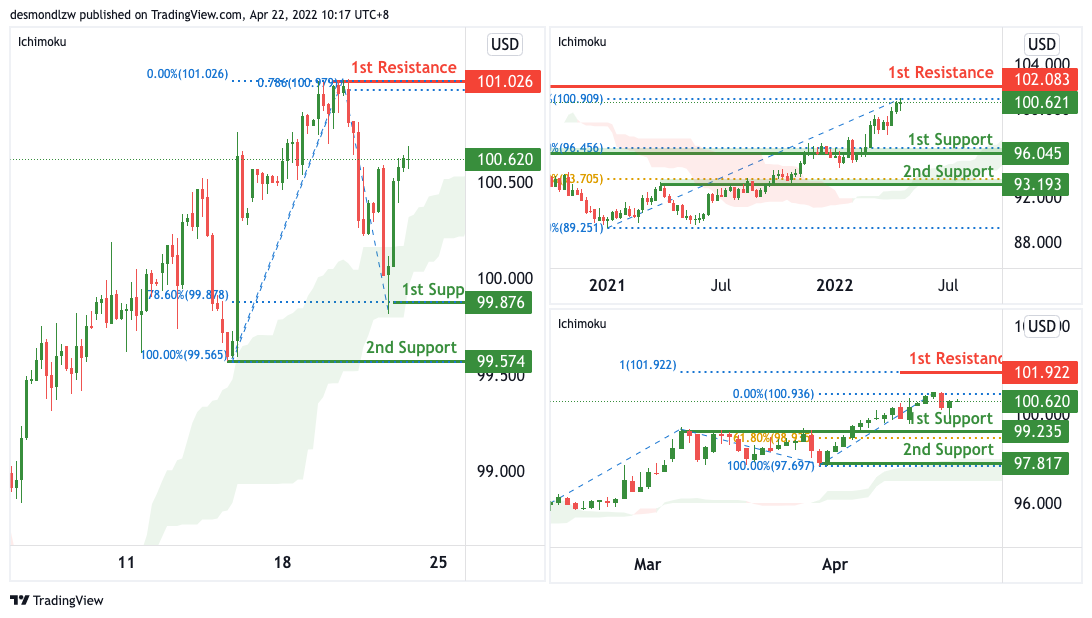
DXY:
On the Weekly, with price moving above the ichimoku cloud, we have a bullish bias that price will rise to our 1st resistance where the swing high resistance is from our 1st support in line with the horizontal pullback support. Alternatively, price may break 1st support structure and head for 2nd support where the horizontal swing low support is.
On the Daily, with price moving above the ichimoku cloud, we have a bullish bias that price will rise to our 1st resistance where the swing high resistance is from our 1st support in line with the horizontal pullback support. Alternatively, price may break 1st support structure and head for 2nd support where the horizontal swing low support is.
On the H4, with price moving above the ichimoku cloud, we have a bullish bias that price will rise to our 1st resistance of 101.026 in line with the swing high resistance and 78.6% Fibonacci projection from our 1st support of 99.876 in line with the 78.6% Fibonacci retracement. Alternatively, price may break 1st support and head for 2nd support at 99.574 in line with the 50% Fibonacci retracement. Our bullish bias is further supported by how price is expected to respect our ascending channel.
Areas of consideration:
- H4 time frame, 1st resistance at 101.026
- H4 time frame, 1st support at 99.876
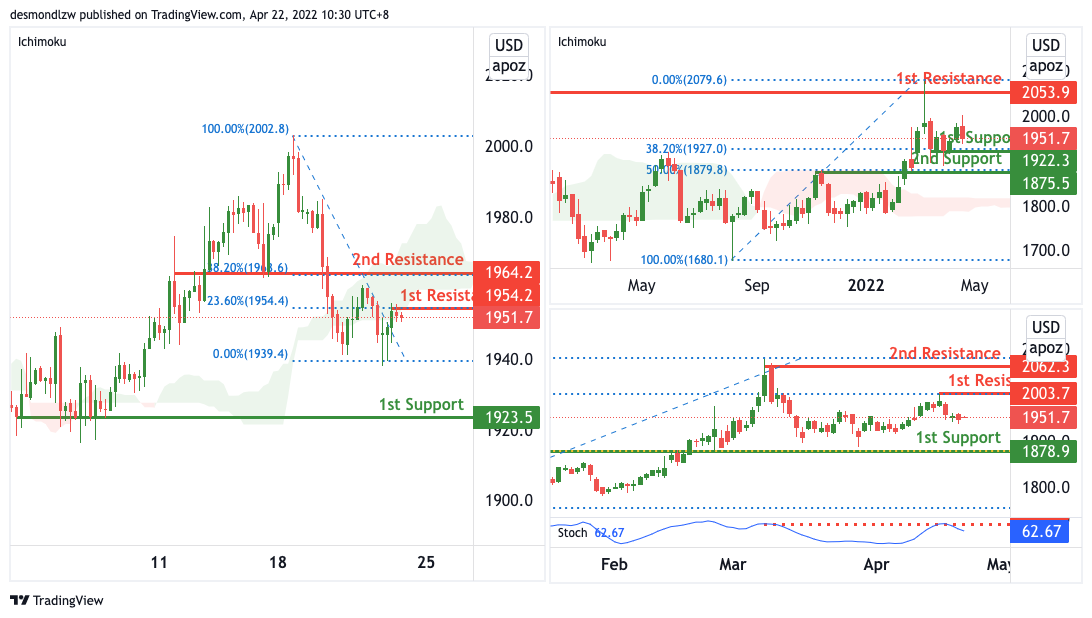
XAU/USD (GOLD):
On the Weekly, with price moving above the ichimoku cloud, we have a bullish bias that price will rise to our 1st resistance where the swing high resistance is from our 1st support in line with the horizontal pullback support. Alternatively, price may break 1st support structure and head for 2nd support where the horizontal swing low support is.
On the Daily, with price moving below the ichimoku cloud, we have a bearish bias that price will drop from our 1st resistance where the swing high resistance is to our 1st support in line with the horizontal pullback support. Alternatively, price may break 1st resistance structure and head for 2nd resistance where the horizontal swing high resistance is.
On the H4, We are expecting price to potentially dip from 1st resistance level of 1954.2 which is line with 23.6% Fibonacci retracement, along with a graphical pullback resistance towards the 1st support level of 1923.5 in line with a horizontal swing low support. Otherwise, price might break the 1st resistance level and head towards the 2nd resistance level of 1964.2.
Areas of consideration:
- H4 time frame, 1st Resistance at 1954.2
- H4 time frame, 1st Support at 1923.5
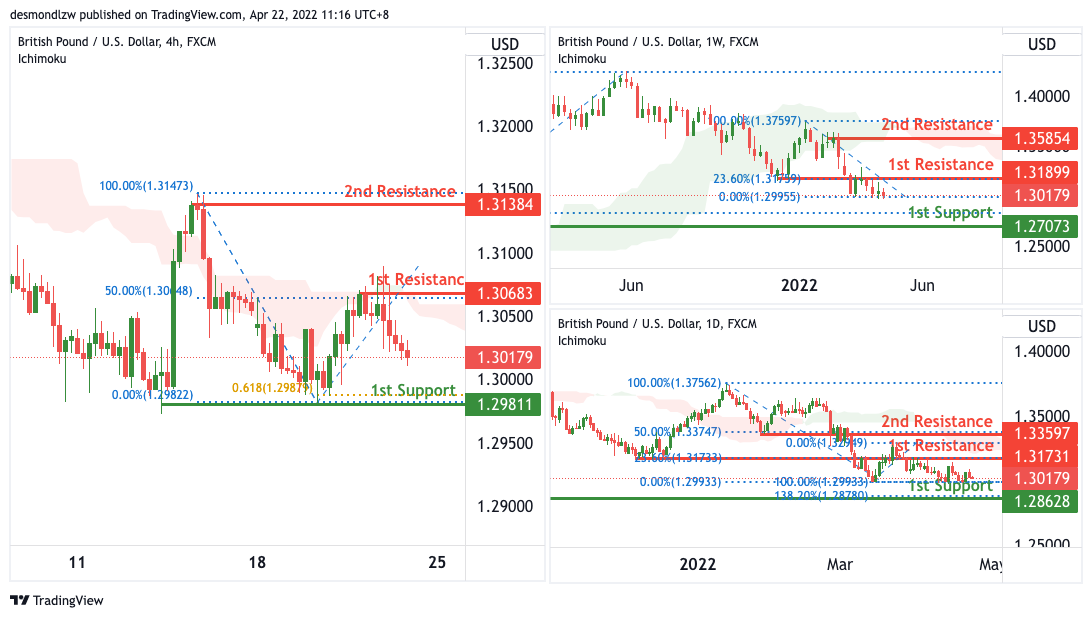
GBP/USD:
On the Weekly, with price moving below the ichimoku cloud, we have a bearish bias that price will drop from our 1st resistance where the swing high resistance is to our 1st support in line with the horizontal pullback support. Alternatively, price may break 1st resistance structure and head for 2nd resistance where the horizontal swing high resistance is.
On the Daily, with price moving below the ichimoku cloud, we have a bearish bias that price will drop from our 1st resistance where the swing high resistance is to our 1st support in line with the horizontal pullback support. Alternatively, price may break 1st resistance structure and head for 2nd resistance where the horizontal swing high resistance is.
On the H4, with price moving below the ichimoku cloud, we have a bearish bias that price will drop from our 1st resistance where the swing high resistance is to our 1st support in line with the horizontal pullback support. Alternatively, price may break 1st resistance structure and head for 2nd resistance where the horizontal swing high resistance is.
Areas of consideration:
- H4 1st resistance at 1.30683
- H4 1st support at 1.29811
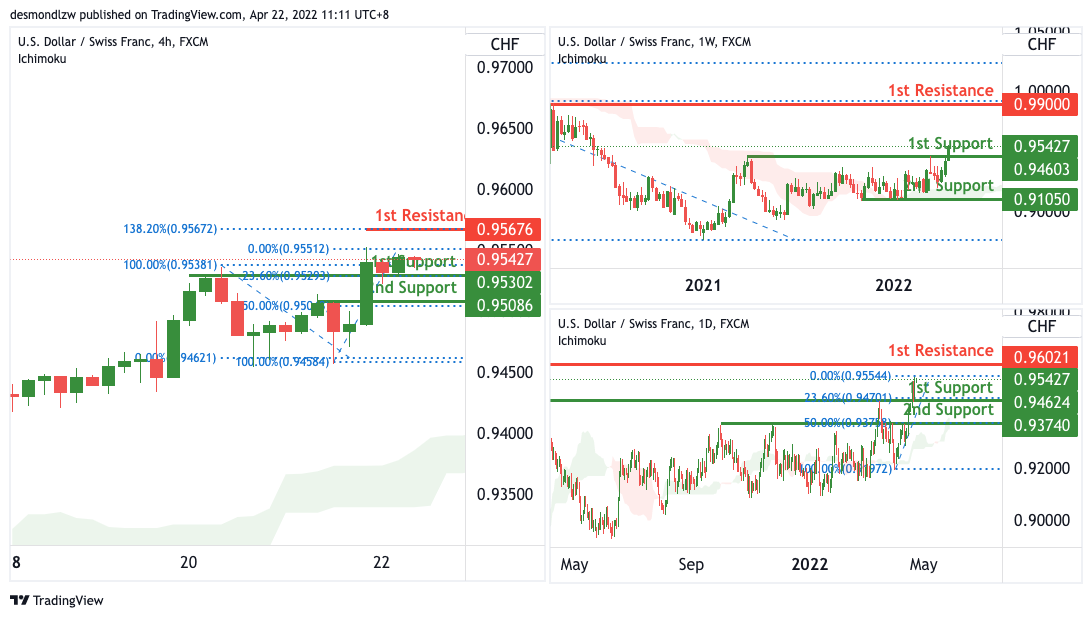
USD/CHF:
On the Weekly, with price moving above the ichimoku cloud, we have a bullish bias that price will rise to our 1st resistance where the swing high resistance is from our 1st support in line with the horizontal pullback support. Alternatively, price may break 1st support structure and head for 2nd support where the horizontal swing low support is.
On the Daily, with price moving above the ichimoku cloud, we have a bullish bias that price will rise to our 1st resistance where the swing high resistance is from our 1st support in line with the horizontal pullback support. Alternatively, price may break 1st support structure and head for 2nd support where the horizontal swing low support is.
On the H4, with price moving above the ichimoku cloud, we have a bullish bias that price will rise to our 1st resistance of 0.95676 in line with the 138.2% Fibonacci extension from our 1st support of 0.95302 in line with the 23.6% Fibonacci retracement. Alternatively, price may break 1st support and head for 2nd support at 0.94104 in line with the 50% Fibonacci retracement.
Areas of consideration
- 1st support level at 0.95302
- 1st resistance level at 95676
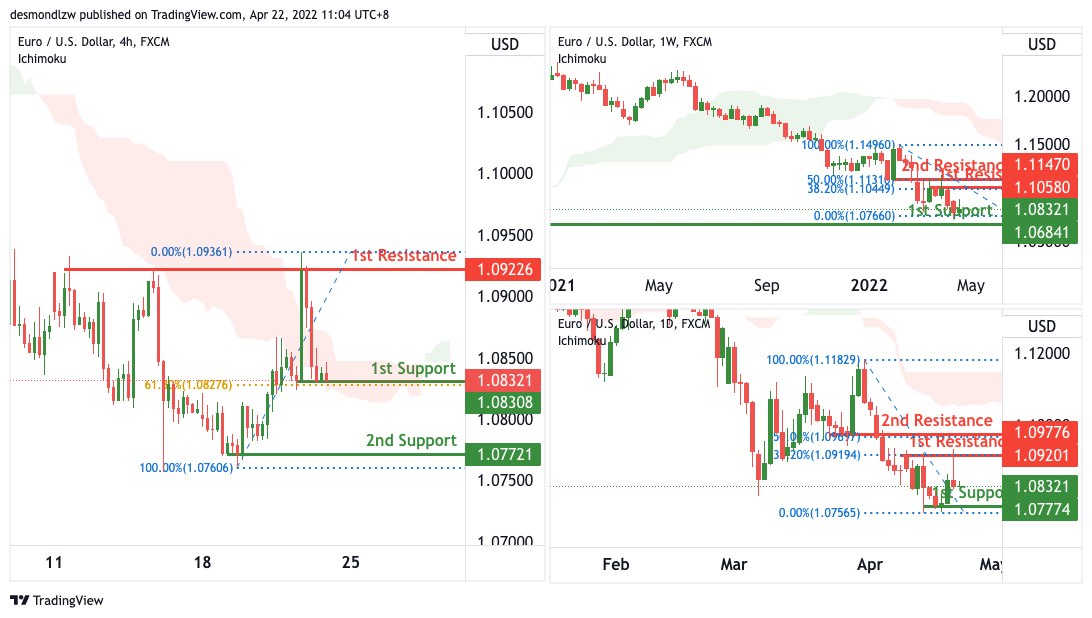
EUR/USD :
On the Weekly, with price moving below the ichimoku cloud, we have a bearish bias that price will drop from our 1st resistance where the swing high resistance is to our 1st support in line with the horizontal pullback support. Alternatively, price may break 1st resistance structure and head for 2nd resistance where the horizontal swing high resistance is.
On the Daily, with price moving below the ichimoku cloud, we have a bearish bias that price will drop from our 1st resistance where the swing high resistance is to our 1st support in line with the horizontal pullback support. Alternatively, price may break 1st resistance structure and head for 2nd resistance where the horizontal swing high resistance is.
On the Daily, with price expected to bounce off the ichimoku cloud support, we have a bullish bias that price will rise to our 1st resistance where the swing high resistance is from our 1st support in line with the horizontal pullback support. Alternatively, price may break 1st support structure and head for 2nd support where the horizontal swing low support is.
Areas of consideration :
- H4 1st resistance at 09226
- H4 1st support at 1.08308
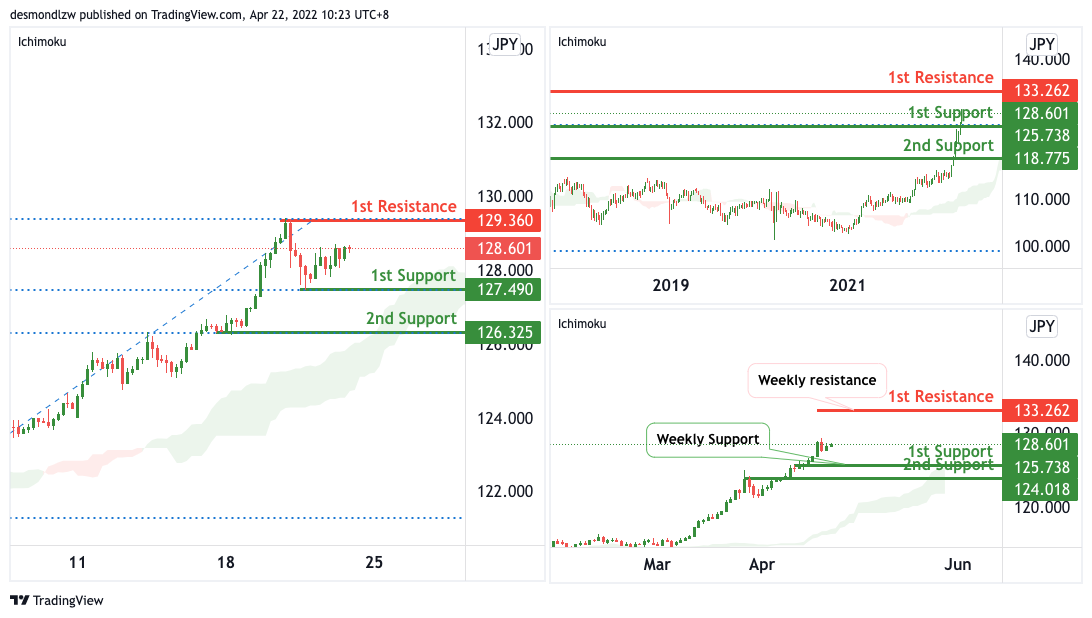
USD/JPY:
On the Weekly, with price moving above the ichimoku cloud, we have a bullish bias that price will rise to our 1st resistance where the swing high resistance is from our 1st support in line with the horizontal pullback support. Alternatively, price may break 1st support structure and head for 2nd support where the horizontal swing low support is.
On the Daily, with price moving above the ichimoku cloud, we have a bullish bias that price will rise to our 1st resistance where the swing high resistance is from our 1st support in line with the horizontal pullback support. Alternatively, price may break 1st support structure and head for 2nd support where the horizontal swing low support is.
On the H4, with price moving above the ichimoku cloud, we have a bullish bias that price will rise to our 1st resistance where the swing high resistance is from our 1st support in line with the horizontal pullback support. Alternatively, price may break 1st support structure and head for 2nd support where the horizontal swing low support is.
Areas of consideration:
- H4 time frame, 1st resistance at 129.360
- H4 time frame, 1st support at 127.490
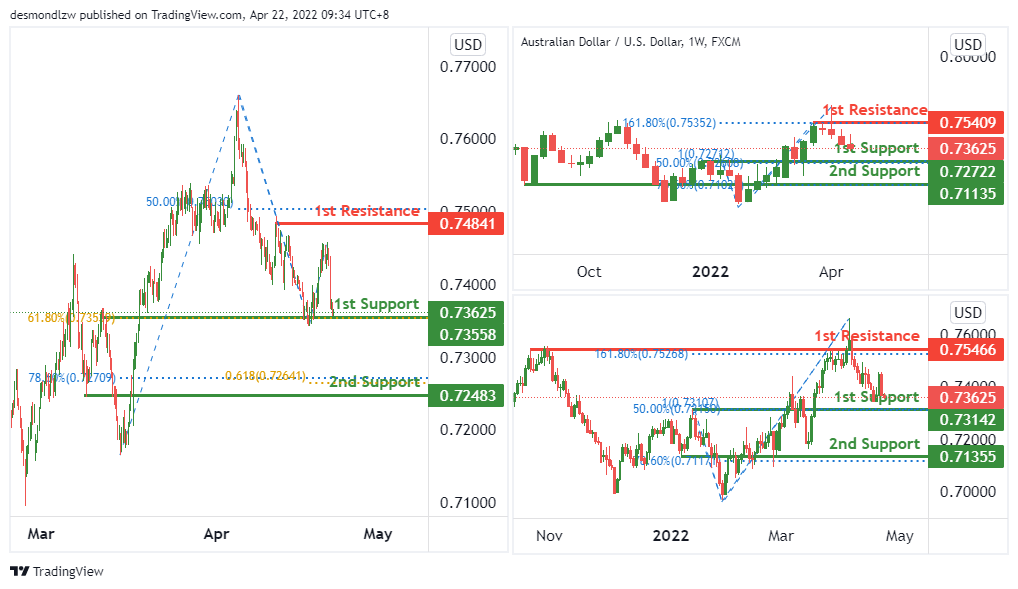
AUD/USD:
On the weekly timeframe, price is near to the key support level. We see the potential of a bullish bounce from 1st support level of 0.72722 in line with 50% fibonacci retracement and 100% fibonacci projection towards the 1st resistance level of 0.75409 in line with 161.8% fibonacci extension.
On the daily timeframe, price is near the key support level, We see the potential of a bullish bounce from 1st support level of 0.73142 in line with 50% fibonacci retracement and 100% fibonacci projection towards the 1st resistance level of 0.75466 in line with 161.8% fibonacci extension.
On the H4 timeframe, price is near the key support level, We see the potential of a bullish bounce from 1st support level of 0.73558 in line with 61.8% fibonacci retracement towards the 1st resistance level of 0.74841 in line with 50% fibonacci retracement. Otherwise, price might break the key support level and head towards the 2nd support of 0.72483 which is in line with 78.6% fibonacci retracement and 61.8% fibonacci projection.
Areas of consideration
- H4 1st resistance at 74841
- H4 1st support at 73625
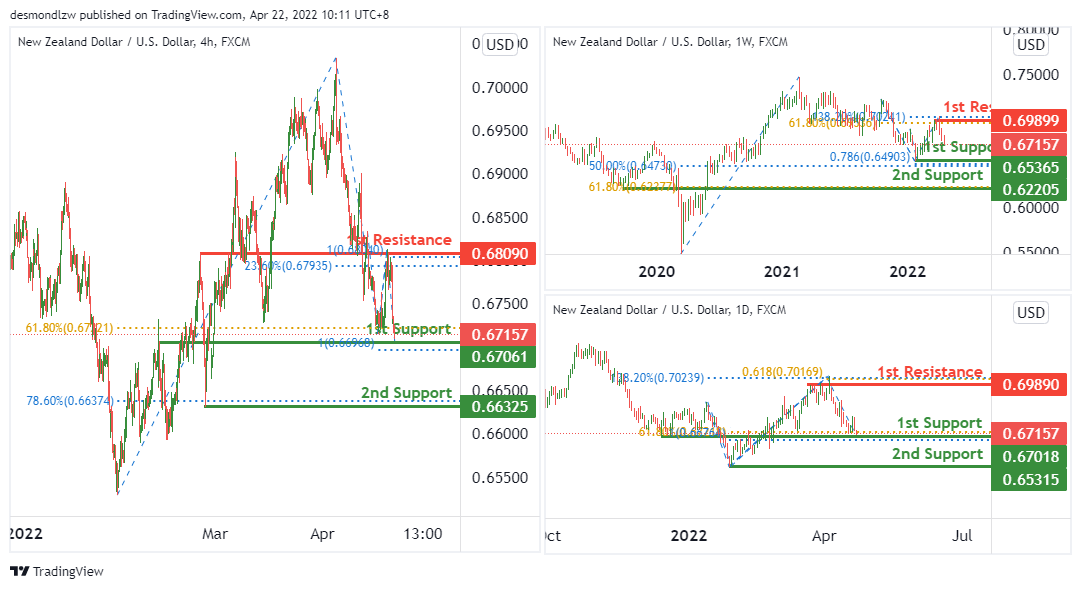
NZD/USD:
On the weekly, we see the potential of bullish bounce from 1st support level of 0.65365 line up with 50% fibonacci retracement and 78.6% fibonacci projection towards the 1st resistance level of 0.69899 in line with 38.2% fibonacci retracement and 61.8% fibonacci projection.
On the daily, we see the potential of bullish bounce from 1st support level of 0.67018 line up with 61.8% fibonacci retracement and 100% fibonacci projection towards the 1st resistance level of 0.69890 in line with 138.2% fibonacci extension and 61.8% fibonacci projection.
On the H4, we see the potential of bullish bounce from 1st support level of 0.67061 line up with 61.8% fibonacci retracement and 100% fibonacci projection towards the 1st resistance level of 0.68090 in line with 23.6% fibonacci retracement and 100% fibonacci projection.
Areas of consideration:
- H4 time frame, 1st support at 67061
- H4 time frame, 1st resistance at 0.68090
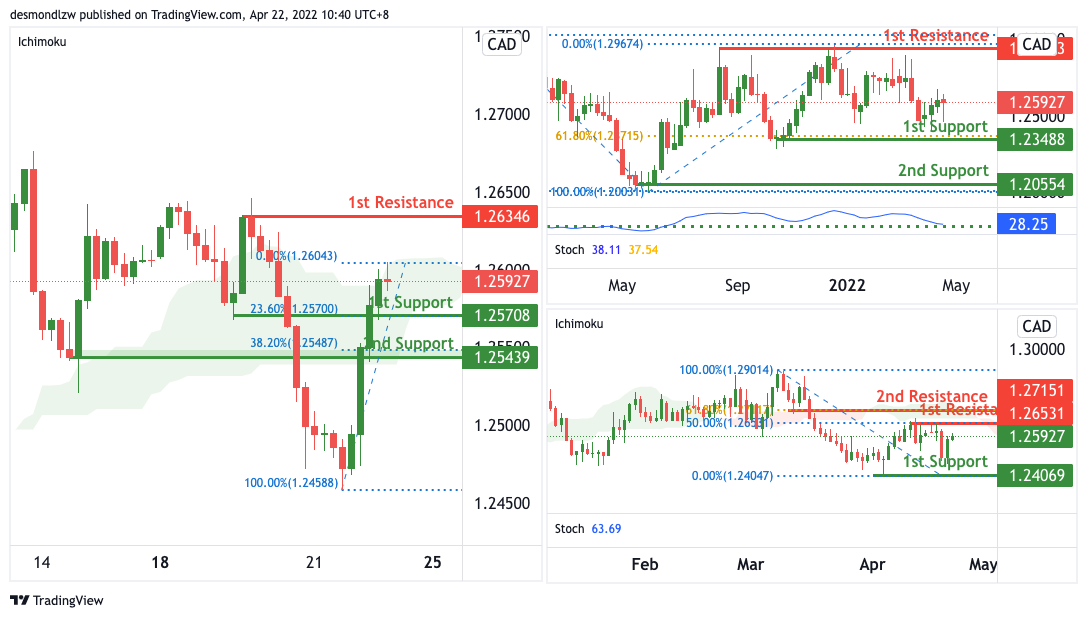
USD/CAD:
On the Weekly, with price moving above the ichimoku cloud, we have a bullish bias that price will rise to our 1st resistance where the swing high resistance is from our 1st support in line with the horizontal pullback support. Alternatively, price may break 1st support structure and head for 2nd support where the horizontal swing low support is.
On the Daily, with price moving below the ichimoku cloud, we have a bearish bias that price will drop from our 1st resistance where the swing high resistance is to our 1st support in line with the horizontal pullback support. Alternatively, price may break 1st resistance structure and head for 2nd resistance where the horizontal swing high resistance is.
On the H4, with price moving above the ichimoku cloud, we have a bullish bias that price will rise to our 1st resistance where the swing high resistance is from our 1st support in line with the horizontal pullback support. Alternatively, price may break 1st support structure and head for 2nd support where the horizontal swing low support is.
Areas of consideration:
- H4 time frame, 1st resistance at 1.26346
- H4 time frame, 1st support at 1.25708
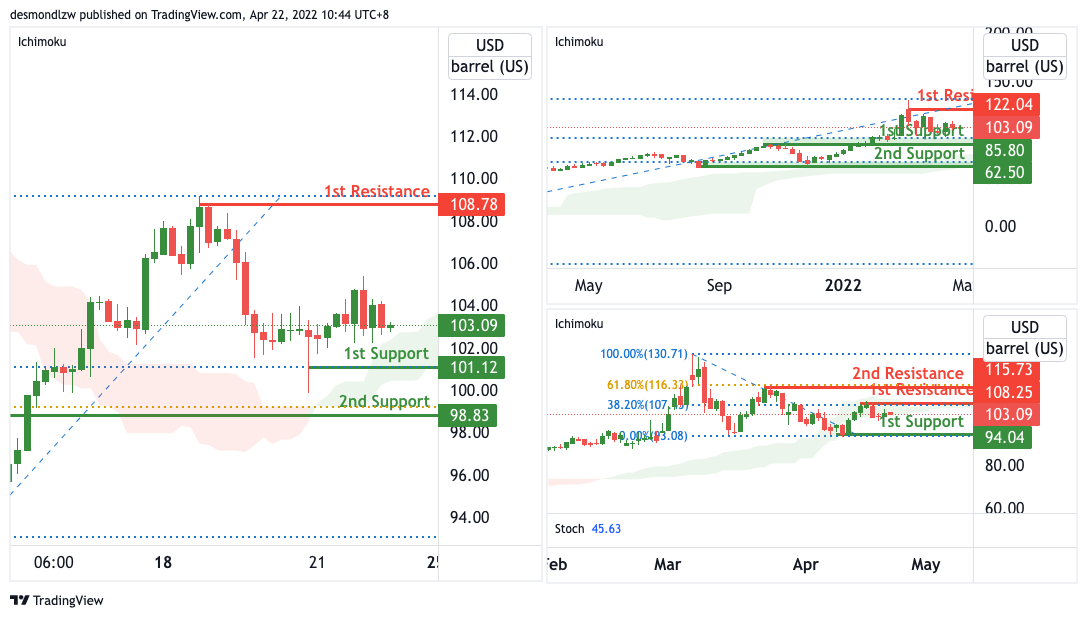
OIL:
On the Weekly, with price moving above the ichimoku cloud, we have a bullish bias that price will rise to our 1st resistance where the swing high resistance is from our 1st support in line with the horizontal pullback support. Alternatively, price may break 1st support structure and head for 2nd support where the horizontal swing low support is.
On the Daily, with price moving below the ichimoku cloud, we have a bearish bias that price will drop from our 1st resistance where the swing high resistance is to our 1st support in line with the horizontal pullback support. Alternatively, price may break 1st resistance structure and head for 2nd resistance where the horizontal swing high resistance is.
On the H4, with price moving above the ichimoku cloud, we have a bullish bias that price will rise to our 1st resistance where the swing high resistance is from our 1st support in line with the horizontal pullback support. Alternatively, price may break 1st support structure and head for 2nd support where the horizontal swing low support is.
Areas of consideration:
- H4 time frame, 1st resistance of 108.78
- H4 time frame, 1st support of 101.12
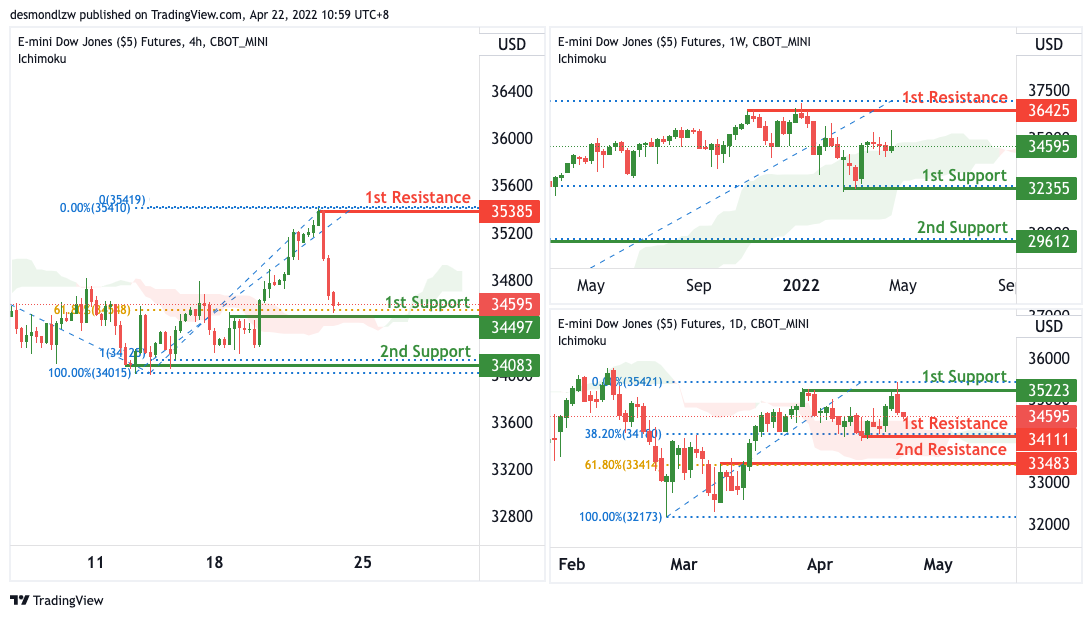
Dow Jones Industrial Average:
On the Weekly, with price moving above the ichimoku cloud, we have a bullish bias that price will rise to our 1st resistance where the swing high resistance is from our 1st support in line with the horizontal pullback support. Alternatively, price may break 1st support structure and head for 2nd support where the horizontal swing low support is.
On the Daily, with price moving above the ichimoku cloud, we have a bullish bias that price will rise to our 1st resistance where the swing high resistance is from our 1st support in line with the horizontal pullback support. Alternatively, price may break 1st support structure and head for 2nd support where the horizontal swing low support is.
On the H4, with price moving above the ichimoku cloud, we have a bullish bias that price will rise to our 1st resistance where the swing high resistance is from our 1st support in line with the horizontal pullback support. Alternatively, price may break 1st support structure and head for 2nd support where the horizontal swing low support is.
Areas of consideration :
- H4 time frame, 1st resistance at 35385
- H4 time frame, 1st support at 34497


