
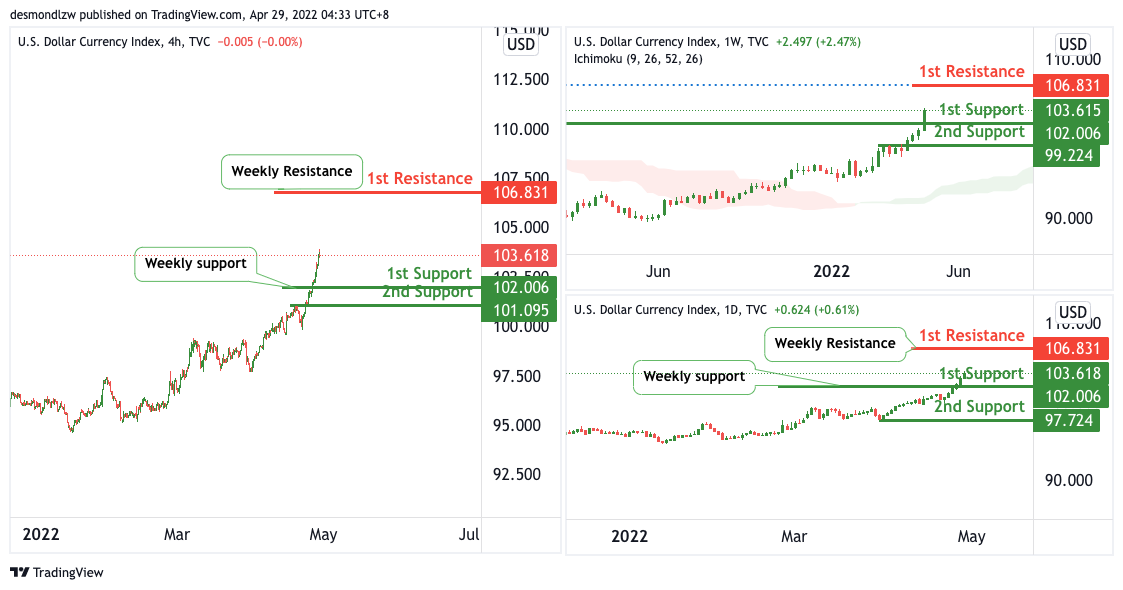
DXY:
On the Weekly, with price moving above the ichimoku cloud, we have a bullish bias that price will rise to our 1st resistance where the 127.2% Fibonacci extension is from our 1st support in line with the horizontal pullback support. Alternatively, price may break 1st support structure and head for 2nd support where the horizontal pullback support is.
On the Daily, with price moving above the ichimoku cloud, we have a bullish bias that price will rise to our 1st resistance where the weekly resistance is from our 1st support in line with the weekly support. Alternatively, price may break 1st support structure and head for 2nd support where the horizontal swing low support is.
On the H4, with price moving above the ichimoku cloud, we have a bullish bias that price will rise to our 1st resistance where the weekly resistance is from our 1st support in line with the weekly support. Alternatively, price may break 1st support structure and head for 2nd support where the horizontal swing low support is.
Areas of consideration:
- H4 time frame, 1st resistance at 106.831
- H4 time frame, 1st support at 102.006
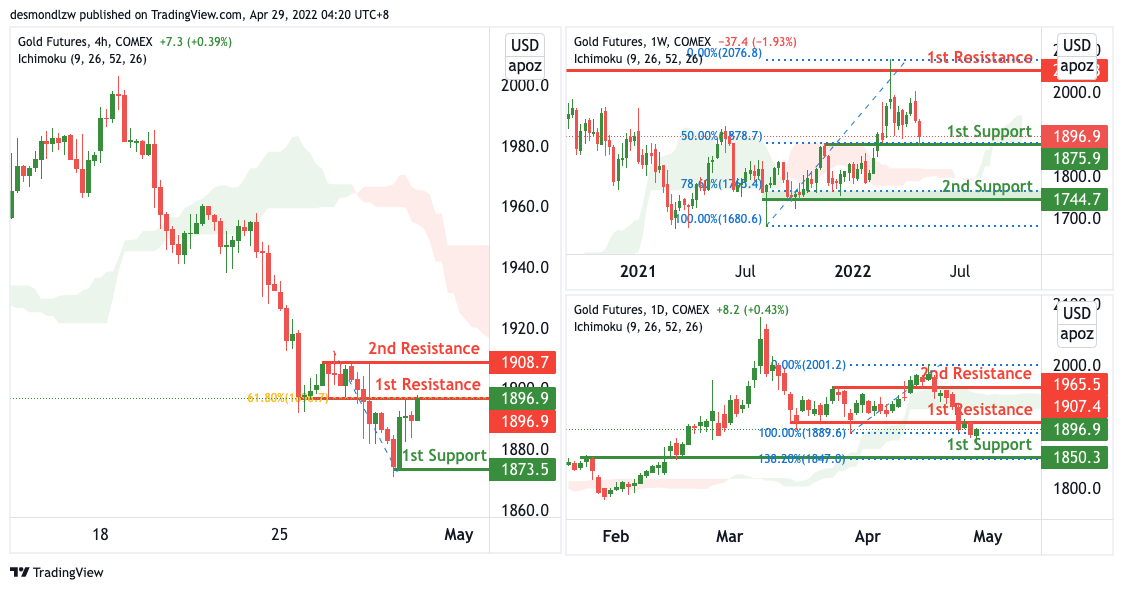
XAU/USD (GOLD):
On the Weekly, with price moving above the ichimoku cloud, we have a bullish bias that price will rise to our 1st resistance where the swing high resistance is from our 1st support at 1875 in line with the horizontal pullback support and 50% Fibonacci retracement. Alternatively, price may break 1st support structure and head for 2nd support where the 78.6% Fibonacci retracement and swing low support is.
On the Daily, with price moving below the ichimoku cloud, we have a bearish bias that price will drop from our 1st resistance where the horizontal pullback resistance is to our 1st support in line with the horizontal pullback support and 138.2% Fibonacci extension is. Alternatively, price may break 1st resistance structure and head for 2nd resistance where the horizontal pullback resistance is.
On the H4, with price moving below the ichimoku cloud, we have a bearish bias that price will drop from our 1st resistance where the 61.8% Fibonacci retracement is to our 1st support in line with the horizontal swing low support. Alternatively, price may break 1st resistance structure and head for 2nd resistance where the horizontal swing high resistance is.
Areas of consideration:
- H4 time frame, 1st Resistance at 1896
- H4 time frame, 1st Support at 1873
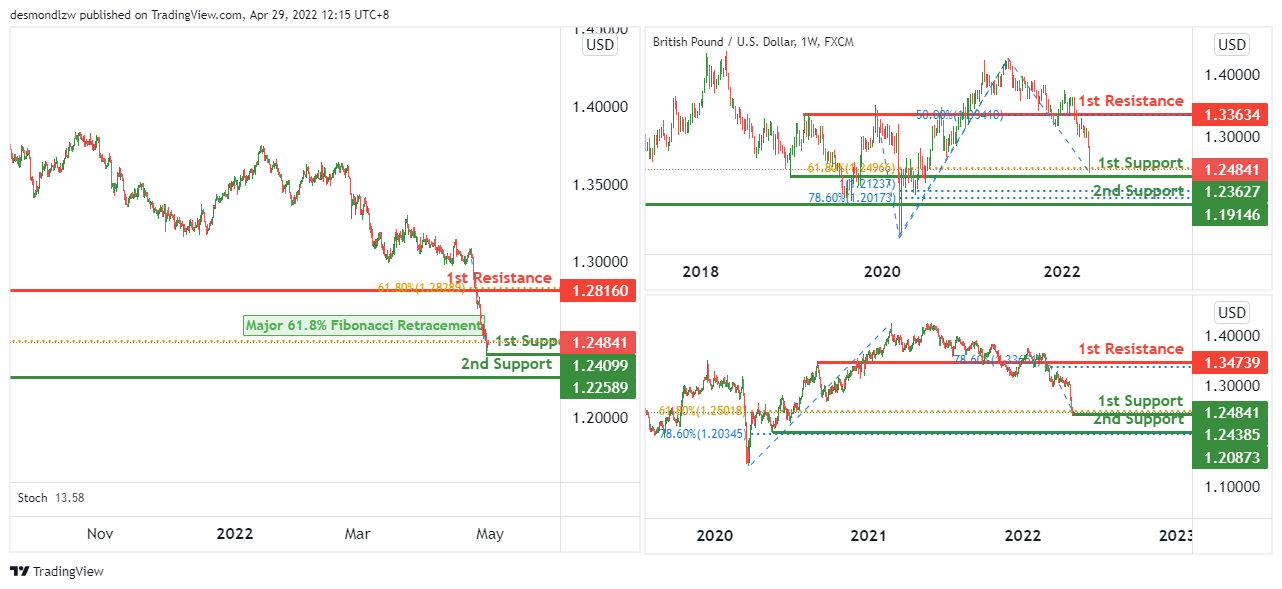
GBP/USD:
On the weekly, we expect price to potentially bounce from 1st support level of 1.23627 in line with 61.8% fibonacci retracement towards the 1st resistance level of 1.33634 in line with 50% fibonacci retracement.
On the daily, we expect price to potentially bounce from 1st support level of 1.24385 in line with 61.8% fibonacci retracement towards the 1st resistance level of 1.34739 in line with 78.6% fibonacci retracement.
On the H4, we have a bullish bias that price will bounce from 1st support level of 1.24099 which lines up with a major 61.8% fibonacci retracement towards the 1st resistance level of 1.28160 which lines up with 61.8% fibonacci retracement.
Areas of consideration:
- H4 1st resistance at 1.28160
- H4 1st support at 1.24099
- H4 2nd support at 1.22589
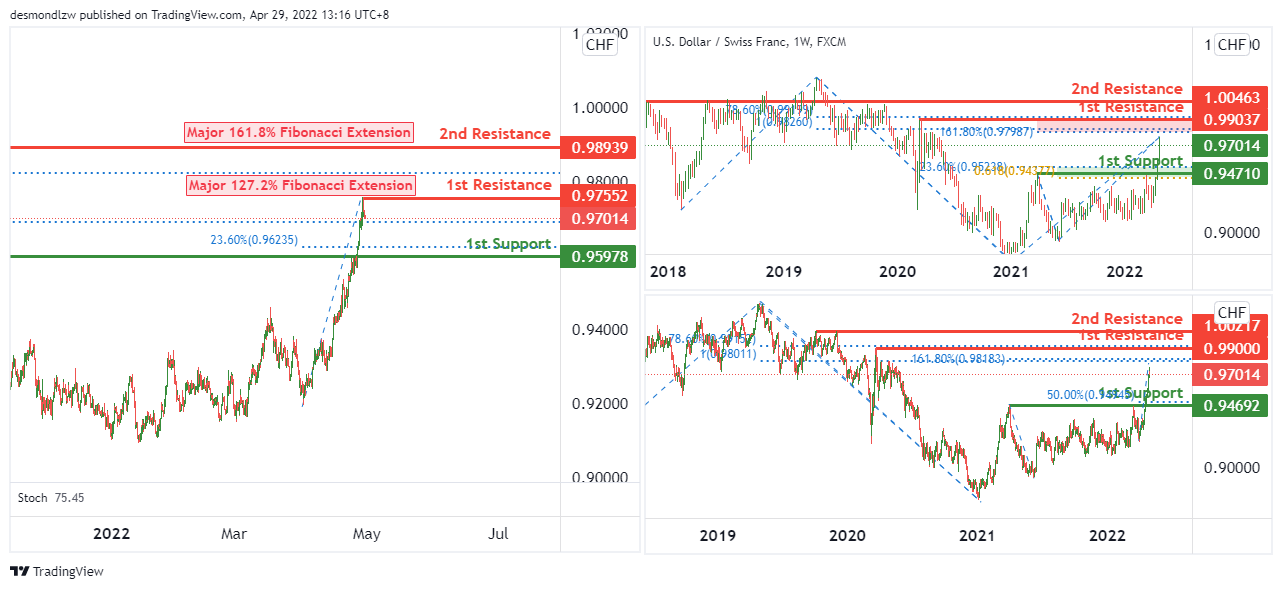
USD/CHF:
On the weekly, we expect that price will potentially reverse from 1st resistance level of 0.99037 in line with 78.6% fibonacci retracement, 161.8% fibonacci extension and100% fibonacci projection towards the 1st support level of 0.94710 in line with 23.6% fibonacci retracement and 61.8% fibonacci projection.
On the daily, we expect that price will potentially reverse from 1st resistance level of 0.99000 in line with 78.6% fibonacci retracement and 161.8% fibonacci extension towards the 1st support level of 0.94692 in line with 50% fibonacci retracement.
On the H4, we expect that price will potentially reverse from 1st resistance level of 0.97552 in line with a major 127.2% fibonacci extension towards the 1st support level of 0.95978 in line with 23.6% fibonacci retracement.
Areas of consideration
- 1st support level at 0.95978
- 1st resistance level at 0.97552
- 2nd resistance level at 0.98939
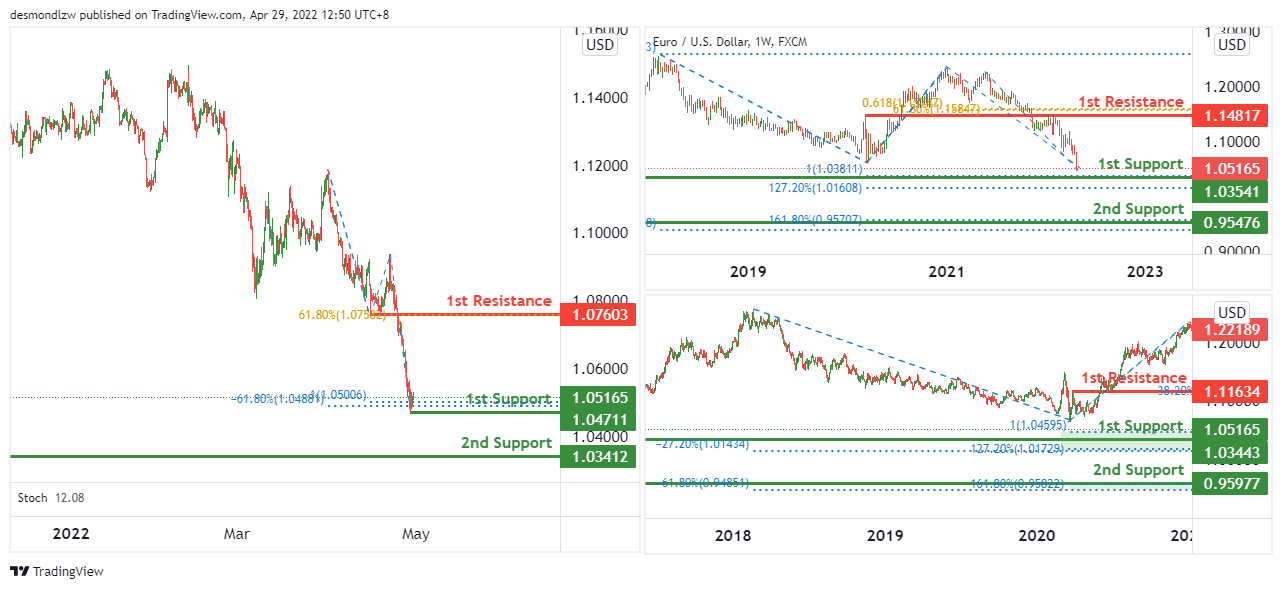
EUR/USD :
On the weekly, we expect price to potentially bounce from 1st support level of 1.03541 in line with 100% fibonacci projection and 127.2% fibonacci extension towards 1st resistance level of 1.14817 in line with 61.8% fibonacci retracement and 61.8% fibonacci projection.
On the daily, we expect price to potentially bounce from 1st support level of 1.03443 in line with 100% fibonacci projection, -27.2% fibonacci expansion and 127.2% fibonacci extension towards 1st resistance level of 1.11634 in line with 38.2% fibonacci retracement.
On the H4, price is near the pivot level. We expect price to potentially rise from 1st support level of 1.04711 in line with 100% fibonacci projection and -61.8% fibonacci expansion towards the 1st resistance level of 1.07603 in line with 61.8% fibonacci retracement.
Areas of consideration :
- H4 1st resistance at 1.07603
- H4 1st support at 1.04711
- H4 2nd support at 1.03412
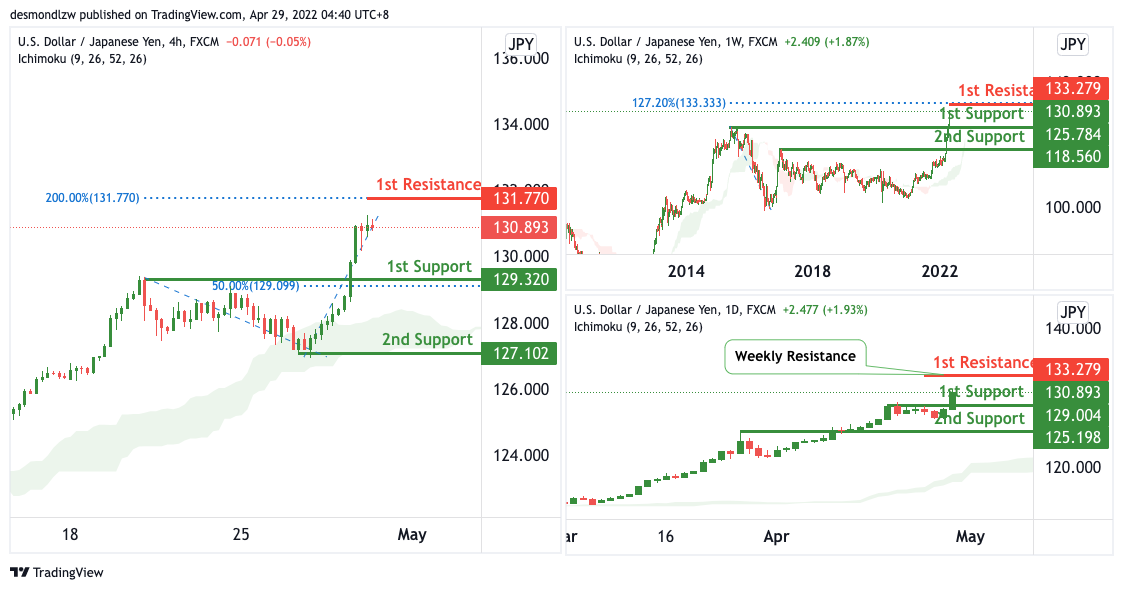
USD/JPY:
On the Weekly, with price moving above the ichimoku cloud, we have a bullish bias that price will rise to our 1st resistance where the s127.2% Fibonacci extension is from our 1st support in line with the horizontal pullback support. Alternatively, price may break 1st support structure and head for 2nd support where the horizontal pullback support is.
On the Daily, with price moving above the ichimoku cloud, we have a bullish bias that price will rise to our 1st resistance where the weekly resistance is from our 1st support in line with the horizontal pullback support. Alternatively, price may break 1st support structure and head for 2nd support where the horizontal pullback support is.
On the H4, with price moving above the ichimoku cloud, we have a bullish bias that price will rise to our 1st resistance where the 200% Fibonacci extension is from our 1st support in line with the horizontal pullback support and 50% Fibonacci retracement. Alternatively, price may break 1st support structure and head for 2nd support where the horizontal swing low support is.
Areas of consideration:
- H4 time frame, 1st resistance at 131.770
- H4 time frame, 1st support at 129.320
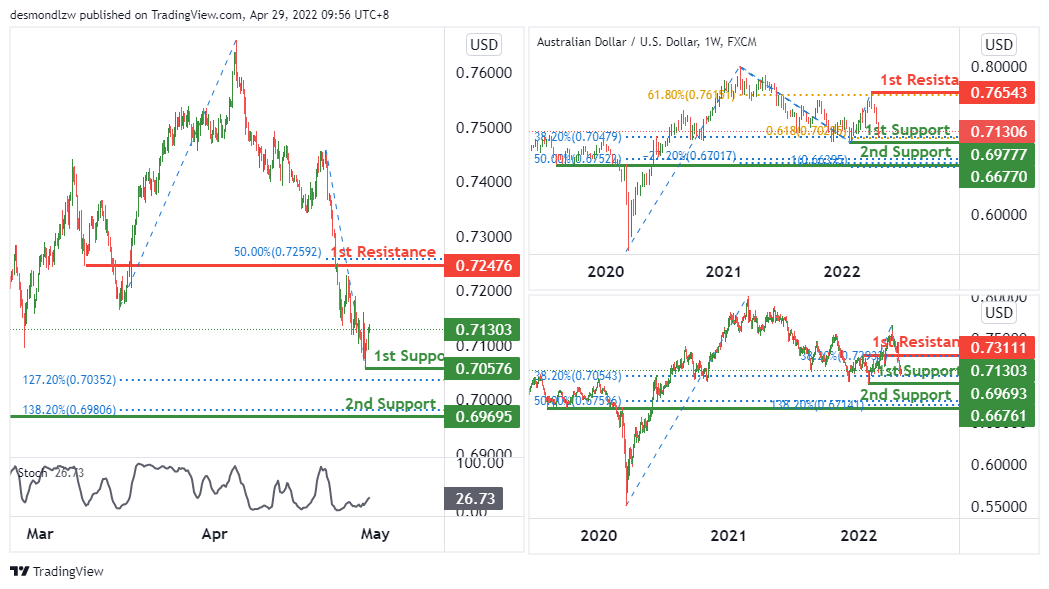
AUD/USD:
On the weekly timeframe, we see the potential of a bullish bounce from 1st support level of 0.69777 in line with 38.2% fibonacci retracement and 61.8% fibonacci projection towards the 1st resistance level of 61.8% fibonacci retracement.
On the daily timeframe, we expect to see a potential of a bullish bounce from 1st support level of 0.69693 in line with 38.2% fibonacci retracement towards the 1st resistance level of 0.73111 in line with 38.2% fibonacci retracement.
On the H4 timeframe, price is near the key support level, We see the potential of a bullish bounce from 1st support level of 0.70576 in line with 127.2% fibonacci extension towards the 1st resistance level of 0.72476 in line with 50% fibonacci retracement. Otherwise, price might break the key support level to trigger a dip towards the 2nd support of 0.69695 which is in line with 138.2% fibonacci extension.
Areas of consideration
- H4 1st resistance at 0.72476
- H4 1st support at 0.70576
- H4 2nd support at 0.69695
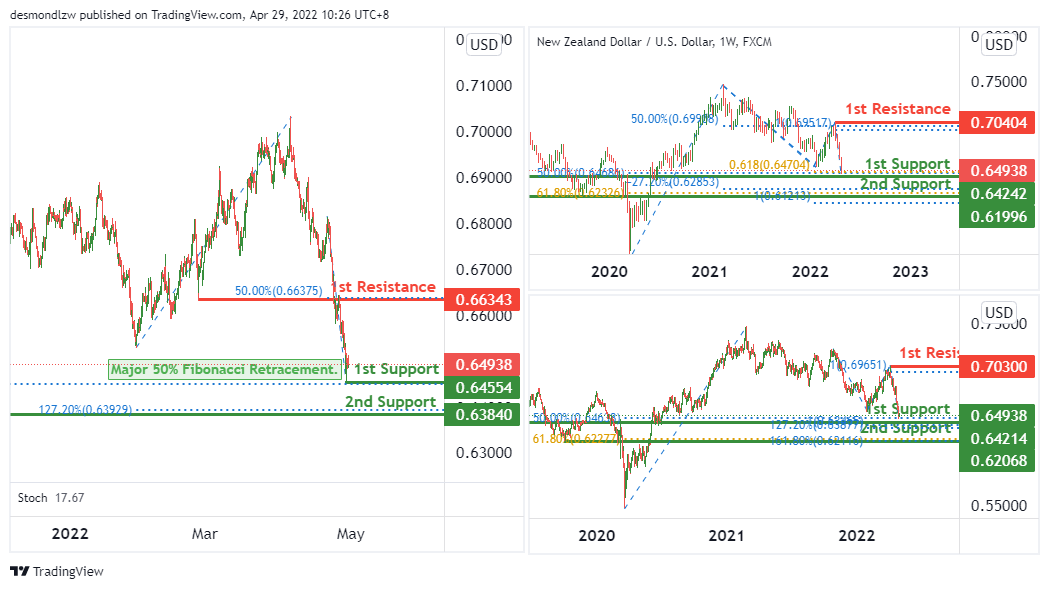
NZD/USD:
On the weekly, we see the potential for a bullish bounce from 1st support level of 0.64242 in line with 50% fibonacci retracement and 61.8% fibonacci projection towards the 1st resistance level of 0.70404 in line with 50% fibonacci retracement and 100% fibonacci projection.
On the daily, we see the potential for a bullish bounce from 1st support level of 0.64214 in line with 50% fibonacci retracement and 127.2% fibonacci extension towards the 1st resistance level of 0.70300 in line with 100% fibonacci projection.
On the H4, we see the potential of bullish bounce from 1st support level of 0.64554 in line up with a major 50% fibonacci retracement towards the 1st resistance level of 0.66343 in line with 50% fibonacci retracement.
Areas of consideration:
- H4 time frame, 1st support at 0.64554
- H4 time frame, 1st resistance at 0.66343
- H4 time frame, 2nd support at 0.63840
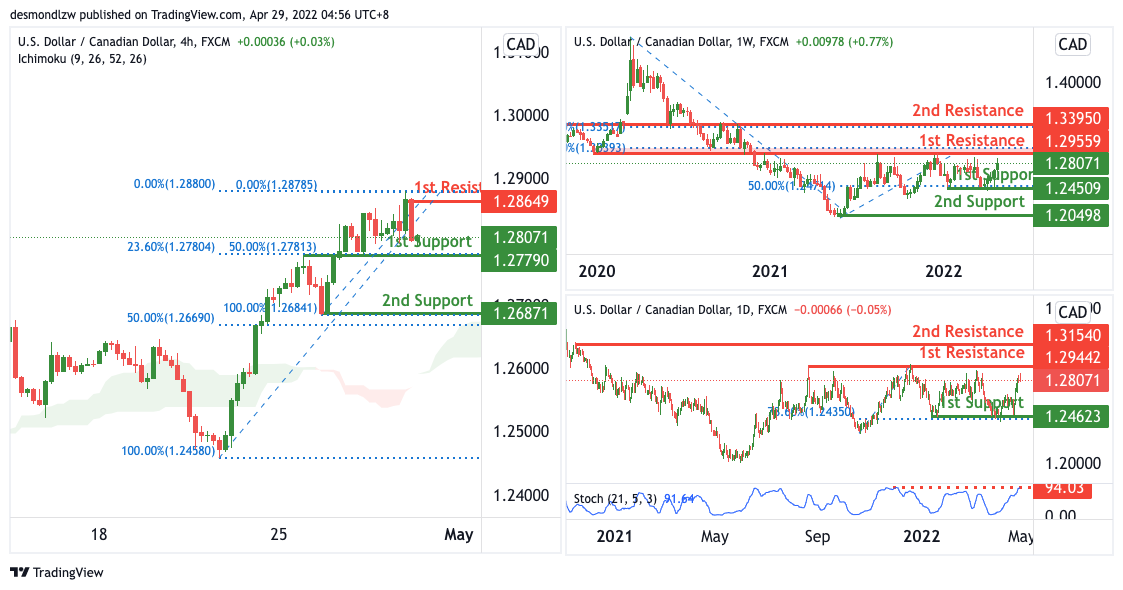
USD/CAD:
On the Weekly, with no clear indication of where price is going, we have a bias that price will continue to move within our rectangle with support at 1.24623 and resistance at 1.29559.
On the Daily, with price expected to reverse off the stochastics indicator, we have a bearish bias that price will drop from our 1st resistance where the swing high resistance is to our 1st support in line with the 78.6% Fibonacci retracement. Alternatively, price may break 1st resistance structure and head for 2nd resistance where the horizontal swing high resistance is.
On the H4, with price moving above the ichimoku cloud, we have a bullish bias that price will rise to our 1st resistance at 1.28649 where the swing high resistance is from our 1st support at 1.27790 in line with the horizontal pullback support, 23.6% and 50% Fibonacci retracement. Alternatively, price may break 1st support structure and head for 2nd support where the horizontal swing low support and 50% Fibonacci retracement is.
Areas of consideration:
- H4 time frame, 1st resistance at 1.28649
- H4 time frame, 1st support at 1.27790
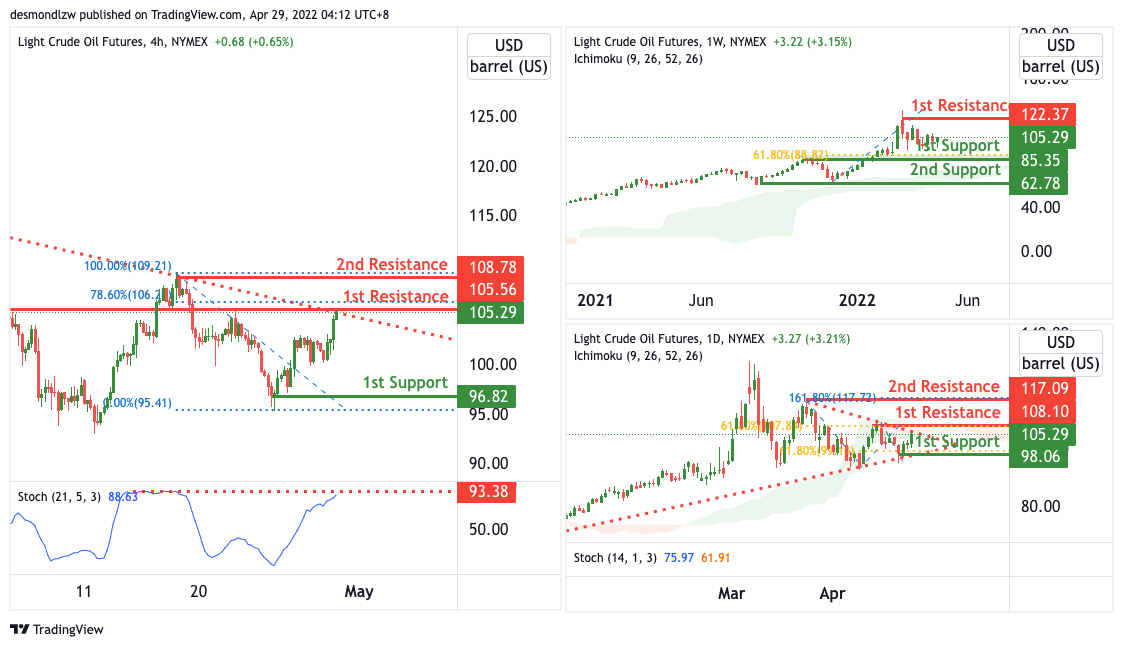
OIL:
On the Weekly, with price moving above the ichimoku cloud, we have a bullish bias that price will rise to our 1st resistance where the swing high resistance is from our 1st support in line with the horizontal pullback support and 61.8% Fibonacci retracement. Alternatively, price may break 1st support structure and head for 2nd support where the horizontal swing low support is.
On the Daily, with price expected to reverse off the resistance of the ichimoku cloud and the resistance of the triangle, we have a bearish bias that price will drop from our 1st resistance at 108.10 where the swing high resistance and 61.8% Fibonacci retracement is to our 1st support at 98.06 in line with the horizontal swing low support and 61.8% Fibonacci retracement. Alternatively, price may break 1st resistance structure and head for 2nd resistance where the horizontal swing high resistance and 161.8% Fibonacci extension at 117.09.
On the H4, with price expected to reverse off the resistance of the stochastics indicator and the resistance of the descending trendline, we have a bearish bias that price will drop from our 1st resistance at 105.56 where the swing high resistance and 78.6% Fibonacci retracement is to our 1st support at 96.82 in line with the horizontal swing low support. Alternatively, price may break 1st resistance structure and head for 2nd resistance where the horizontal swing high resistance at 108.78.
Areas of consideration:
- H4 time frame, 1st resistance of 105.56
- H4 time frame, 1st support of 96.82
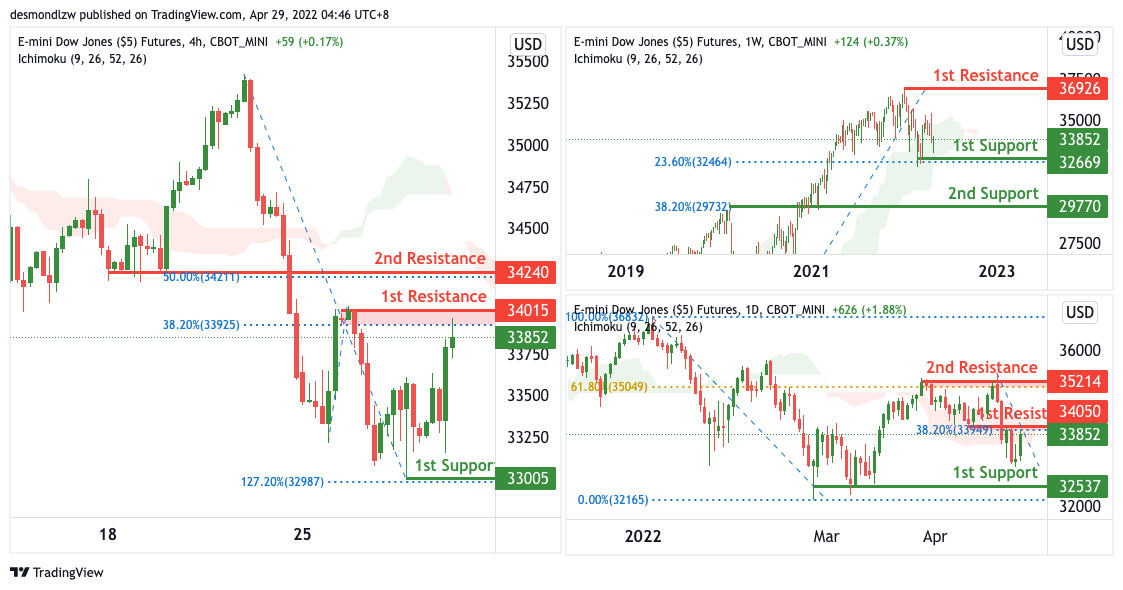
Dow Jones Industrial Average:
On the Weekly, with price expected to bounce off the support of the ichimoku cloud, we have a bullish bias that price will rise to our 1st resistance where the swing high resistance is from our 1st support in line with the horizontal swing low support and 23.6% Fibonacci retracement. Alternatively, price may break 1st support structure and head for 2nd support where the horizontal pullback support and 38.2% Fibonacci retracement is.
On the Daily, with price expected to reverse off the resistance of the ichimoku cloud, we have a bearish bias that price will drop from our 1st resistance where the pullback resistance and 38.2% Fibonacci retracement is to our 1st support in line with the horizontal swing low support. Alternatively, price may break 1st resistance structure and head for 2nd resistance where the horizontal swing high resistance and 61.8% Fibonacci retracement.
On the H4, with price moving below the ichimoku cloud, we have a bearish bias that price will drop from our 1st resistance at 30415 where the swing high resistance and 38.2% Fibonacci retracement is to our 1st support at 33005 in line with the horizontal swing low support. Alternatively, price may break 1st resistance structure and head for 2nd resistance where the horizontal pullback resistance and 50% Fibonacci retracement.
Areas of consideration :
- H4 time frame, 1st resistance at 30415
- H4 time frame, 1st support at 33005


